
Abstract
Background: Antisense oligonucleotides (ASOs) have been conjugated to various moieties, such as peptides, antibodies or Fab regions of antibodies, to enhance their delivery to target tissues. The quantitation of free ASO (ASO payload) is critical to characterize its pharmacokinetics/pharmacodynamics (PK/PD) properties and biodistribution after delivery of the peptide/antibody/Fab ASO conjugates. Results: We developed a hybridization-based LC-MS/MS methodology for quantification of free ASO in tissues in the presence of Fab–ASO and ASO with linker (ASO-linker). Conclusion: The developed method was applied to measure accurately the free ASO concentrations in liver and gastrocnemius in mice that were dosed with Fab-ASO. This methodology has also been applied to free ASO bioanalysis for other antibody-ASO and Fab-ASO conjugates in various tissues and plasma/serum samples.
Background
Antisense oligonucleotides (ASOs) have been conjugated to various moieties, such as antibodies or Fab regions of antibodies, to enhance their delivery to target tissues.
Accurate and reliable quantitation of free ASO (ASO payload) from antibody–ASO or Fab–ASO conjugates is critical to characterize its pharmacokinetics/pharmacodynamics properties and biodistribution after delivery of the antibody/Fab ASO conjugates.
Results
The interference of Fab–ASO and ASO-linker to free ASO quantitation was evaluated and minimized by selecting a proper MRM transition.
Hybridization extraction did not cause any significant degradation or conversion of Fab–ASO1 to ASO1 or ASO1-linker.
Minimal (0.1%) conversion from Fab–ASO1 to ASO1 may happen during the proteinase K digestion step.
The proteinase K digestion step in the sample preparation was removed to avoid the interferences caused by digestion of Fab–ASO or ASO-linker.
Satisfactory recovery of free ASO was achieved in plasma and tissue homogenate (tenfold homogenization with buffer) without the proteinase K digestion step.
Conclusion
The study reported the first LC-MS/MS bioanalytical method for the quantification of free ASO payload from Fab-ASO conjugates.
The developed LC-MS/MS method is ready to quantify free ASOs from Fab–ASOs or antibody–oligonucleotide conjugates in various biological matrices.
1. Background
Antisense oligonucleotides (ASOs) are short, synthesized, single-stranded oligonucleotides. They are designed to specifically bind to the target mRNA and modulate protein expression via various mechanisms. The ASO–RNA heteroduplexes can act as substrates for RNase enzymes; the RNases degrade the mRNA in the heteroduplex. The ASO can also target the AUG start codon on the mRNA to sterically block the interaction of mRNA with ribosomes and cause translational arrest [Citation1–4]. With the multiple antisense mechanism of actions, numerous ASO drug candidates are in clinical development to treat a variety of diseases, e.g., cardiovascular, neurological, neuromuscular diseases and cancers [Citation5–8].
One major challenge for ASO-based therapy is the inefficient delivery of ASOs to target organs and tissues by systemic administration. ASOs are typically large (∼4–10 kDa) and hydrophilic and therefore do not efficiently pass through the plasma membrane [Citation9]. There have been efforts to enhance ASO delivery to tissues/cells by covalent conjugation of ASOs with various moieties such as peptides, antibodies and Fab regions of antibodies [Citation10,Citation11]. For example, cell-penetrating peptides have been conjugated to ASOs [Citation12]. Moreover, specific receptors on the cell surface can recognize antibodies or Fab regions and facilitate the distribution of ASO conjugates. A human transferrin receptor (TfR)-binding molecule was used to facilitate the transportation of ASOs across the blood brain barrier to multiple central nervous system regions and all major cell types [Citation13]. The angiotensin II (Ang II) peptide ASO conjugates facilitate the target delivery of ASO in tissues and cells with abundant AGTR1 (the principal receptor for Ang II) expression [Citation14]. In the antibody–oligonucleotide conjugates (AOCs) where the free ASO moiety is the pharmacologically active form or the payload, it is important to measure the concentration of the free or unconjugated ASO in the plasma and tissues to study its pharmacokinetics (PK), biodistribution and its relationship with pharmacodynamic (PD) effect. In plasma and tissue samples, along with free ASO there may be intact AOCs and/or ASO with linker (ASO-linker) that may cause interferences to the free ASO quantitation. Therefore, developing an accurate bioanalytical method for quantifying the free ASO in the presence of AOCs and ASO-linker is needed for supporting preclinical PK/PD, toxicokinetic studies and clinical PK studies.
Ligand-binding assays are commonly used for quantitative bioanalysis of ASO because of their high sensitivity, throughput and reproducibility [Citation15]; however, the ligand-binding assay method has the drawback of low specificity. The assay is often challenging to differentiate the parent ASO from its truncate metabolites (e.g., n-1, n-2 metabolites) or the ASO with small modifications such as the ASO-linker. Quantitative PCR (qPCR) and hybridization LC-fluorescence are two additional technologies for ASO bioanalysis with high sensitivity and broad dynamic range [Citation16,Citation17]. Unfortunately both methods lack specificity: the primers in the qPCR assay target both ASO and ASO-linker; the fluorescence probe hybridizes with both ASO and ASO-linker. LC-MS/MS has also been commonly used for ASO bioanalysis with the unique advantage of high specificity [Citation18–20]. The ASO, ASO metabolites and ASO-linker can be distinguished by the combination of chromatographic separation and mass spectrometric detection. Recently, novel hybridization LC-MS methods for ASO and siRNA bioanalysis were developed and validated in different biological matrices [Citation21–28]. The method utilized the complementary strand of the ASO analyte as the probe to selectively hybridize and extract the target ASO from biological matrices, which provided high specificity and sensitivity.
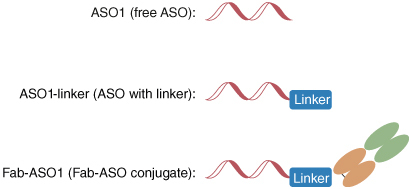
Here we used Fab–ASO1, a Fab-ASO conjugate, as the model compound to develop the hybridization LC-MS/MS methodology for quantitation of the free ASO payload from AOCs in tissue samples. For Fab–ASO1, the active payload, ASO1, was conjugated using a maleimide linker to the Fab region of an antibody that can bind to specific receptors in the target tissues to enhance the delivery of ASO1 (). There were two major challenges in developing the method. First, the Fab–ASO1 presented in the samples may be degraded/converted to the free ASO1 during the sample preparation process which would cause overestimation for the measurement of the free ASO1. The concentrations of Fab–ASO1 could be much higher than the concentrations of free ASO1 in study samples, especially at the early timepoints, so even a small amount of conversion from the high concentration Fab–ASO1 may cause significant overestimation of free ASO1. In this work, we evaluated if the sample preparation process (proteinase K digestion and hybridization) would cause the degradation/conversion of Fab–ASO1 to the free ASO1 or ASO1 with linker (ASO1-linker). Based on the results, we modified the sample preparation method by removing the proteinase K digestion step to avoid any interferences caused by digestion. We further evaluated and optimized the extraction conditions to ensure the consistent and reliable recovery of the free ASO1 without a digestion step. Second, Fab–ASO1 remaining in the samples, especially at early timepoints, plus any potential ASO1-linker generated in vivo may cause interference to the quantification of the free ASO1. We evaluated the potential interference of ASO1-linker and Fab–ASO1 to the free ASO1 during LC-MS/MS analysis.
Figure 1. Scheme of ASO1, ASO1-linker and Fab–ASO1.
Upon successful development and evaluation, this hybridization LC-MS/MS method was applied to a mouse study to obtain the concentrations of free ASO1 in liver and gastrocnemius in mice that were dosed with Fab–ASO1. The LC-MS/MS method later has been validated or qualified for quantitation of ASO1 in serum and tissue samples and used to support GLP safety studies in mice and monkeys. The developed methodology was also applied to other AOCs for the quantitation of free ASO in plasma and tissue samples from mice dosed with AOCs. To the best of our knowledge, this is the first reported bioanalytical method for the quantification of free ASO payload from Fab–ASO conjugates or AOCs by LC-MS/MS.
2. Materials & methods
2.1. Materials, reagents & apparatus
ASO1 (free ASO), Fab–ASO1 (Fab–ASO conjugate), ASO1-linker (ASO with linker) and ASO-IS, the analogue internal standard (IS), were proprietary compounds obtained from Biogen, Inc (MA, USA) and its collaborator. The basic compound information is shown in . Biotinylated capture probe (3′-BiotinTEG-DNA, complementary to ASO1) was synthesized by Integrated DNA Technologies (IA, USA). 1,1,1,3,3,3-hexafluoro-2-propanol (HFIP), Dynabeads MyOne streptavidin C1 and RNA grade proteinase K solution (20 mg/ml) were purchased from Thermo Fisher Scientific (MA, USA). Clarity OTX lysis-loading buffer was obtained from Phenomenex (CA, USA). Tween 20, Trizma base (Tris) and sodium chloride (NaCl) were obtained from MilliporeSigma (MA, USA). N,N-dimethylcyclohexylamine (DMCHA) was purchased from TCI America (OR, USA). DL-1,4-dithiothreitol (DTT), ethylenediaminetetraacetic acid (EDTA) and acetonitrile (ACN) were acquired from Fisher Scientific (NH, USA). Control mouse plasma (K2EDTA) and tissues (brain, liver, gastrocnemius) were ordered from BioIVT (NY, USA).
Table 1. Analyte and IS information.
A KingFisher Flex Purification System from ThermoFisher Scientific (MA, USA) was used for hybridization extraction. A FastPrep-24™ Classic Bead Beating Grinder and Lysis System from MP Biomedicals (CA, USA) was used for the homogenization of tissue samples.
2.2. LC-MS/MS instrumentation & conditions
The chromatographic separation was conducted using a Sciex ExionLC AD UHPLC system (MA, USA) with a Phenomenex Clarity Oligo-XT column (50 × 2.1 mm, 1.7 μm, CA, USA) and a ternary flow system with mobile phase A (water), mobile phase B (ACN) and mobile phase C (250 mM HFIP and 150 mM DMCHA in ACN). The total flow rate was 0.50 ml/min with 0.45 ml/min mobile phase A/B and 0.05 ml/min mobile phase C. The separation gradient was 0% B to 20% B from 0 to 2.5 min, followed with two gradient cycles of 20–100% B with 0.6 ml/min mobile phase A/B and 0 ml/min mobile phase C and an equilibration at the initial condition for 2 min. The injection volume was 10 μl. The column temperature was 60°C.
The MS/MS detection was conducted using a Sciex QTRAP 6500+ mass spectrometer (MA, USA) in electrospray negative ion mode with optimized ion source parameters: curtain gas (CUR) at 40, collision gas (CAD) at high, IonSpray voltage (IS) at -3500, temperature (TEM) at 550, ion source Gas 1 (GS1) at 80 and Gas 2 (GS2) at 60. The multiple reaction monitoring (MRM) transitions and parameters used for the quantitation of the ASO analyte and the IS were summarized in .
Table 2. MS parameters of ASO analyte and internal standard.
2.3. Hybridization extraction of ASO from tissues
The hybridization extraction method was adapted from a previously published method with slight modification [Citation21]. Preparation of the capture beads: the streptavidin magnetic beads were washed and resuspended to double the original volume with the binding and washing (B&W) buffer (5 mM Tris, 1 M NaCl, 0.5 mM EDTA and 0.05% Tween 20 in water). Then 40 μl of 200 μM capture probe was added to 1.5 ml beads suspension and incubated for 1 h at room temperature. After incubation, the coated beads were washed and resuspended to the original volume with the B&W buffer. Hybridization sample extraction: 100 μl STDs and QCs in liver homogenate, stability QCs in tissue homogenates or tissue samples were loaded to the plate and 100 μl of liver or gastrocnemius homogenate were added for matrix matching; 200 μl of digestion mix (100 mM Tris, 250 mM NaCl, 10 mM EDTA, 10 mM DTT, 2 mg/ml proteinase K) was added to digest proteins. The plate was incubated at 65°C for 2 h on an Eppendorf Thermomixer (NY, USA) running at 600 rpm. Then 400 μl of capture buffer (10 mM Tris, 500 mM NaCl, 1 mM EDTA and 0.05% Tween 20 in water) was added. For non-digested samples, 200 μl of digestion buffer (100 mM Tris, 250 mM NaCl, 10 mM EDTA) and 400 μl of capture buffer were added; 15 μl of capture beads were added to each sample and mixed at room temperature for 45 min. The beads were washed twice with the capture buffer and once with the wash buffer (10 mM Tris, 50 mM NaCl, 1 mM EDTA and 0.05% Tween 20 in water). Finally, the beads were transferred to a pre-heated plate containing 200 μl of ASO diluent (25 mM HFIP, 15 mM DMCHA, 100 μM EDTA and 0.05% mouse plasma K2EDTA in water: ACN 90:10% v/v) with 25 ng/ml ASO-IS and rigorously agitated for 15 min at 90°C to elute the captured analyte and generate the hybridization extract.
2.4. Evaluation of interference of ASO1-linker, Fab–ASO1 to ASO1
Stock solutions of ASO1, ASO1-linker, Fab–ASO1, ASO-IS were prepared at the concentration of 1.00 mg/ml in water. Individual ASO1 and ASO1-linker solutions were prepared at 500 ng/ml by dilution of the stock solutions using ASO diluent. Fab–ASO1 solution was prepared at 2250 ng/ml with ASO diluent to obtain similar molar concentration to the 500 ng/ml ASO1 solution. The ASO1, ASO1-linker and Fab–ASO1 solutions were analyzed for ASO1 by LC-MS/MS.
2.5. Evaluation of proteinase K digestion & hybridization on potential degradation of Fab–ASO1 or ASO1-linker
Two hundred microliter each of 500 ng/ml ASO1, 500 ng/ml ASO1-linker and 2250 ng/ml Fab–ASO1 in neat solution (ASO diluent) were extracted with three different methods: (1) no treatment (digestion or hybridization extraction); (2) hybridization extraction without proteinase K digestion; and (3) proteinase K digestion followed by hybridization extraction. The resulting sample extracts and the standards in neat solution were then analyzed for ASO1 and ASO1-linker by LC-MS/MS.
2.6. Evaluation of minimum required dilution for hybridization extraction of mouse plasma & brain homogenate without digestion
Mouse brain homogenate was prepared by bead beating the brain in lysis buffer in a ratio of 1:9 (w/v). 500 ng/ml ASO1 were prepared in plasma or brain homogenate with different minimum required dilutions (MRDs), including MRD1 (100/0 matrix/capture buffer), MRD2 (50/50 matrix/capture buffer), MRD4 (25/75 matrix/capture buffer), MRD8 (12.5/87.5 matrix/capture buffer), MRD∞ (0/100 matrix/capture buffer); 200 μl of the prepared samples with different MRDs were extracted with the hybridization process without the proteinase K digestion step. The recovery was calculated by the ratio of ASO1 in matrix after hybridization extraction and ASO1 post-spiked to hybridization extracted matrix blank.
2.7. Precision & accuracy
Working solutions of ASO1 ranging from 10.0 to 10000 ng/ml were prepared by appropriate dilution of ASO1 stock solutions using ASO diluent. Quality control (QC) working solutions were prepared similarly at the concentrations of 10.0, 30.0, 800 and 7500 ng/ml. All the working solutions were stored at 4°C. Mouse tissue (liver, gastrocnemius) homogenates were prepared by homogenizing individual tissue samples in lysis buffer using a ratio of 1:9 (w/v). Calibration standard (STD) and QC samples were prepared by spiking working solutions into blank mouse liver homogenate to yield STDs with the range of 0.50–500 ng/ml and QCs with lower limit of quantitation (LLOQ) QC at 0.50 ng/ml, low QC at 1.50 ng/ml, mid QC at 40.0 ng/ml, high QC at 375 ng/ml. All calibration standards and QC samples were prepared freshly; 100 μl of STDs and QCs in blank mouse liver homogenate were added to the extraction plate and 100 μl of blank mouse gastrocnemius homogenate was added to each well for matrix matching. ASO1 was extracted based on the described hybridization extraction method.
2.8. Matrix stability of ASO1
Stability QC samples (n = 4) in liver and gastrocnemius at two concentration levels (low QC and high QC) were prepared by spiking QC working solutions to liver and gastrocnemius homogenates. The stability QC samples were stored at room temperature for 6 h, -80°C freezer for 2 weeks and underwent 3 freeze-thaw cycles. The stability QC samples were analyzed against freshly prepared STDs.
3. Results & discussions
3.1. LC-MS/MS method development for ASO1
A Q1 full scan under negative electrospray mode was performed to obtain the mass spectrum of ASO1. As shown in Supplementary Figure S1A, multiple charge states were observed for ASO1. A product ion scan was conducted on the most abundant precursor ion m/z 668.7 to generate the MS/MS spectrum (Supplementary Figure S1B). The most abundant ion m/z 95.0 representing phosphorothioate ion from the ASO backbones was selected as the product ion for ASO1. MRM transitions for three different charge states were selected to monitor the interference of ASO1-linker and Fab–ASO1 to ASO1. MRM transitions and the optimized parameters for ASO1 were summarized in .
3.2. Evaluation of interference of ASO1-linker & Fab–ASO1 to ASO1
As shown in , the ASO was conjugated to the Fab region of an antibody with a linker by covalent bonding. In plasma and tissue study samples, there may be Fab–ASO1 remaining along with ASO1-linker formed in vivo by metabolism or degradation which may cause interference to free ASO1 quantitation, especially if ASO1 and ASO1-linker could not be fully separated by chromatography due to their small m/z difference. The potential interferences of ASO1-linker and Fab–ASO1 to ASO1 were evaluated. Individual ASO1, ASO1-linker and Fab–ASO1 solutions with the same molar concentrations were prepared and were acquired with ASO1 method. The peak area from the MRM transitions of ASO1 were calculated in these three samples. The interferences were calculated by dividing the peak area of ASO1 in ASO1-linker or Fab–ASO1 samples by the peak area in ASO1 samples. Supplementary Table S1 showed that the interferences of ASO1-linker to ASO1 at charge states -9, -8 and -7 were 1.11%, 1.25% and 4.57%, respectively. The interferences of Fab–ASO1 to ASO1 at all the three charge states were less than 0.12%, which was neglectable and may come from the impurity in the Fab–ASO1 standard material. When selecting the MRM transition of ASO1 for quantitation, either m/z 594.4–95.0 (charge state -9) or 668.7–95.0 (charge state -8) can be used to minimize interferences from ASO1-linker; MRM transition m/z 668.7–95.0 was selected since it provided a higher signal-to-noise ratio.
3.3. Evaluation of proteinase K digestion & hybridization extraction on potential degradation of Fab–ASO1 & ASO1-linker
For hybridization extraction of biological samples, especially tissue samples, typically a proteinase K digestion step was applied prior to hybridization extraction to release the ASO from bound proteins and improve assay robustness [Citation21–25]. For AOCs or Fab-ASO conjugates containing peptide bond, the proteinase K digestion may cause the degradation of the conjugates to generate free ASO and/or ASO-linker. The generated free ASO after digestion would cause the overestimation of the free ASO concentration; the generated ASO-linker may also cause interference to the LC-MS/MS analysis of the free ASO. Therefore, to accurately analyze free ASO1 in the presence of Fab–ASO1 or ASO1-linker, it is critical to ensure that there is no significant degradation of Fab–ASO1 or ASO1-linker during the sample preparation process.
The effect of sample preparation (proteinase K digestion and hybridization extraction) on the potential degradation of Fab–ASO1 and ASO1-linker was evaluated by monitoring the changes of ASO1 and ASO1-linker peak intensities in neat solutions treated with different sample preparation procedures. A shows the potential conversion of Fab–ASO1 and ASO1-linker to ASO1 during sample preparation. There was a small amount of ASO1 detected in Fab–ASO1 samples without any treatment which may be due to the impurity in Fab–ASO1 standard material (same reason for ASO1 observed in ASO-1 linker samples without treatment or ASO1-linker observed in untreated Fab–ASO1 samples). No significant increase in ASO1 peak area was observed in Fab–ASO1 samples treated with hybridization only, indicating that the hybridization extraction process would not cause the degradation of Fab–ASO1 to ASO1. For samples treated with proteinase K digestion and hybridization, the peak area increased approximately twofold to 3200 counts. The peak area of ASO1 in equal molar concentration (500 ng/ml, which is equivalent to the molar concentration of Fab–ASO1 tested) of ASO1 sample was around 1500,000 counts. Thus, the conversion of Fab–ASO1 to ASO1 that was caused by the digestion step was minimal (~0.1%). For the potential degradation of ASO1-linker, there was no significant change (difference <15%) in ASO1 peak area in ASO1-linker samples treated with hybridization only or with digestion and hybridization (A).
Figure 2. Effect of proteinase K digestion and hybridization extraction on Fab–ASO1 and ASO1-linker. (A) Peak area of ASO1 in Fab–ASO1 and ASO1-linker with no treatment, hybridization only and proteinase K digestion followed by hybridization; (B) Peak area of ASO1-linker in Fab–ASO1 and ASO1-linker with no treatment, hybridization only and proteinase K digestion followed by hybridization.
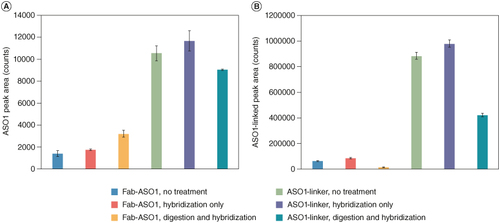
The results of potential conversion from Fab–ASO1 to ASO1-linker during sample preparation were shown in B. As expected, there was no significant increase in ASO1-linker in Fab–ASO1 samples with hybridization extraction only. Interestingly, ASO1-linker decreased significantly (~75%) in Fab–ASO1 samples treated with digestion and a similar trend (50% decrease) was observed in ASO1-linker samples treated with digestion. Based on the results from A, the conversion of ASO1-linker to ASO1 during digestion was minimal (0.1%). Thus, ASO1-linker was digested/degraded by proteinase K mainly to products other than ASO1.
In summary, hybridization extraction did not cause any significant degradation or conversion of Fab–ASO1 to ASO1 or ASO1-linker or ASO1-linker to ASO1. Minimal amount (~0.1%) of conversion from Fab–ASO1 to ASO1 may happen during the proteinase K digestion step. Considering that the concentrations of Fab–ASO1 in study samples may be much higher than ASO1, especially at early timepoints, even the small percentage of conversion may cause significant overestimation of the free ASO1 concentration. For example, if the concentration of Fab–ASO1 in the sample is 100 μg/ml, 0.1% conversion would generate 0.1 μg/ml of ASO1, which is much higher than the 0.50 ng/ml LLOQ of ASO1. In addition, the majority of ASO1-linker was degraded after digestion, introducing downstream degradation products that may cause interference to LC-MS/MS analysis of ASO1. Therefore, for later method development, to avoid any potential interference and ensure the accurate quantitation of ASO1, the digestion step was removed in sample preparation.
3.4. Optimization of extraction method without digestion
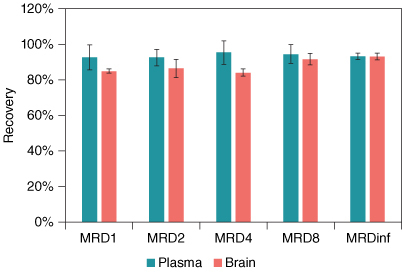
Without the proteinase K digestion step, there may be more interference from the biological matrices and the strong protein binding of ASOs may affect the recovery of ASOs from the matrices. Dilution is a commonly used approach to reduce or minimize the matrix effect. We evaluated if dilution was required to ensure good assay performance. MRDs in mouse plasma and brain homogenate were assessed by comparing the recovery of ASO1 in different diluted matrix using hybridization extraction without the proteinase K digestion step. showed the recovery of ASO1 in plasma and brain homogenate with different MRDs. The recoveries of ASO1 in plasma were more than 90% for all diluted matrices including the one without dilution (MRD1) and the one with no plasma (MRD∞), indicating that the digestion step is not necessary when analyzing plasma samples. For brain homogenate that was already tenfold diluted at the homogenization step by adding ninefold (v/w) of lysis-loading buffer, there was no significant improvement (<10% difference) in recovery with the increase of further dilutions, with the recovery at about 85% for MRD1, MRD2 and MRD4, 92% for MRD8 and 93% for MRD∞. The results demonstrated that the method achieved satisfactory recovery for up to 200 μl of plasma or tissue homogenate (tenfold homogenization with buffer) without further dilution. For other types of tissue samples, e.g., liver and muscle, similar recoveries were achieved and therefore tenfold homogenate was used without further dilutions.
Figure 3. Recovery of ASO1 in mouse plasma and brain homogenate at different MRDs.
3.5. Assay qualification & performance
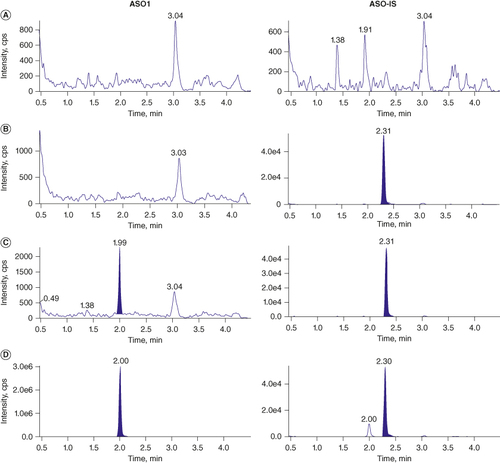
To develop a LC-MS method to quantify the concentration of ASO1 in liver and gastrocnemius, eleven levels of STDs ranging from 0.50 to 500 ng/ml of ASO1 in mouse liver homogenate were prepared in duplicate and matrix matched with the same volume of blank mouse gastrocnemius homogenate. The matrix-matching strategy allowed for the method qualification and sample analysis for two matrices within one assay and thus significantly improved the efficiency. showed the double blank, blank spiked with IS, LLOQ and upper limit of quantitation sample chromatograms of ASO1 and the IS, ASO-IS, in mouse liver and gastrocnemius combine homogenates. No interference at the retention time of ASO1 and ASO-IS was observed in the blank matrices, indicating good specificity of the method. The chromatogram of LLOQ (0.50 ng/ml) sample (C) demonstrated a robust signal against the baseline, with a signal-to-noise ratio greater than 10. The upper limit of quantitation (500 ng/ml) chromatogram showed a strong signal with the same retention time as the LLOQ sample and a good peak shape. A small amount of cross-talk from the ASO1 to ASO-IS (D) was observed during MS analysis. A chromatographic separation between ASO1 and ASO-IS was achieved to avoid the interference of the cross-talk on the quantitation of ASO1.
Figure 4. LC-MS/MS chromatograms of ASO1 and the IS, ASO-IS from (A) double blank, (B) blank spiked with ASO-IS only, (C) LLOQ and (D) ULOQ in mouse liver and gastrocnemius combine homogenate.
IS: Internal standard; LLOQ: Lower limit of quantitation; ULOQ: Upper limit of quantitation.
To establish linearity, a 1/x2-weighted quadratic regression was found to provide the best fit of the standard response versus concentrations. Supplementary Figure S2 shows a representative calibration curve of ASO1. Twenty out of twenty-two STDs were back calculated between 85.2% and 114% of corresponding nominal concentrations, which were within the acceptance criteria of ±15% at the nominal concentrations (±20% at the LLOQ level). The coefficient of determination (R2) of ASO1 was 0.9967 showing consistent fitness of the regression and robust linearity across a 1000-fold assay range.
Precision and accuracy of the method was assessed at four QC levels with six replicates at each level in mouse liver and gastrocnemius combine homogenates. The precision and accuracy data were summarized in . The accuracy of LLOQ QC samples were within 85.6–98.8% of the nominal concentration and the other levels of QCs were within 87.5–112%. The precision of all levels of QC were within 5.2–13.8% CV. All were within the acceptance criteria of 15% CV and accuracy (20% for LLOQ).
Table 3. Precision and accuracy of ASO1 in mouse liver and gastrocnemius combine homogenate.
The stability of ASO1 in liver and gastrocnemius homogenates was assessed at low and high QC levels among four measurement replicates after storage at three conditions including 6 h at room temperature, three freeze-thaw cycles, two weeks at -80°C. The QC samples were quantified by freshly prepared calibration curves. As shown in Supplementary Table S2, the concentrations of ASO1 QCs in liver homogenate showed change of 2.3% and -4.6% from the nominal values and in gastrocnemius homogenate 1.3% and -1.4% from the nominal values: all within the 15% acceptance criteria.
The qualified LC-MS/MS method for ASO1 quantitation was applied to a mouse biodistribution study to confirm the delivery of ASO1 to liver and gastrocnemius after multiple IV injections of Fab–ASO1 at four dose levels. The STDs and QCs were prepared in liver homogenate and matrix matched with blank gastrocnemius homogenate. Liver and gastrocnemius samples were analyzed in one assay with matrix matching: liver samples were matched with blank gastrocnemius homogenate and gastrocnemius samples were matched with blank liver homogenate. The run passed with all the STDs and QCs met the 15% (20% for LLOQ) acceptance criteria, demonstrating the good performance of the method for analyzing tissue samples when applied to a real mouse study.
4. Conclusion
We have developed a hybridization LC-MS/MS methodology to quantify the free ASO1 concentrations in tissues in the presence of Fab–ASO1 and ASO1-linker. The interferences of Fab–ASO1 and ASO1-linker to the free ASO1 during LC-MS/MS analysis were evaluated and have been minimized by selecting the proper mass transition. The proteinase K digestion step could cause a small percentage of conversion of Fab–ASO1 to ASO1 which may result in the overestimation on the free ASO1 concentration. The hybridization extraction method without the proteinase K digestion step was evaluated and achieved satisfactory recovery for plasma or tissue homogenate (tenfold homogenization with buffer). The bioanalytical method for free ASO1 quantitation has been qualified and the qualified method has been applied to mouse studies to measure accurately the free ASO1 concentrations in tissues. The method later has been validated/qualified for the quantitation of ASO1 in serum/tissue samples and used to support GLP safety studies in mice and monkeys. In addition to Fab-ASO conjugates, the methodology has also been applied to other AOCs for the quantitation of free ASOs.
Financial disclosure
The authors have no financial involvement with any organization or entity with a financial interest in or financial conflict with the subject matter or materials discussed in the manuscript. This includes employment, consultancies, honoraria, stock ownership or options, expert testimony, grants or patents received or pending or royalties.
Writing disclosure
No writing assistance was utilized in the production of this manuscript.
Supplementary Materials
Download MS Word (280.7 KB)Acknowledgments
The authors thank Patrick Trapa for his helpful review of the manuscript.
Supplemental material
Supplemental data for this article can be accessed at https://doi.org/10.1080/17576180.2024.2368339
Competing interests disclosure
The authors have no competing interests or relevant affiliations with any organization or entity with the subject matter or materials discussed in the manuscript. This includes employment, consultancies, stock ownership or options and expert testimony.
References
- Rinaldi C, Wood MJA. Antisense oligonucleotides: the next frontier for treatment of neurological disorders. Nat Rev Neurol. 2018;14(1):9–21. doi:10.1038/nrneurol.2017.148
- Dhuri K, Bechtold C, Quijano E, et al. Antisense oligonucleotides: an emerging area in drug discovery and development. J Clin Med. 2020;9(6):2004. doi:10.3390/jcm9062004
- Moumné L, Marie A-C, Crouvezier N. Oligonucleotide therapeutics: from discovery and development to pPatentability. Pharmaceutics. 2022;14(2):260. doi:10.3390/pharmaceutics14020260
- Crooke ST, Baker BF, Crooke RM, et al. Antisense technology: an overview and prospectus. Nat Rev Drug Discov. 2021;20(6):427–453. doi:10.1038/s41573-021-00162-z
- Krychtiuk KA, Rader DJ, Granger CB. RNA-targeted therapeutics in cardiovascular disease: the time is now. Eur Heart J Cardiovasc Pharmacother. 2022;9(1):94–99. doi:10.1093/ehjcvp/pvac052
- Leavitt BR, Tabrizi SJ. Antisense oligonucleotides for neurodegeneration. Science. 2020;367(6485):1428–1429. doi:10.1126/science.aba4624
- Aoki Y, Wood MJA. Emerging oligonucleotide therapeutics for rare neuromuscular diseases. J Neuromuscul Dis. 2021;8:869–884. doi:10.3233/JND-200560
- Reilley MJ, McCoon P, Cook C, et al. STAT3 antisense oligonucleotide AZD9150 in a subset of patients with heavily pretreated lymphoma: results of a phase 1b trial. J Immunother Cancer. 2018;6(1):119. doi:10.1186/s40425-018-0436-5
- Roberts TC, Langer R, Wood MJA. Advances in oligonucleotide drug delivery. Nat Rev Drug Discov. 2020;19(10):673–694. doi:10.1038/s41573-020-0075-7
- Dovgan I, Koniev O, Kolodych S, et al. Antibody-oligonucleotide conjugates as therapeutic, imaging and detection agents. Bioconjugate Chem. 2019;30(10):2483–2501. doi:10.1021/acs.bioconjchem.9b00306
- Malecova B, Burke RS, Cochran M, et al. Targeted tissue delivery of RNA therapeutics using antibody-oligonucleotide conjugates (AOCs). Nucleic Acids Res. 2023;51(12):5901–5910. doi:10.1093/nar/gkad415
- Gait MJ, Arzumanov AA, McClorey G, et al. Cell-penetrating peptide conjugates of steric blocking oligonucleotides as therapeutics for neuromuscular diseases from a historical perspective to current prospects of treatment. Nucleic Acid Ther. 2019;29(1):1–12. doi:10.1089/nat.2018.0747
- Barker SJ, Thayer MB, Kim C, et al. Targeting transferrin receptor to transport antisense oligonucleotides across the blood-brain barrier. bioRxiv. 2023. doi:10.1101/2023.04.25.538145
- Kuo C, Nikan M, Yeh ST, et al. Targeted delivery of antisense oligonucleotides through angiotensin type 1 receptor. Nucleic Acid Ther. 2022;32(4):300–311. doi:10.1089/nat.2021.0105
- Norris DA, Post N, Yu RZ, et al. Bioanalysis considerations on the pharmacokinetic evaluation of antisense therapeutics. Bioanalysis. 2019;11(21):1909–1912. doi:10.4155/bio-2019-0194
- Shin M, Krishnamurthy PM, Devi G, Watts JK. Quantification of antisense oligonucleotides by splint ligation and quantitative polymerase chain reaction. Nucleic Acid Ther. 2022;32(1):66–73. doi:10.1089/nat.2021.0040
- Ji Y, Liu Y, Xia W, et al. Importance of probe design for bioanalysis of oligonucleotides using hybridization-based LC-fluorescence assays. Bioanalysis. 2019;11(21):1917–1925. doi:10.4155/bio-2019-0154
- Wang L, Ji C. Advances in quantitative bioanalysis of oligonucleotide biomarkers and therapeutics. Bioanalysis. 2016;8(2):143–155. doi:10.4155/bio.15.234
- van Dongen WD, Niessen WM. Bioanalytical LC-MS of therapeutic oligonucleotides. Bioanalysis. 2011;3(5):541–564. doi:10.4155/bio.11.8
- Kaczmarkiewicz A, Nuckowski Ł, Studzińska S, et al. Analysis of antisense oligonucleotides and their metabolites with the use of ion pair reversed-phase liquid chromatography coupled with mass spectrometry. Crit Rev Anal Chem. 2019;49(3):256–270. doi:10.1080/10408347.2018.1517034
- Li P, Gong Y, Kim J, et al. Hybridization liquid chromatography-tandem mass spectrometry: an alternative bioanalytical method for antisense oligonucleotide quantitation in plasma and tissue samples. Anal Chem. 2020;92(15):10548–10559. doi:10.1021/acs.analchem.0c01382
- Li P, Dupuis J-F, Vrionis V, et al. Validation and application of hybridization liquid chromatography-tandem mass spectrometry methods for quantitative bioanalysis of antisense oligonucleotides. Bioanalysis. 2022;14(9):589–601. doi:10.4155/bio-2022-0015
- Guimaraes G, Yuan L, Li P. Antisense oligonucleotide in vitro protein binding determination in plasma, brain and cerebral spinal fluid using hybridization LC-MS/MS. Drug Metab Dispos. 2022;50(3):268–276. doi:10.1124/dmd.121.000751
- Yuan L, Dupuis J-F, Vrionis V, et al. A validated capillary microsampling liquid chromatography-tandem mass spectrometry method for quantification of antisense oligonucleotides in mouse serum. Bioanalysis. 2023;15(12):683–694. doi:10.4155/bio-2023-0096
- Jiang D, Yuan L. Microflow LC-MS/MS to improve sensitivity for antisense oligonucleotides bioanalysis: critical role of sample cleanness. Bioanalysis. 2022;14(21):1365–1376. doi:10.4155/bio-2022-0201
- Yuan L, Dupuis J-F, Mekhssian K. A novel hybridization LC-MS/MS methodology for quantification of siRNA in plasma, CSF and tissue samples. Molecules. 2023;28(4):1618. doi:10.3390/molecules28041618
- Dillen L, Sips L, Greway T, et al. Quantitative analysis of imetelstat in plasma with LC-MS/MS using solid-phase or hybridization extraction. Bioanalysis. 2017;9(23):1859–1872. doi:10.4155/bio-2017-0145
- Sips L, Ediage EN, Ingelse B, et al. LC-MS quantification of oligonucleotides in biological matrices with SPE or hybridization extraction. Bioanalysis. 2019;11(21):1941–1954. doi:10.4155/bio-2019-0117