
 ?Mathematical formulae have been encoded as MathML and are displayed in this HTML version using MathJax in order to improve their display. Uncheck the box to turn MathJax off. This feature requires Javascript. Click on a formula to zoom.
Abstract
Wildfires have been an important process affecting forests and rangelands worldwide. In the Mediterranean region, wildfires burn about half a million hectares of forest and scrubland every year. Fuel loads are the main factor controlling fire risk and its propagation. The reduction of fuel loads by grazing could help to decrease the spread and intensity of wildfires in this region. This study aims to assess the contribution of sheep grazing on fuel load management and their role to the mitigation of wildfire greenhouse gas (GHG) emissions. The methodological approach is based on a simulation of the grazing pressure required to reduce a given quantity of fuel, under the assumption that if it is not consumed, it becomes fuel. Following, a simulation model was designed to estimate the total GHG emissions prevented through grazing, by reducing the risk of fire. These emissions were estimated based on the Intergovernmental Panel on Climate Change (IPCC) framework. The accumulated fuels were estimated to be 3126.65 kg dry matter (DM) ha−1 and the biomass potentially consumed by sheep was 1416.03 kg DM ha−1 yr−1, corresponding to 45.29% of accumulated fuel loads. Our findings suggest a value of 3.88 sheep ha−1 day−1 as the ideal to reduce 4833.63 kg CO2eq ha−1 yr−1 of emissions, distributed between CO2 (−2221.76 kg CO2eq ha−1 yr−1; 45.96%), NOx (−1873.41 kg CO2eq ha−1 yr−1; 38.76%), CO (−454.55 kg CO2eq ha−1 yr−1; 9.40%), CH4 (−186.35 kg CO2eq ha−1 yr−1; 3.86%) and N2O (−97.56 kg CO2eq ha−1 yr−1; 2%). The results of this study also underline that livestock can help to mitigate climate change in areas prone to wildfires.
Introduction
Wildfires are a common disturbance in forests and rangelands around the world: every year, they cause significant economic and environmental losses and contribute to global warming [Citation1,Citation2]. Currently, the occurrence of forest wildfires around the world is over 200,000 per year, with burned areas of 3.5–4.5 million km2 [Citation3]. In Europe, approximately 65,000 fires occur each year, and about 80% of the total burnt area is in the Mediterranean region [Citation4]. Around half a million hectares are currently burnt every year in five southern European Union member states (Portugal, Spain, Greece, Italy, and France), where 20% of the burnt area is in Portugal and Spain [Citation5–7].
In the Mediterranean region, climate change (rising temperatures, decreasing rainfall) has been identified as a significant factor that increases the risk of wildfires [Citation1,Citation8,Citation9]. Camia and Amatulli [Citation8] and Parente et al. [Citation5] point out that burnt area and summer drought are strongly correlated. Over the next 100 years, temperatures may rise by about 4–5 °C with up to a 50% decrease in rainfall throughout southern Europe [Citation10]. Consequently, more extended hot periods and droughts are expected, thus increasing wildfire frequency and severity [Citation1,Citation10]. The European Environment Agency (EEA) projections for 2100 predict that the fire danger will increase in European countries, where the highest absolute danger will remain in Spain and Portugal [Citation11]. Fire occurrence and area burnt are projected to increase in Portugal by 478% by 2100 [Citation12]. Thus, Mediterranean ecosystems could experience loss of biodiversity and soil erosion, as well as becoming a significant contributor to greenhouse gas (GHG) emissions and aerosols [Citation7,Citation13]. In Portugal, during 2003, 2005, and 2017, CO2, CO, CH4, N2O, and NOx emissions from wildfires exceeded 2 Mt, 0.45 Mt, 0.02Mt, 0.001 Mt, and 0.012 Mt, respectively [Citation14].
In the Mediterranean mountains, mainly in the Iberian Peninsula, the leading causes of wildfires are depopulation of the countryside, farm abandonment, and the reduction in grazing areas since the mid-twentieth century [Citation15,Citation16]. As a result, large areas of woody biomass have become established [Citation15,Citation17], promoting the accumulation of combustibles, which is correlated with the spread of wildfires [Citation7,Citation18]. Portugal, in particular, needs to improve many aspects of firefighting, among which is the need for a structural defence system of fire breaks and the reduction of the fuel loads in critical areas [Citation19,Citation20].
The interaction of fires and grazing has shaped grassland and savannah landscapes around the world since the beginning of time [Citation21]. Grazing is a tool to manage herbaceous and woody fuels [Citation22–24], and to maintain and restore heterogeneity of landscapes [Citation25]. The accumulated amount of dry fire fuel, both from leaf fall and the annual production of herbaceous material, is the main factor determining the flammability index and the propagation of fire [Citation26–28]. Grazing can significantly reduce the potential fire intensity by decreasing the accumulated fuel loads and disrupting the horizontal and vertical continuity of the fuel complex [Citation15,Citation23,Citation29].
Several studies have pointed out the importance of livestock grazing in the management of fuel in forest and woodlands (e.g. Australia, the Amazon Forest, Southern Hemisphere Africa, Temperate North America) [Citation30–35]. In the semi-arid and arid ecosystems of some areas of the USA, moderate livestock grazing decreases the risk of wildfires [Citation31,Citation33]. Also, winter grazing reduces fire fuels and increases fire fuel moisture, which reduces flame height and depth, rate of spread, and area burnt [Citation32]. Similarly, in southern European countries, Lasanta et al. [Citation15] found that the combustible material and the occurrence of fires decreases with the influence of extensive grazing. The advantages of grazing are not only that it reduces fuels from the landscape but also that it changes wildfire behaviour by creating empty patches and/or patches with reduced combustibles, thereby decreasing wildfire intensity and propagation [Citation21,Citation29].
The grazing pressure (GP), on average, in the northeast region of Portugal is about 0.25 sheep ha−1 (Castro et al. [Citation20]). In an effort to reverse these low values, currently, the Portuguese forest administration has been subsidizing farmers to increase the number of herds in fire-sensitive areas as a preventive method of fuel management [Citation36]. The minimum GP recommended is 1.4 sheep or goats per hectare; however, this suggested value is empirical, there is no accurate information about the optimal GP that should be applied to be effective. Ensuring the animal sustained health and production of the grassland resources need of establishing optimal stocking rates which depend on the management objective and is still a big challenge for managers. A high stocking rate can be determinant on plant composition, forage production, erosion, and livestock production [Citation2,Citation37–39]. Consequently, a proper stocking rate should balance plant productivity and animal requirements [Citation40]. The positive effect of reduction of combustible biomass by livestock consumption seems to be especially important as a mitigation strategy for many regions of the world where fires have been emerging as a problem. In this paper, our main objective was to predict the potential to avoid GHG emissions, from wildfires, by increasing grazing pressure in a Mediterranean forest of the northeast of Portugal, using a simulation model based on the IPCC framework. For this purpose, the simulation model estimated, 1) the potential biomass consumed by sheep and the total accumulated fuels in the study area, 2) the optimal grazing pressure understood as the maximum number of animals that a Mediterranean forest can support on a sustainable basis, and 3) the total avoidable GHG emissions (CO2, CO, CH4, N2O, and NOx) caused by wildfires, through increased GP.
Material and methods
Study area
The study was conducted in Romeu parish, a site of community interest (SIC PT CON0043) located in the Trás-os-Montes region, northeast Portugal (41°32′N, 7°02′W), at 500 m MSL. The climate is Mediterranean, the mean annual temperature is 14.2 °C, and the total rainfall is 520 mm, which occurs mainly from October until May [Citation14,Citation41]. The landscape is dominated by an open Mediterranean forest with Portuguese oak (Quercus faginea Lam.), cork oak (Quercus suber L.) and holm oak (Quercus rotundifolia Lam.) and several shrub species such as Cytisus scoparius L., Cytisus multiflorus L’Hér, Lavandula stoechas L., Crataegus monogyna Jacq., Cistus ladanifer L., with an herbaceous stratum, generally dominated by annual grasses.
Vegetation measurements
To estimate the total accumulated biomass (fuel loads present above ground), and the available biomass for animal consumption, several measures were made per vegetation type (herbaceous stratum and shrub species). The vegetation data were collected during the autumn of 2018. In the case of shrub biomass assessment, the total biomass and the current annual growth were predicted, as well as the biovolume of each shrub species. Additionally, the density of each shrub species was estimated to allow the extrapolation of biomass per hectare ().
Table 1. Approach used to estimate total fuels and potentially consumable biomass.
Herbaceous biomass estimation
The herbaceous biomass Bh was determined by cutting and weighing in sample units, using a destructive method with double sampling in 5 plots of 2000 m2 (supplementary material S1) [Citation43]. For each plot in the study area, five squares of an area of 0.25 m2 were randomly established (25 quadrats in total), where the herbaceous vegetation was cut at ground level. All the samples were dried at 65 °C for 48 h. Considering previous studies on foraging of sheep and goats in oak woodlands [Citation22,Citation37,Citation44], the herbaceous biomass consumable by sheep (Bhc) it was assumed to be at most 75% of Bh in these conditions (EquationEq. 1(11)
(11) ).
Shrub biomass estimation
Shrub biomass per species
The estimation of the shrub biomass included all species with a cover higher than 10%, namely C. scoparius, C. multiflorus, C. monogyna, Prunus spinosa L., C. ladanifer, L. stoechas and Quercus spp. seedlings, and each of them was indexed (j), from 1 to 7, respectively. The individual shrub biomass (bs(j)) of each shrub’s species, the current annual growth (bag(j)) (potentially consumable fraction by herbivores), the fraction of previous growth (bpg(j)), and the ratio between annual growth and total shrub biomass (fag(j)) (Eq. 2), were estimated by the branch unit method [Citation45,Citation46]. The method consists of choosing representative branches of the global structure of the shrub (a branch unit) and counting the number of branches. Five repetitions per species were collected. For each branch, the fraction of annual and previous growth was separated. All the samples were dried by the same process described for herbaceous biomass. Additionally, measurements were taken to estimate the volume of each shrub sampled (5 repetitions per shrub species). Therefore, for each sample, the canopy frequent height (Hf(j)) and diameter (dj) (using the average between the longest diameter and its perpendicular) were assessed, in order to estimate the volume of each shrub per species j (vj) (Eq. 3).
Adjusted shrub biomass per species
Regarding the large variability observed on bs(j) using a simple random sampling with 5 observations (supplementary material, S2), the ratio and regression estimators’ method was adapted to reduce the variance and improve the estimation of the population mean, getting adjust individual biomass average values (bs(j)’) per shrub species [Citation47,Citation48]. The ratio and regression estimators’ method is an adjustment technique of a studied variable (y: bs(j)), generally difficult to obtain, by using an auxiliary variable (x: vj) which is usually easy to measure (supplementary material, S3). Also, a regression analysis was performed to establish the relationship between the variable of shrub biomass (y: bs(j)) and their volume (x: vj) as a predictor. From 20 field samples, we estimated the mean population volume per species (supplementary material; S2) and coefficient of determination (R2), and tested the effect of biovolume on biomass. R2 was used to calculate the gains in accuracy as a ratio between the variance estimated by the regression estimator method and that estimated by simple and random sampling (supplementary material; S3). In addition, regression conditions were verified, i.e. the normality of the residues, randomly and equally distributed around zero (homoscedasticity).
Shrub biomass per hectare
The density of each shrub species (Dj) (was estimated by the nearest-neighbour method [Citation49], using five repetitions (Eq. 5). This method is a plotless sampling in which the distance is measured from a sample point to the closest individual (the nearest to the random sampling point). The shrub biomass per species per hectare (Bs(j)) was estimated by the product of density (Dj) by the adjusted biomass mean per species through regression estimators’ method (bs(j)’) (Eq. 6) (previous section).
Potentially consumable biomass
Assuming that animals consume only the annual growth of shrubs, the potential consumable biomass per hectare per shrub species j results from the product of (Bs(j)) and fag(j) (Eq. 7). As the potentially consumable biomass by shrub (Bsc(j)) depends on the height of the plant (Hf(j)), an accessibility index (Ia(j)) per species was estimated, considering that the animal has total accessibility up to 1 m in height (Eq. 8). Note however that the (Ia(j)=100%) if Hf(j)=1m. Therefore, the potentially consumable biomass by sheep, which includes both herbaceous and shrub species (Bc; kg DM ha−1) was estimated by the Eq. (9). Also, the combustible biomass (Bt; kg DM ha−1) corresponding to the total of both herbaceous and shrub biomass per hectare was calculated using Eq. (10) ().
Simulation model of GHG avoided
To model the effect of biomass consumption on the reduction of emissions from fires, it is assumed that the fraction of biomass consumed by the sheep does not burn. Therefore, there is an amount of GHG that is not released into the atmosphere. To estimate the GHG emissions avoided (CO2, CO, CH4, N2O, and NOx) from the non-occurrence of wildfires through simulations of the consumption possibilities of given grazing pressure, the biomass consumption in the different interactions was estimated, as well as the amount of GHG produced per unit of organic matter burnt.
The potentially consumable biomass (Bc(i)) of a given grazing pressure GP(i) was estimated using EquationEq. (11)(11)
(11) , where i indicates the number of each iteration. It was assumed a biomass consumption rate (U) of 1 kg DM day−1 per sheep of 45 kg live weight [Citation50]. Considering the average of regional heads of flocks, we started the simulation model (for i = 1) using a grazing pressure of 50 sheep ha−1 yr−1 (corresponding to 0.137 sheep ha−1 day−1).
(11)
(11)
For the next iteration (i + 1), the grazing pressure was increased by a step of (50×i) sheep ha−1 yr−1, ending the simulation when the maximum biomass available for consumption by sheep (Bc) was reached. In this interactive process, groups of 50 ewes are successively applied until reaching the optimum pressure which corresponds to the total biomass potentially consumable. The optimal daily GP found in the last iteration n is estimated using EquationEq. (12)(12)
(12) .
(12)
(12)
As a second step, it was considered that if the biomass was consumed it would not be burnt, and the total GHG emissions (Ea(i)) avoided by grazing in this case were estimated for each iteration i, using EquationEq. (13)(13)
(13) from the IPCC guidelines [Citation51]. Also, the total emissions (Etotal), in a no-grazing scenario, were estimated, using a similar expression (EquationEq. 13
(13)
(13) ), substituting Bc(i) by Bt (EquationEq. 14
(14)
(14) ). Both Ea(i) and Etotal outputs allow us to quantify the no mitigated emissions En(i) as the difference between the outputs using EquationEq. 15
(15)
(15) . Additionally, Etotal, Ea(i) and En(i) were quantified in kg of CO2 equivalent (kg CO2eq ha−1 yr−1), using the Global Warming Potential value (GWP; 100-year horizon) from the literature and the fifth IPCC report (). The regression functions between each mitigated GHG and grazing pressure were created, using the final outputs (For more detail see the supplementary material: simulation model.xlsx).
(13)
(13)
(14)
(14)
(15)
(15)
where the BA (ha) is the area burned (equal 1 ha), Cf is the combustion factor (dimensionless), equivalent to 1 according to the IPCC, and Gef (g kg−1) is the burnt dry matter (DM) emission factor (). The negative sign (-) in EquationEq. 13
(13)
(13) reflects a reduction in GHG emissions into the atmosphere.
Table 2. The burnt dry matter (DM) emission factor ( g kg−1) and the global warming potential (GWP; 100-year horizon).
Results
Total fuels and biomass potentially consumable
shows the regression models for each shrub (j) between individual shrubs biomass bs(j) and volume (vj). The correlation between the predictor vj and response bs(j) variables varies between 0.84 and 0.94, which represent the fraction of the variance explained by the model (p < 0.05). The values found for adjusted shrub biomass mean (bs(j)’) were 1470.30 g DM for C. ladanifer, 1039.10 g DM for Quercus spp. seedlings, 968.01 g DM for P. spinosa, 579.82 g DM for C. scoparius, 475.80 g DM for C. multiflorus, 286.67 g DM for L. stoechas, and 260.30 g DM for C. monogyna. The regression estimator improved the confidence intervals of (bs(j)’) and its accuracy, mainly for C. multiforus (20%), C. scoparius (16.67%), L. stoechas (16.23%), and Quercus spp. seedlings (11.88%).
Table 3. Regression models between individual shrubs biomass (bs(j); g DM plant−1) and volume (vj; m3). The adjusted individual shrub biomass averages (bs(j)’; g DM plant−1) using regression estimator method (S3), with their standard error (SE) and the gain in accuracy (AG; %).
shows the potentially consumable biomass per vegetation type and the total of fuel loads, as well as the parameters used to estimate these variables. The annual growth fraction varies from 12% for C. monogyna to 46% for L. stoechas. The density of the shrubs is highest in the case of C. multiforus (1464.20 plants ha−1), followed by C. scoparius (707.92 plants ha−1), L. stoechas (518.51 plants ha−1), and Quercus spp. seedlings (465.59 plants ha−1), and lowest in the case of P. spinosa (140.33 plants ha−1) and C. monogyna (36.05 plants ha−1). The L. stoechas and Quercus spp. seedlings are fully accessible for animal consumption, while the least accessible are P. spinosa (55%), C. monogyna (61%), and C. ladanifer (62%).
Table 4. Estimated parameters per vegetation types: dry matter (DM; %), annual growth fraction (fag(j); %), density of each species (Dj; plants ha−1), accessibility index (Ia(j); %). Total fuels (Bt; kg DM ha−1) and the potentially consumable biomass (Bc(j)) in kg DM ha−1.
The value of biomass combustible presented in the study area (Bt) was 3126.65 kg DM ha−1, composed of 1103.82 kg DM ha−1 of herbaceous species and 2022.83 kg DM ha−1 of shrubs (). The herbaceous present 35.3% of the fuels, followed by C. multiflorus (22.3%), Quercus spp. seedlings (15.5%), C. scoparius (13.1%), C. ladanifer (6.6%), L. stoechas (4.8%), C. monogyna (1.3%), and P. spinosa (1.1%). The potentially consumable biomass (Bc) was 1416.03 kg DM ha−1 and represents only 45.29% of the fuels. It was composed of 58.46% of herbaceous species and 41.54% of shrubs disturbed as follow: 13.38% of C. multiflorus, 9.57% of C. scoparius, 9.57% of Quercus spp. seedlings, 4.83% of L. stoechas, 3.70% of C. ladanifer, 0.4 for both P. spinosa, and C. monogyna.
Grazing pressure and GHG emissions
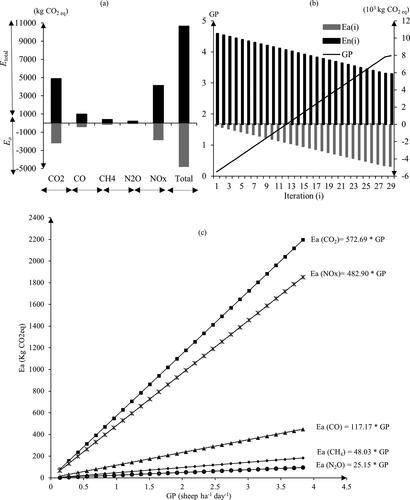
The total expected emissions from all the fuels (Etotal) under no-grazing scenario is about 10,672.81 kg CO2eq ha−1 yr−1 (), distributed between CO2 (4905.71 kg CO2eq ha−1 yr−1) CO (1003.65 kg CO2eq ha−1 yr−1), CH4 (411.47 kg CO2eq ha−1 yr−1), N2O (215.43 kg CO2eq ha−1), and NOx (4136.55 kg CO2eq ha−1 yr−1. In the first interaction (i = 1), 0.137 sheep ha−1 day−1 was used as GP, it was consumed 50 Kg DM ha−1 yr−1, which provides an opportunity to avoid 170.68 kg CO2eq ha−1 yr−1 (). However, 10,502.13 CO2eq ha−1 yr−1 will be emitted in case of fire (). There is a positive and linear relationship (y=ax) between grazing pressure and reduction in GHG emissions (Ea) (R2) (). These regression models per GHG type reflect that one sheep ha−1 day−1 could reduce 1245.93 kg CO2eq GHG emissions from wildfires. For instance, the 1.4 sheep ha−1 day−1, might contributes to mitigate 801.76 kg CO2eq ha−1 yr−1 of CO2, 676.06 kg CO2eq ha−1 yr−1 of NOx, 164.04 kg CO2eq ha−1 yr−1 of CO, 67.24 kg CO2eq ha−1 yr−1 of CH4, and 35.21 kg CO2eq ha−1 yr−1of NO2 and around 8928.5 kg CO2eq ha−1 yr−1 are unmitigated (). According to the model design (section 2.3), the last iteration (29) as described in the section 2.3, provides 3.88 sheep ha−1 day−1 as the optimal GP for the consumable biomass available (1416.03 kg DM ha−1 yr−1) (). also illustrates the total GHG emissions prevented (Ea) using that GP. The grazing pressure of 3.88 sheep ha−1 day−1 is able to mitigate 4833.63 kg CO2eq ha−1 yr−1, broken down into CO2 (−2221.76 kg CO2eq; 45.96%), NOx (−1873.41 kg CO2eq; 38.76%), CO (−454.55 kg CO2eq; 9.40%), CH4 (−186.35 kg CO2eq; 3.86%) and N2O (−97.56 kg CO2eq; 2.02%).
Figure 1. (a) the total mitigated emissions (Ea; kg CO2eq ha−1 yr−1) using the optimal GP (3.88 sheep ha−1 day−1), corresponding to the last simulation (n) and the total emissions from all fuels (Etotal; kg CO2eq ha−1 yr−1), b) GP interaction with the mitigated (Ea(i)) and no mitigated (En(i); kg CO2eq ha−1 yr−1) GHG emissions from accumulated fuel in the study area, c) Linear functions of mitigated GHG emissions (Ea) through grazing in northeast Portugal.
Discussion
Herbaceous and shrub biomass
The values found for total shrub biomass (2022.83 kg DM ha−1) were consistent with those found by other authors (2190–4600 kg DM ha−1) for similar Oak Mediterranean ecosystems [Citation54–57], even though its variation is great depending on ecological conditions, tree density, disturbances, etc.
The fraction of annual growth of shrubs ranging from 16% to 46%, higher than those reported by Navarro et al. [Citation58], which can be explained by lower densities and more favourable edaphic conditions. Allometric biomass equations developed specifically for shrubs are relatively limited in the literature. In this study, the regression and ratio estimator to improve the estimations of shrubs biomass was applied. Our study proposed equations to estimate shrub's individual biomass before scaling up to stand level per unit of area, with good accuracy (R2 above 0.9, p < 0.05) using biovolume as an explanatory variable, compared to other models for similar species [Citation58–60].
The values of herbaceous biomass in Mediterranean conditions ranges from 500 kg DM ha−1 to about 5000 kg DM ha−1 across the growing season in different types of grasslands [Citation61]. In this study, the value of herbaceous biomass was 1103.82 kg DM ha−1, in line with those stated by Castro and Freitas [Citation62] in forest ecosystems.
Therefore, the biomass consumable in the oak forest ecosystem depends on (i) the annual productivity of herbaceous and shrub species, (ii) the extent of shrubby vegetation, (iii) the proportion of the annual dry matter production that constitutes useable browsing materials, and (iv) the fraction that could be ingested by the animals [Citation63].
Fuel loads management
Several studies point out the role of the accumulated fuel loads on the increasing fire frequency and severity [Citation15,Citation17,Citation18,Citation27]. Our results suggest that livestock can reduce fuel accumulation, contributing to the reduction of fire risk, since the grazing pressure of 3.88 sheep ha−1 day−1 can reduce the accumulated fuel loads in the study area by about 45.29%. In south-eastern Spain, Ruiz-Mirazo and Robles [Citation64] found that livestock consumed between 33 and 68% of vegetation biomass, depending on the weather conditions of the year. Indeed, this fuel break capacity depends on the ecosystem's productivity, linked to annual rainfall. Ruiz-Mirazo and Robles [Citation64] reported that livestock could reduce biomass by 625 kg DM ha−1 with a rainfall of 171 mm and 1250 kg DM ha−1 with precipitation of 294 mm. In our case, with 520 mm of annual rainfall, the sheep consume 1416.03 kg DM ha−1, which represents 45.29% of the fuels in the area, i.e. fuels cannot be removed entirely by grazing. These results are in line with those found by other authors [Citation24,Citation65]; (Fonseca et al. ) [Citation65] point out that grazing is a complementary fuel management process that needs to be supplemented with other interventions, such as prescribed burning and mechanical treatment). The range of values found for annual growth fraction (Fag(j); %), density of each species (Dj; plants ha−1), dry matter (%) per shrubs species could serve as a reference point for land managers to have an idea of the fuel load here used as a baseline to obtain the model.
Nearly half of the Earth’s land surface is prone to wildfire due to its vegetal cover (forest and grasslands) so many researchers have become interested in the use of grazing as a means of fuel management in these regions. For instance, in Australia, Liedloff et al. [Citation30] found that increases in the level of stocking rate reduce the biomass in both woodland and grassland savannas. In Africa, Johansson and Granström [Citation66] report that fire and cattle interact to maintain a relatively stable system in highlands, where fuel limitation in the early stages of succession creates firebreaks that prevent landscape‐wide wildfires. Also, in Temperate North America, Davis et al. [Citation32] have highlighted the potential of grazing to be used as a fuel control treatment to reduce the size of wildfires, increasing the likelihood of effective suppression, and decreasing fire intensity in some Artemisia steppe communities. Fuel reduction by grazing alters fire behaviour by reducing fire severity, probability of ignition and fire spread, Davis et al. [Citation32,Citation33] pointed out that winter grazing decreased the area burned after the initial fires by more than 50%, in the temperate region of North America. In addition, grazing also forms patches of lawns that act as barriers to wildfire spread [Citation21, Citation27,Citation37].
In Portugal, grazing pressure is generally lower in sensitive areas to wildfires, and it depends on land cover and land use. Portugal's fuel load management programme requires at least 1.4 sheep or goats per hectare [Citation36]. In a study carried out in the northeast of Portugal, in a close to our study area, Castro et al. [Citation20] reported an grazing pressure available of 1.84 sheep ha−1 in permanent crops, 1.73 in annual crops, 1.25 in grassland, 0.88 in grazed forest, and 0.84 in shrublands. These values are much lower than the ones found in this work (3.88 sheep ha−1 day−1), even though in the present model it has determined the optimum pressure to remove all the combustible load (biomass consumable is about 45.29% of fuel loads presented in the area) that could be consumed by the animals. Other authors stated lower values, for instance in southern France, Etienne et al. [Citation67] proposed a pressure of 0.6 and 1.4 sheep ha−1 in open areas, and up to 1.65 for forest ecosystems. In Spain, Evlagon et al. [Citation63] reported 1.25–2.01 goat's ha−1 in woody vegetation, and 0.98–1.40 goat’s ha−1 in grassland vegetation. Even if the productivity of ecosystems affects the fuel loads, and consequently the appropriate grazing charge, it should be reported, that the values found by these authors predict a continuum of grazing, while the present model simulates the optimal grazing pressure for an existing fuel accumulation, this is a more instantaneous approach. Mosley and Roselle [Citation68] point out that grazing needs to be appropriately timed, namely, at the early boot stage, and must be repeated a few weeks later to control the understory vegetation regrowth.
In the other hand, sometimes grazing is pointed out as a cause of ecosystem degradation, especially in arid areas and in ones where grazing pressure is very high [Citation69,Citation70]. In these conditions, grazing increases the bare soil, reducing the percentage of vegetation cover, thus triggering soil erosion, especially in the arid ecosystems of northern Africa where biomass growth is already very low [Citation69]. Therefore, the optimal grazing pressure varies with the type of ecosystem, the environmental conditions where it is found, and the objectives for which it is used, i.e. it always depends on the desired amount of fuel to be removed. In addition to grazing contribution to offset wildfires emissions and reduce fuels, it may also affect soil organic carbon (SOC) storage. The impact of grazing on SOC is not only climate-dependent, but also on other site characteristics (soil properties), and belowground allocation [Citation71]. From a worldwide study conducted by Abdalla et al. [Citation72] reported that grazing intensification may increase SOC stocks under the moist warm climate (+7.6%) whilst there were reductions under the moist cool climate (−19%).
Several studies have shown that prescribed burning is useful in fuel management [Citation7,Citation73,Citation74]. Regarding GHG emissions, it is possible to significantly reduce CO2 emissions through prescribed burning in regions prone to fire. From a large-scale study of all European countries, Narayan et al. [Citation7] estimated that approximately 11 million tonnes of CO2 were released annually from wildfires, which could have been avoided by almost 50% if prescribed burning had been used. However, compared to our study, which was conducted on a plot scale, if prescribed burning were used instead of grazing, the total emissions would be around 10,672.81 kg CO2eq ha−1 (total fuels GHG emissions) from understory vegetation. However, by using grazing treatment before burning, those emissions could be reduced by 45.29%.
Climate change and livestock balance
The contribution to climate change by livestock farms around the world is unquestioned since ruminants emit a significant amount of GHG from enteric fermentation [Citation75,Citation76]. According to the IPCC [Citation51], one sheep might emit 8 kg CH4 yr−1 (224 kg CO2eq yr−1) from the digestive process; our results showed that one sheep might reduce emission by only 1.72 kg CH4 yr−1 by controlling wildfires (48.03 kg CO2eq yr−1, slope coefficient ). Therefore, grazing intensification would lead to higher CH4 emissions than their mitigation by reducing those wildfires. However, grazing livestock animals contribute to the positive balance of GHG emissions, since they prevent the release of 1197.91 kg of CO2eq yr−1 sheep−1 shared between 572.69, 482.9, 117.17, and 25.15 kg of CO2eq yr−1 sheep−1, of CO2, NOx, CO, and N2O, respectively, thereby offsetting the CH4 of enteric fermentation. In 2003 and 2005, during the catastrophic wildfires in Portugal, 289,084 ha of grasslands and shrublands were burnt, emitting more than 94,046.36 t CO2eq into the atmosphere [Citation14], requiring 75.5 × 10³ sheep to maintain the CO2 in the ecosystem.
Study limitations and model improvements
Statistically it would have been preferable to use a sampling frame with a smaller area per plot and a larger number of plots, which would have reduced the variance of the measured variables, mainly for shrubs. The use of the regression estimator method improved the estimated shrub biomass values, which were similar to those reported in the literature [Citation54–57]. Also, the regression models developed between biomass and biovolume can still be improved, adjusting the sampling frame criteria.
On other hand, the model interactively simulates the effect of the increased grazing charge on the reduction of the accumulated fuels, and therefore the amount of GHG avoided. Regarding future improvements, animal preferences could be integrated into the evaluation of biomass consumable to improve its estimation. Also, the consideration of renewal rates of biomass could improve the model, in fact, herbaceous layers recover faster than shrubs from grazing pressure, and between shrub species, the turnover or renewal rates are different as well. The present model is also suitable for use in other regions, with similar communities since it is based on the IPCC guidelines, a globally accepted method for reporting GHG emissions. Regression models between mitigated GHG emissions and grazing pressure () could be used for different vegetation communities, as potentially consumable biomass was expressed as total dry matter and used to estimate avoided emission through grazing.
Conclusion
The regression equations for estimating the biomass produced per shrub and hectare and the annual growth found show good precision in the estimation process, making it possible to use them in the future. This study shows the role of grazing in mitigating climate change by reducing fire risk and its GHG emissions. In an open Mediterranean forest dominated by sclerophyllous oaks, the optimal grazing pressure is 3.88 sheep ha−1 day−1, achieving a reduction of about 45% of fuel loads. Under these conditions, livestock should be seen as a tool to mitigate climate change with a potential avoidance of 1245.94 kg CO2eq sheep−1 yr−1. It also shows that more than 50% of the fuels remain in the ecosystem, which can be explained by the size of the shrubs and the small amount that can be removed by this animal species and grazing system. Further research should focus on other types of animals (e.g. cattle, horses) as they are larger and have the potential to consume taller shrubs, and as they are heavier than sheep, they also have a greater impact on fuel control through trampling. The advantage of the approach taken in this research is that it relates grazing pressure to the amount of fuels accumulated and to the emissions arising from them. This model can be used in other types of plant communities and environments, provided that the amounts of accumulated fuels and the intensity of removal are stated.
Supplemental Material
Download MS Word (1,006.9 KB)Acknowledgments
We acknowledge partial funding for this research from the European Regional Development Fund (ERDF) through the INTERREG SUDOE Programme (SOE2/P5/E0804: Open2Preserve).
Disclosure statement
The authors declare that they have no competing interests.
Data availability statement
The datasets used and/or analyzed during the current study are available from the corresponding author on reasonable request.
References
- Lindner M, Maroschek M, Netherer S, et al. Climate change impacts, adaptive capacity, and vulnerability of european Forest ecosystems. For Ecol Manage. 2010;259(4):698–709. doi:10.1016/j.foreco.2009.09.023.
- Stavi I. Wildfires in grasslands and shrublands: a review of impacts on vegetation, soil, hydrology, and geomorphology. Water. 2019;11(5):1042. doi:10.3390/w11051042.
- Pausas JG, Vallejo VR. The role of fire in European mediterranean ecosystems. In: Chuvieco E, editor. Remote sensing of large wildfires. Berlin: Springer; 1999. p. 3–16
- EEA.Forest fires. 2019. [Online]. Available: https://www.eea.europa.eu/data-and-maps/indicators/forest-fire-danger-3/assessment.
- Parente J, Amraoui M, Menezes I, et al. Drought in Portugal: Current regime, comparison of indices and impacts on extreme wildfires. Sci Total Environ. 2019;685:150–173. doi:10.1016/j.scitotenv.2019.05.298.
- Pereira MG, Parente J, Amraoui M, et al. The role of weather and climate conditions on extreme wildfires. In Tedim F, Leone V, McGee TK, editors. Extreme wildfire events and disasters. Amsterdam: Elsevier; 2020. p. 55–72.
- Narayan C, Fernandes PM, van Brusselen J, et al. Potential for CO2 emissions mitigation in Europe through prescribed burning in the context of the Kyoto protocol. For Ecol Manage. 2007;251(3):164–173. doi:10.1016/j.foreco.2007.06.042.
- Camia A, Amatulli G. Weather factors and fire danger in the mediterranean. Earth observation of wildland fires in mediterranean ecosystems. Berlin, Heidelberg: Springer, pp. 71–82. 2009.
- Prober SM, Thiele KR, Rundel PW, et al. Facilitating adaptation of biodiversity to climate change: a conceptual framework applied to the world’s largest mediterranean-climate woodland. Clim Change. 2012;110(1–2):227–248. doi:10.1007/s10584-011-0092-y.
- Spinoni J, Vogt JV, Naumann G, et al. Will drought events become more frequent and severe in Europe? Int J Climatol. 2018;38(4):1718–1736. doi:10.1002/joc.5291.
- EEA. Climate change, impacts and vulnerability in Europe 2016, 2020. https://www.eea.europa.eu/publications/climate-change-impacts-and-vulnerability-2016.
- Carvalho A, Flannigan MD, Logan KA, et al. The impact of spatial resolution on area burned and fire occurrence projections in Portugal under climate change. Clim Change. 2010;98(1–2):177–197. doi:10.1007/s10584-009-9667-2.
- Oliveira M, Delerue-Matos C, Pereira MC, et al. Environmental particulate matter levels during 2017 large Forest fires and megafires in the center region of Portugal: a public health concern? IJERPH. 2020;17(3):1032. doi:10.3390/ijerph17031032.
- Ameray A. Climate change mitigation: Annual carbon balance accounting and mapping in the national Forest ecosystems (continental Portugal). Bragança, Portugal: Polytechnic Institute of Bragança; 2018. p. 145.
- Lasanta T, Khorchani M, Pérez-Cabello F, et al. Clearing shrubland and extensive livestock farming: active prevention to control wildfires in the mediterranean mountains. J Environ Manage. 2018;227:256–266. doi:10.1016/j.jenvman.2018.08.104.
- Meneses BM, Reis E, Reis R. Assessment of the recurrence interval of wildfires in mainland Portugal and the identification of affected LUC patterns. J Maps. 2018;14(2):282–292. doi:10.1080/17445647.2018.1454351.
- Serra P, Pons X, Saurí D. Land-cover and land-use change in a mediterranean landscape: a spatial analysis of driving forces integrating biophysical and human factors. Appl Geogr. 2008;28(3):189–209. doi:10.1016/j.apgeog.2008.02.001.
- Vilar L, Camia A, San-Miguel-Ayanz J, et al. Modeling temporal changes in human-caused wildfires in mediterranean Europe based on land use-land cover interfaces. For Ecol Manage. 2016;378:68–78. doi:10.1016/j.foreco.2016.07.020.
- Beighley M, Hyde AC. Systemic risk and Portugal’s Forest fire defense strategy. In Portucel Conf. 2009. p. 48.
- Castro M, Ameray A, Castro JP. A new approach to quantify grazing pressure under mediterranean pastoral systems using GIS and remote sensing. Int J Remote Sens. 2020;41(14):5371–5387. doi:10.1080/01431161.2020.1731930.
- Starns HD, Fuhlendorf SD, Elmore RD, et al. Recoupling fire and grazing reduces wildland fuel loads on rangelands. Ecosphere. 2019;10(1):e02578. doi:10.1002/ecs2.2578.
- Calleja JA, Escolà M, Carvalho J, et al. Cattle grazing fails to control shrub encroachment in mediterranean landscapes. Rangeland Ecol Manage. 2019;72(5):803–811. doi:10.1016/j.rama.2019.04.005.
- Jenkins M, Price O, Collins L, et al. The influence of planting size and configuration on landscape fire risk. J Environ Manage. 2019;248:109338. doi:10.1016/j.jenvman.2019.109338.
- Torres-Manso F, Fernandes P, Pinto R, et al. Regional livestock grazing, human demography and fire incidence in the portuguese landscape. Forest Syst. 2014;23(1):15. doi:10.5424/fs/2014231-02758.
- Fuhlendorf SD, Engle DM, Elmore RD, et al. Conservation of pattern and process: Developing an alternative paradigm of rangeland management. Rangeland Ecol Manage. 2012;65(6):579–589. doi:10.2111/REM-D-11-00109.1.
- Anderson HE. Aids to determining fuel models for estimating fire behavior. US Department of Agriculture, Forest Service, Intermountain Forest and Range (Vol. 122). 1981.
- Santana J, Porto M, Reino L, et al. Long-term understory recovery after mechanical fuel reduction in mediterranean Cork oak forests. For Ecol Manage. 2011;261(3):447–459. doi:10.1016/j.foreco.2010.10.030.
- Prior LD, Murphy BP, Bowman DMJS. Conceptualizing ecological flammability: an experimental test of three frameworks using various types and loads of surface fuels. Fire. 2018;1(1):14. doi:10.3390/fire1010014.
- Ruiz-Mirazo J, Martínez-Fernández J, Vega-García C. Pastoral wildfires in the mediterranean: Understanding their linkages to land cover patterns in managed landscapes. J Environ Manage. 2012;98:43–50. doi:10.1016/J.JENVMAN.2011.12.017.
- Liedloff AC, Coughenour MB, Ludwig JA, et al. Modelling the trade-off between fire and grazing in a tropical savanna landscape, Northern Australia. Environ Int. 2001;27(2-3):173–180. doi:10.1016/S0160-4120(01)00079-4.
- Davies KW, Bates JD, Svejcar TJ, et al. Effects of Long-Term livestock grazing on fuel characteristics in rangelands: an example from the sagebrush steppe. Rangeland Ecol Manage. 2010;63(6):662–669. doi:10.2111/REM-D-10-00006.1.
- Davies KW, Boyd CS, Bates JD, et al. Winter grazing can reduce wildfire size, intensity and behaviour in a shrub-grassland. Int J Wildland Fire. 2016;25(2):191–199. doi:10.1071/WF15055.
- Davies KW, Gearhart A, Boyd CS, et al. Fall and spring grazing influence fire ignitability and initial spread in shrub steppe communities. Int J Wildland Fire. 2017;26(6):485–490. doi:10.1071/WF17065.
- Braasch M, García-Barrios L, Ramírez-Marcial N, et al. Can cattle grazing substitute fire for maintaining appreciated pine savannas at the frontier of a montane Forest biosphere-reserve? Agriculture, Ecosystems & Environment. 2017;250:59–71. doi:10.1016/j.agee.2017.08.033.
- Travers SK, Eldridge DJ, Koen TB, et al. Livestock and kangaroo grazing have little effect on biomass and fuel hazard in semi-arid woodlands. For Ecol Manage. 2020;467:118165. doi:10.1016/j.foreco.2020.118165.
- ICNF. Apoio à Realização de Fogo Controlado no âmbito da Prevenção dos Fogos florestais 2018/2019. 2018. http://www2.icnf.pt/portal/fundos/fundo-florestal-permanente/candidatura-2018.
- Ruiz-Mirazo J, Robles AB, González-Rebollar JL. Two-year evaluation of fuelbreaks grazed by livestock in the wildfire prevention program in Andalusia (Spain). Agric Ecosyst Environ. 2011;141(1–2):13–22. doi:10.1016/j.agee.2011.02.002.
- Bidwell T, Elmore D, Hickman K. Stocking rate determination on native rangeland. Oklahoma Cooperative Extension, 2013. http://osufacts.okstate.edu
- Salgado-Luarte C, Escobedo VM, Stotz GC, et al. Goat grazing reduces diversity and leads to functional, taxonomic, and phylogenetic homogenization in an arid shrubland. Land Degrad Dev. 2019;30(2):178–189. doi:10.1002/ldr.3208.
- Meehan MA, Sedivec KK, Printz JL, and, Brummer FA. Determining carrying capacity and stocking rates for range and pasture in North Dakota. NDSU Extension, North Dakota State University; 2018.
- IPMA. Weather data. 2019. https://www.ipma.pt/en/oipma/.
- Elzinga CL, Salzer DW. Measuring and monitoring plant populations. US Department of the Interior, Bureau of Land Management; 1998.
- Catchpole WR, Wheeler CJ. Estimating plant biomass: a review of techniques. Austral Ecol. 1992;17(2):121–131. doi:10.1111/j.1442-9993.1992.tb00790.x.
- Papachristou TG, Dziba LE, Provenza FD. Foraging ecology of goats and sheep on wooded rangelands. Small Rumin Res. 2005;59(2–3):141–143. vol doi:10.1016/j.smallrumres.2005.05.003.
- Kirmse RD, Norton BE. Comparison of the reference unit method and dimensional analysis methods for two large shrubby species in the caatinga woodlands. J Range Manage. 1985;38(5):425. doi:10.2307/3899714.
- Carpenter AT, West NE. Validating the reference unit method of aboveground phytomass estimation on shrubs and herbs. Vegetatio. 1987;72:75–79. doi:10.2307/20038200.
- Kiregyera B. Regression-type estimators using two auxiliary variables and the model of double sampling from finite populations. Metrika. 1984;31(1):215–226. doi:10.1007/BF01915203.
- Rao PSRSBT-H of S18 Ratio and regression estimators. Handbook of Statistics. 1988;6:449–468.
- Wharton EH, Griffith DM. Methods to estimate total Forest biomass for extensive Forest inventories: Applications in the northeastern US. USA Department of Agriculture Forest Service. 1993. https://www.osti.gov/biblio/5132445.
- Council NR. Predicting feed intake of food-producing animals. Washington DC: National Academies Press; 1987.
- IPCC. 2006 IPCC guidelines for national greenhouse gas inventories, Vol. 4. Geneva: Intergovernmental Panel On Climate Change; 2006.
- IPCC. Global Warming Potential Values used in the fifth Assessment Report (AR5). 2014. www.ipcc.ch.
- Fuglestvedt JS, Isaksen ISA, Wang W-C. Estimates of indirect global warming potentials for CH4, CO and NOX. Clim Change. 1996;34(3–4):405–437. no doi:10.1007/BF00139300.
- Riedel JL, Bernues A, Casasus I. Livestock grazing impacts on herbage and shrub dynamics in a mediterranean natural park. Rangeland Ecol Manage. 2013;66(2):224–233. doi:10.2111/REM-D-11-00196.1.
- Sirca C, Caddeo A, Spano D, et al. Methods for biomass stock estimation in mediterranean maquis systems. iForest. 2017;10(1):108–114. doi:10.3832/ifor1769-009.
- De Luis M, Baeza MJ, Raventós J, et al. Fuel characteristics and fire behaviour in mature mediterranean gorse shrublands. Int J Wildland Fire. 2004;13(1):79–87. doi:10.1071/WF03005.
- Casasús I, Bernués A, Sanz A, et al. Vegetation dynamics in mediterranean Forest pastures as affected by beef cattle grazing. Agriculture, Ecosystems & Environment. 2007;121(4):365–370. doi:10.1016/j.agee.2006.11.012.
- Navarro Cerrillo R, Oyonarte P. Estimation of above-ground biomass in shrubland ecosystems of Southern Spain. Invest Agrar: Sist Recur For. 2006;15(2):197. doi:10.5424/srf/2006152-00964.
- Pasalodos-Tato M, Ruiz-Peinado R, Del Río M, et al. Shrub biomass accumulation and growth rate models to quantify carbon stocks and fluxes for the mediterranean region. Eur J Forest Res. 2015;134(3):537–553. doi:10.1007/s10342-015-0870-6.
- De Cáceres M, Casals P, Gabriel E, et al. Scaling-up individual-level allometric equations to predict stand-level fuel loading in mediterranean shrublands. Ann for Sci. 2019;76(3):1–17. doi:10.1007/s13595-019-0873-4.
- Woodmansee RG, Duncan DA. Nitrogen and phosphorus dynamics and budgets in annual grasslands. Ecology. 1980;61(4):893–904. doi:10.2307/1936759.
- Castro H, Freitas H. Above-ground biomass and productivity in the montado: from herbaceous to shrub dominated communities. J Arid Environ. 2009;73(4–5):506–511. doi:10.1016/j.jaridenv.2008.12.009.
- Evlagon D, Kommisarchik S, Glasser T, et al. How much browse is available for goats that graze mediterranean woodlands. Small Ruminant Research. 2010;94(1–3):103–108. no doi:10.1016/j.smallrumres.2010.07.008.
- Ruiz-Mirazo J, Robles AB. Impact of targeted sheep grazing on herbage and holm oak saplings in a silvopastoral wildfire prevention system in South-Eastern Spain. Agroforest Syst. 2012;86(3):477–491. doi:10.1007/s10457-012-9510-z.
- Fonseca T, Manso F, Martins C, et al. A gestão florestal sustentável na prevençâo do risco de incêndio: silvicultura e pastoreio na redução da biomassa combustível. 2021. p. 54–71.
- Johansson MU, Granström A. Fuel, fire and cattle in african highlands: traditional management maintains a mosaic heathland landscape. J Appl Ecol. 2014;51(5):1396–1405. doi:10.1111/1365-2664.12291.
- Etienne M, Armand D, Julian P, and, Napoleone M. Un contrat d’entretien de pare-feu par des moutons. Bilan 1987–1992. Avignon, France: INRA; 1993.
- Mosley JC, Roselle L. Targeted livestock grazing to suppress invasive annual grasses. In: Launchbaugh K, editor. Targeted grazing: a natural approach to vegetation management and landscape enhancement. Centennial (CO): American Sheep Industry Association; 2006. p. 67–76.
- Thornes JB. Coupling erosion, vegetation and grazing. Land Degrad Dev. 2005;16(2):127–138. doi:10.1002/ldr.655.
- Oñatibia GR, Amengual G, Boyero L, et al. Aridity exacerbates grazing‐induced rangeland degradation: a population approach for dominant grasses. J Appl Ecol. 2020;57(10):1999–2009. doi:10.1111/1365-2664.13704.
- Piñeiro G, Paruelo JM, Oesterheld M, et al. Pathways of grazing effects on soil organic carbon and nitrogen. Rangeland Ecol Manage. 2010;63(1):109–119. doi:10.2111/08-255.1.
- Abdalla M, Hastings A, Chadwick DR, et al. Critical review of the impacts of grazing intensity on soil organic carbon storage and other soil quality indicators in extensively managed grasslands. Agric Ecosyst Environ. 2018;253:62–81. doi:10.1016/j.agee.2017.10.023.
- Fernandes PM, Botelho HS. A review of prescribed burning effectiveness in fire hazard reduction. Int J Wildland Fire. 2003;12(2):117–128. doi:10.1071/WF02042.
- Valkó O, Török P, Deák B, et al. Prospects and limitations of prescribed burning as a management tool in european grasslands. Basic Appl Ecol. 2014;15(1):26–33. doi:10.1016/j.baae.2013.11.002.
- Pinares-Patiño CS, Waghorn GC, Hegarty RS, et al. Effect of intensification of pastoral farming on greenhouse gas emissions in New Zealand. N Z Vet J. 2009;57(5):252–261. doi:10.1080/00480169.2009.58618.
- Grossi G, Goglio P, Vitali A, et al. Livestock and climate change: impact of livestock on climate and mitigation strategies. Anim Front. 2019;9(1):69–76. doi:10.1093/af/vfy034.