
 ?Mathematical formulae have been encoded as MathML and are displayed in this HTML version using MathJax in order to improve their display. Uncheck the box to turn MathJax off. This feature requires Javascript. Click on a formula to zoom.
Abstract
Logging is a dominant land-use activity across the tropics and a significant source of greenhouse gas emissions. This study quantifies emissions from selective logging in a Forest Stewardship Council (FSC) certified concession in Guyana that includes carbon in extracted logs, tree carbon left in the forest, and incidental tree mortality caused by felling and logging infrastructure. We also estimate carbon emissions from sawmilling of round logs. Emissions from harvested trees from stump to mill gate were 8.44 Mg CO2 m−3 (131.96 Mg CO2 ha−1). The main sources of emissions were from trees killed during felling (34%) and unextracted biomass of harvested trees (32%). On average, 15.5% of the harvested tree biomass and 43% of the log biomass was converted to sawn lumber (0.78 Mg CO2 m−3 of round log volume). We find similar levels of logging emissions in our study with those reported for non-FSC concessions in Guyana (8.54 Mg CO2 m−3) and Suriname (8.94 Mg CO2 m−3) but higher in two FSC-certified concessions in Suriname (6.65 Mg CO2 m−3). Adopting forest management practices that reduce residual stand mortality from felling and improved milling technology to reduce wood waste will help meet future demand for wood products and support climate mitigation goals.
Introduction
Globally, logging occurs in two billion hectares of natural forests [Citation1]. In the tropics, 400 Mha of forest is officially designated for timber production, generally through selective harvests of high-value tree species [Citation2,Citation3]. If responsibly managed, these forests provide critical conservation and climate mitigation services [Citation4–7]. Unfortunately, poor logging is a significant source of tropical forest degradation and carbon emissions [Citation8,Citation9]. Fortunately, logging emissions can often be halved by adopting reduced-impact logging for carbon (RIL-C) practices without reductions in timber yields [Citation8]. The estimated potential global climate mitigation contribution from adopting RIL-C is 516 TgCO2 yr−1 at less than USD100 MgCO2 [Citation10].
Carbon emissions from selective logging of tropical forests are caused by forest clearing for infrastructure (roads, log yards, and main skid trails), residual forest damage due to felling and skidding, and unutilized biomass of harvested trees. A pan-tropical study estimated that these emissions range 2.31–17.64 Mg CO2 m−3 of wood extracted in logs and 2.71-282.90 Mg CO2 ha−1 of forest area logged [Citation8]. Ellis et al. [Citation8] also estimated that reducing logging emissions by as much as 44% would be possible by adopting RIL-C practices. Widespread adoption of RIL-C could also lead to improved efficiencies that result in higher levels of wood recovery from felled trees, more rapid post-logging forest recovery, and better biodiversity outcomes [Citation11,Citation12].
Another source of emissions from forestry operations is wood waste during log milling into saw timber or veneer. Sawmill recovery rates (i.e. proportions of logs converted into wood products) range from 42-60% across the tropics [Citation13]. Increased log conversion efficiencies will help satisfy future demands for wood products without expanding the logging footprint [Citation14]. The direct mitigation benefit of improving milling recovery is that more harvested tree carbon is locked away in long-lived wood products that can replace carbon-costly materials (e.g. aluminum, cement, and steel). Additionally, these resource-intensive non-wood building materials do not provide CO2 removals, as the regrowth of forests from where the wood is sourced does, further contributing needed climate mitigation [Citation15,Citation16].
In this study, we quantify the emissions from selective logging in a forest in Guyana. The forests are managed under assumed sustainable harvest intensities based on a country-wide estimated forest growth rate of 0.33 m3 ha−1 yr−1, a maximum harvest intensity of 20 m3 ha−1 with a 60-year harvest rotation, and species-specific minimum harvest diameters ranging from 40-70 cm DBH (diameter at 1.3 m or above buttresses). This forest has been certified as responsibly managed by the Forest Stewardship Council (FSC) continuously since 2016, potentially indicating better environmental outcomes for the residual forest stand. We also extend our emission assessment to include wood waste from the milling of logs into sawn lumber. Such analyses of emissions from the forestry sector are important for national reporting of greenhouse gas emissions from Agriculture, Forestry, and Other Land Use (AFOLU).
Materials and methods
Study site
We measured logging emissions from previously unlogged areas in central Guyana in Iwokrama Forest (latitude:4.6722, longitude: −58.6846; hereafter, Iwokrama). Iwokrama is co-owned and co-managed by local indigenous communities and an international NGO, the Iwokrama International Center (IIC). Iwokrama covers 371,680 ha of lowland tropical moist forests on the Guiana Shield and was established as an experimental research site for developing and implementing technologies and knowledge systems for the sustainable utilization of tropical rainforests [Citation17]. Iwokrama is zoned into a wilderness preserve (187,174 ha) where no anthropogenic disturbances are allowed aside from the continuation of traditional indigenous practices and a sustainable use zone where extractive activities, mainly logging, are conducted (184,506 ha; ).
Figure 1. Map of harvest blocks sampled for logging emissions and associated infrastructure located in forests harvested in Iwokrama. Inset map shows the division of Iwokrama into a sustainable utilization zone (SUA) and a wilderness preserve (WP).
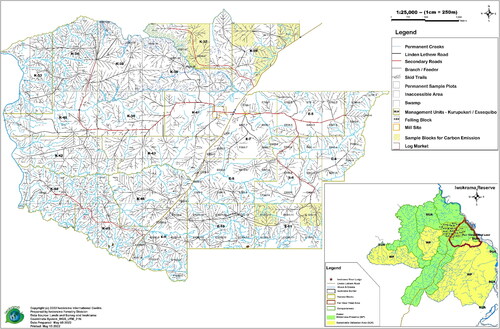
Industrial logging commenced in Iwokrama in 2007 with an average annual harvest area of 1,000 ha, producing 12.9 m3 ha−1 of logs (7.3 − 17.0 m3 ha−1) between 2007 and 2022 with a planned 60-year harvest cycle. Forestry operations include milling within Iwokrama to produce sawn lumber, with no log exports. Harvesting is expected to follow RIL guidelines, including a pre-harvest inventory (terrain and tree location mapping), tree selection, and pre-planning logging infrastructure (e.g. haul roads, skid trails, and log yards) to optimize extraction routes. Roads and skid trails are built with a bulldozer (i.e. crawler tractor), and logs are yarded to roadside landings with rubber-tired grapple skidders (See Table S1 for a list of equipment used for infrastructure development, log extraction, and milling). A total of 18 species are harvested with minimum cutting diameters that are species-specific (Table S2).
Iwokrama’s business model includes a Joint-Venture Agreement with a private-sector logging company. Iwokrama is responsible for harvest planning, tree selection, and compliance monitoring against RIL guidelines and FSC principles. The private-sector partner (i.e. subcontractor) is responsible for harvesting trees, processing logs into sawn timber, and marketing sawn wood products. Several indigenous and local communities are formal stakeholders in the timber operations, which reflects their historical use and ownership of Iwokrama, including sharing income from the forestry business and co-management responsibilities. Under this agreement, local communities can recover side-cuts discarded during sawmilling for local use, but the carbon consequences of this use were not measured and are disregarded in this study. One motivation for milling on site is that Iwokrama is remote, with a road transport time of 12 h from the sawmill to the major port of export and the domestic market centered in the capital city of Georgetown.
Carbon accounting approach for quantifying logging emissions
For field data collection and emissions accounting, we employed RIL-C measurement protocols [Citation8, Citation18,Citation19] to quantify carbon in the extracted logs, unextracted carbon from harvested trees (i.e. branches, abandoned log sections), incidental tree mortality caused by felling, and logging infrastructure disaggregated into haul roads, skid trails, and log yards. We also quantified carbon retained in sawn lumber and lost from the milling of the extracted logs by measuring inputted log volumes and outputted saw timber volumes. Saw timber recovery data were collected over four years (2016–2019) and disaggregated by species (Table S2).
We use data from permanent 1 ha sample plots (PSPs) in the production forest to estimate unlogged forest biomass (see below) and data collected by the Iwokrama Center, including tree-level harvest records and maps of haul roads, skid trails, and log yards.
To simplify the carbon accounting process and be consistent with Pearson et al. [Citation20], we focus on committed emissions and adopt the simplifying IPPC Tier 1 assumption that all logging-related tree mortality and extracted carbon are emitted at the time of the event.
Sample intensity and harvest block selection
In 2022 we randomly selected eight of 21 harvest blocks logged between 2020 and 2022 to be sampled for logging emissions. We only sampled blocks logged within the previous two years to ensure that logging impacts were still visible. Each harvest block is approximately 100 ha of gross forest area and is the smallest spatial unit of forest management (except harvest block K741-38, which was 20 ha due to topographic features). The net harvest area within a block is the area eligible for logging and excludes riparian buffer areas, swamps, steep slopes (>40%), spiritual and cultural sites, and unproductive forest types if present (). The dominant species harvested is Chlorocardium rodiei (Greenheart), representing 61% of all harvested trees in the sampled blocks. The second harvested species is Dicorynia guianensis (Wamaradan), which accounted for 21% of harvested stems.
Table 1. Sampled harvest blocks, including the number of harvested trees, extracted log volumes, and logging infrastructure (log landings, haul roads, and skid trails).
Unlogged forest biomass
We use pre-logging census data from 18 PSPs to estimate biomass of trees ≥10 cm specific to the forest types found within the harvest blocks sampled for logging emissions. We estimated the aboveground biomass of trees based on the following allometric equation for moist tropical forests [Citation21,Citation22]:
(1)
(1)
is a measure of environmental stress estimated from PSP locations (latitude and longitude) and captures temperature seasonality, climatic water deficit, and precipitation seasonality to build the diameter-height allometry in the absence of direct total tree height measurements;
is wood density in g cm−3, and
is tree diameter in cm. We estimate belowground biomass from aboveground biomass utilizing EquationEquation (2)
(2)
(2) from Mokany et al. [Citation23]:
(2)
(2)
We convert total tree biomass () to carbon using 0.47 as the carbon fraction of dry matter [Citation24].
Extracted log volumes (ELV – m3 ha−1)
Extracted timber volumes delivered to the sawmill are from data collected by Iwokrama. These data are part of the production monitoring system implemented to calculate payments from the subcontractor to Iwokrama and to local communities based on timber production volumes and represent a 100% sample of harvested trees. We validated these records with field measurements of extracted log sections across 189 felling gaps in the eight sampled harvest blocks.
Extracted log emissions (RWC - Mg CO2 m3)
Extracted log emissions capture the carbon in the harvested tree portion (the log or bole) removed from the stump (i.e. extracted log volume; ELV). We calculate the carbon in extracted logs using the following equation:
(3)
(3)
is the extracted log volume,
is species-specific wood density in g cm−3, 0.47 is the biomass-to-carbon ratio, and 10−6 is the conversion factor to Mg from cm−3. We also accounted for any missing mass in hollow portions of log sections based on the diameter and length of the hollow sections. If the hollow was only detected at one end of a log, we assumed the hollow was half the log’s length and cylindrical. Hollow volumes were subtracted from the total tree biomass. Carbon is converted to CO2 using one kilogram (kg) of carbon is equivalent to 3.67 kg of CO2.
Unextracted felled tree emissions (UFE - Mg CO2 m3)
The unextracted felled tree emissions (UFE) parameter captures the pool of dead carbon left in felling gaps, including branches, roots, and abandoned log sections from the harvested tree (unextracted biomass). We estimate UFE based on the following equation:
(4)
(4)
is the total biomass (aboveground and belowground) of harvested trees,
is the extracted biomass in logs hauled to the mill; and
is the volume of wood hauled to the mill (m3).
Collateral logging damage emissions (CDE - Mg CO2 m3)
Collateral logging damage emissions (CDE) are from trees killed or severely damaged during felling operations and include trees that were felled with no wood recovered either due to log defects or because they were missed during extraction. We estimate CDE using the following equation.
(5)
(5)
is the biomass from collaterally killed trees in felling
are trees felled with no wood utilized. We used the equations of Chave et al. [Citation21] and Mokany et al. [Citation23] to estimate aboveground and belowground tree biomass (EquationEquation 1
(1)
(1) ) for collaterally killed trees and felled but abandoned trees. Only trees classified as snapped or uprooted were included in collateral damage emissions, while trees with bark damage and partial crown loss were assumed to survive due to a lack of evidence to the contrary.
In each harvest block, we sampled an average of 24 felling gaps to assess the number of trees ≥10 cm killed during felling (CDE), extracted biomass in logs (ELE), and unextracted harvested tree biomass (UFE), for a total sample of 189 felling gaps sampled.
Felling emissions is the sum of the collateral logging damage emissions and emissions from the felled tree.
(6)
(6)
Skid trail emissions (S - Mg CO2 m3)
Using post-harvest survey maps, we estimated the total length of skid trails () in the sampled harvest blocks. Within each sampled block, we established 15 10 m-long plots along skid trails to assess carbon emitted from trees (≥10 cm DBH) killed during the process of skid trail construction and skidding of logs. The average carbon emissions from skid trails (EquationEquation 7
(7)
(7) ) were calculated based on the average carbon emitted from trees killed (
per meter of skid trail times the total length of skid trails divided by the ELV specific to the sampled harvest block. Only snapped and uprooted trees ≥10 cm were included in calculations of skidding emissions:
(7)
(7)
Haul road emissions and log yard emissions (H)
We estimated the forest area cleared by haul roads using the mapped length and average haul road widths measured in the field in the sampled harvest blocks. Haul road widths were defined as the perpendicular distance between the trunks of undamaged trees ≥5 cm DBH on either side of the road, with additional width measurements of the active road surface. A total of 33 haul road width measurements were recorded. The total length of all haul roads was extracted from post-harvest infrastructure maps with field validation for the sampled harvest blocks. To estimate carbon emissions from haul roads, we utilized the baseline carbon stocks measured in unlogged forests ( Table S3). We estimated the carbon emitted from haul roads per cubic meter of wood harvested based on EquationEquation 8
(8)
(8) .
(8)
(8)
We measured the dimensions of 15 log yards in and around each sampled harvest block to estimate an average log yard size (m2). We also counted the total number of log yards established in the sampled harvest blocks to calculate the total area occupied by log yards in harvest areas. Carbon emissions from log yard construction were then estimated from the area of forest cleared using the baseline carbon stocks for unlogged forest (Table S3) following EquationEquation 9(9)
(9) .
(9)
(9)
Total emissions from haul road and log yard construction is:
(10)
(10)
R = haul road emissions in sampled block (Mg ) and L = log yard (log landing) emissions in sampled block (Mg
)
Wood milling emissions (WME)
We utilize species-specific measurements of the efficiency of conversion of round logs to sawn dimensional lumber to estimate emissions from wood wastage in the sawmill. The primary sawn wood products are cants (4 × 4 to 20 × 20 inches) and planks with varying dimensions. The mill is a Woodmizer long mill head-rig (see Tables S1 and S2 for a description of milling equipment and species-specific log conversion efficiencies).
Table 2. Harvest emissions (Mg CO2 m−3) from selective logging across eight harvest blocks in an FSC certified concession in Guyana.
Carbon impact factor (CIF - Mg C Mg C−1)
In addition to presenting emissions per cubic meter of wood harvested and per hectare of harvest area, we also calculate the carbon impact factor (CIF; Mg C Mg C−1). CIF is the emitted carbon from felling per unit extracted carbon (carbon in roundwood removed from stump) [Citation25]. CIF adjusts for species-specific wood densities to enable comparisons of logging emissions across different geographies and harvest practices, with lower CIF values indicating lower emissions from logging. Including the CIF seems justified for Guyana where wood densities are typically very high (community average wood density of 0.69 g cm−3 for Guiana Shield forests; [Citation26].
(10)
(10)
Where = total logging emissions in sampled block (Mg C) that includes unextracted fell tree, collateral damage, skidding, haul roads, and log yards emissions;
is total extracted roundwood timber carbon in sampled block (Mg C).
Results
Harvest intensity and associated harvest tree emissions
Across the eight sampled harvest blocks with a total net harvest area of 619.9 ha, harvest intensity averaged 5.37 trees ha−1 (trees that had some portion of their bole hauled to the mill gate as well as felled trees that yielded no timber). Log extraction averaged 13.91 m3 ha−1 () with an average log volume of 2.65 m3 tree−1 harvested. The average DBH of felled trees was 59.8 cm, and the average log length extracted was 13.4 m (SI: Appendix 1). Rejected trees (no log section harvested) accounted for 2.72% of all trees felled, with the leading causes of rejection being hollowness (57% of all rejected trees), with 30% of rejected logs due to log splitting during felling (Table S4). We did not encounter any harvested tree without defects that were abandoned in the forest.
Across the harvest blocks sampled, we quantify a spatial impact of 4.5% and 5.1% of the gross harvest area and net harvest area, respectively, is occupied by skid trails, hauls roads and log yards.
Extracted and unextracted felled tree emissions
The average carbon stock (above and below ground) of a single harvested trees was 10.72 Mg CO2, with 36% of the tree carbon extracted in the form of logs (3.64 Mg CO2 tree−1). For every cubic meter of wood hauled to the mill gate, 2.69 Mg CO2 from the felled tree was committed to the dead wood, and fine litter pools in the forest from the unextracted fell tree biomass (37.37 Mg CO2 ha−1; and ). On average, trees felled and rejected across the eight blocks emitted 1.51 Mg CO2 ha−1.
Table 3. Harvest emissions (Mg CO2 ha−1) from selective logging across eight harvest blocks in an FSC concession in Guyana.
Collateral tree damage emissions
A total of 189 felling gaps were sampled, that included 293 felled tree stumps (including felled and rejected trees). Trees snapped and uprooted accounted for 54% of the collateral tree damage caused by felling (considered as mortality in this analysis; Table S5). Trees that were damaged and assumed to survive primarily suffered crown damage (27%), with the others suffering from bark damage and leaning (19%).
On average, 5.85 trees ≥10 cm DBH were killed (snapped or uprooted) per harvest tree during felling operations. An additional 4.79 trees per harvest tree were leaning or suffered damage to their crown or bark. The 5.85 trees classified as having suffered fatal collateral tree damage represent, on average, 9.97 Mg CO2 per felled tree. For every cubic meter of log extracted from the forest and hauled to the mill gate, 2.90 Mg CO2 m3 is associated with collaterally killed tree biomass (inclusive of trees felled and rejected). These emissions total 56.56 Mg CO2 ha−1.
Skidding emissions
Skid trail density in the net and gross harvest areas were 0.09 km ha−1 and 0.08 km ha−1 with an average skid trail width of 3.9 m. The average diameter of trees ≥10 cm DBH killed by skidding was 17.9 cm, with an average tree biomass of 0.84 Mg CO2. For every hectare harvested, an estimated 88.0 m of skid trails were constructed, or 17.4 m of skid trails per tree harvested (i.e. those with some portion of log bole extracted) with skidding emissions of 0.24 Mg CO2 m−3 (3.15 Mg CO2 ha−1). The main damage type to residual trees caused by skidding was bark damage (64% of trees assessed) with 29% of trees uprooted (Table S6).
Haul road emissions
Haul roads had an average active surface width of 5.2 m and a full corridor width of 15.1 m to the trees on the border of the closed forest canopy. For every hectare of net production area, approximately 135.70 m2 of forests was cleared for haul roads, which represents 0.99 Mg CO2 m−3 of logs extracted and 12.52 Mg CO2e ha−1.
Log yard emissions
The average size of log yards was 2004.2 m2, with 1.5 log yards on average per harvest block. Construction of log yards emits 0.24 Mg CO2 m−3 and, an average of 3.19 Mg CO2e ha−1.
Log milling emissions
Species-specific round log-to-sawn lumber conversion percentages were measured from processing 60,005 m3 of logs, with a final sawn wood output of 25,889 m3, representing an average recovery rate of 43% of the log volume (Table S2). Approximately 15.5% of harvested tree carbon was converted to sawn lumber, producing on average 0.78 Mg CO2 m−3 of wood waste (i.e. slabs, bark, edges, off-cuts, sawdust, and shavings).
Logging emissions summary and carbon impact factor
Logging emissions to the mill gate totaled 8.44 Mg CO2 m−3 and 131.96 Mg CO2 ha−1 (). The largest source of emissions was from collateral killed trees (34%) and the unextracted harvest tree biomass (32%; ). The mean carbon impact factor across the eight sampled harvest blocks was 6.02 Mg C Mg C−1 ().
Figure 2. Logging emissions disaggregated into infrastructure (log landings, haul roads, skid trails), collateral damage, unextracted felled tree biomass and extracted fell tree biomass.
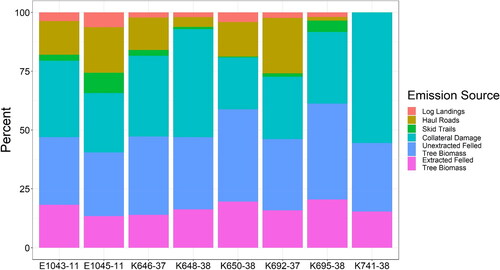
Figure 3. Boxplot of emitted carbon per unit extracted carbon (CIF; Mg Mg−1) for Iwokrama, Guyana compared to seven other tropical countries (Democratic Republic of Congo, Kalimantan-Indonesia, Gabon, Madre De Dios-Peru, Suriname, Republic of Congo, and Yucatan-Mexico; Ellis et al. [Citation8]). CIF adjusts for wood density variation among geographies.
![Figure 3. Boxplot of emitted carbon per unit extracted carbon (CIF; Mg Mg−1) for Iwokrama, Guyana compared to seven other tropical countries (Democratic Republic of Congo, Kalimantan-Indonesia, Gabon, Madre De Dios-Peru, Suriname, Republic of Congo, and Yucatan-Mexico; Ellis et al. [Citation8]). CIF adjusts for wood density variation among geographies.](/cms/asset/d29f3e22-dfaa-4deb-aeae-8290250ca37a/tcmt_a_2378740_f0003_c.jpg)
Discussion
Logging emissions across the eight sampled harvest blocks in Iwokrama was 8.44 Mg CO2 m−3 for logs delivered to the mill and 131.96 Mg CO2 ha−1 at an average logging intensity of 13.91 m3 ha−1 (). We also found that 15.5% of aboveground plus belowground tree biomass and 43.0% of the extracted log biomass, respectively, were converted to sawn wood products. Based on these measurements, Iwokrama’s forestry operations resulted in emissions of 67,334 Mg CO2 in 2021 based on an annual production volume of 7,978 m3 of logs delivered to the mill. An additional 6,222 Mg CO2 was emitted as wood waste from milling those logs into sawn lumber. Logging in Iwokrama also results in a CIF factor of 6.02 Mg C Mg C−1, close to the median value assessed for seven other tropical countries (5.74 Mg C Mg C−1; ).
Our 8.44 Mg CO2 m−3 estimate of logging emissions from the harvest of 13.9 m3 ha−1 is similar to the 8.54 Mg CO2 m−3 reported for four other non-FSC certified logging concessions in Guyana harvested at 13.0 m3 ha−1[20]. The two main sources of logging emissions in Iwokrama were trees killed during felling and the unextracted biomass of felled trees, accounting for 66% of harvest emissions (). Relative to the Pearson et al. [Citation20] study, emissions from Iwokrama’s forestry infrastructure that were 2.5 times lower (1.47 vs. 3.59 Mg CO2 m−3) and emissions from collateral damage and unextracted felled tree biomass that were 1.5 times higher (5.59 vs. 3.63 Mg CO2 m−3). Difference in logging infrastructure emissions could be due to methodological differences, for example Pearson et al. [Citation20] estimated impact from roads and log landings using satellite imagery compared to field measurements employed by our study. We recorded higher average DBHs of felled trees in Iwokrama (60 vs. 53 cm) but shorter extracted log lengths (13.5 vs. 16 m) than those reported in Pearson et al. [Citation20]. The shorter logs extracted and, by extension, high levels of unextracted felled tree biomass in Iwokrama, can be attributed to poor felling and bucking. For example, the average stump height (90 cm) was much higher than the recommended height of 30 cm for maximizing merchantable timber recovery [Citation27].
The primary sources of emissions from logging in Iwokrama were collateral tree damage (34%) and unextracted felled tree biomass (32%), while in a pantropical assessment of logging emissions by Ellis et al. [Citation8] the primary source of emissions were haul roads (35%) and unextracted felled tree biomass (33%)[Citation8]. Haul roads accounted for only 12% of logging emissions in Iwokrama with these lower emissions from logging infrastructure could be attributed to detailed harvest planning that included pre-harvest inventories, mapping of tree locations, and topographic features of the harvest blocks. Another benefit associated with harvest planning and tree selection was the lower number of felled trees rejected in the forest due to defects, measured at 2.7% in Iwokrama, nearly four times lower than the pantropical levels of 10% of felled trees [Citation8].
Using the same RIL-C protocols as used in this study, Zalman et al. [Citation19] reported that logging emissions from two FSC-certified forests in neighboring Suriname, also on the Guyana Shield, averaged 6.65 Mg CO2 m−3 for a harvest intensity of 15.06 m3 ha−1 versus 8.44 Mg CO2 m−3 at 13.9 m3 ha−1 in our study in Guyana. Among the possible explanations for the lower emissions is that harvested trees in certified concessions in Suriname were larger (76.3 cm vs. 60.0 cm DBH) and the extracted logs longer (15.1 vs. 13.5 m), which meant that the same harvest volumes were attained with the felling of fewer trees (2.3 vs. 5.3 trees ha−1). On the other hand, skid trail emissions were higher in Suriname than in Guyana (0.44 vs. 0.24 Mg CO2 m−3). Emissions from log decks and haul roads, expressed per cubic meter of timber harvested, were similar in the two studies. In both, unextracted carbon from felled trees and collateral damage from felling constituted the major sources of emissions from selective logging. Logging emissions averaged across FSC-certified, and non-FSC concessions in Suriname were similar to those reported in our study in Guyana.
We would expect lower logging emissions from certified concessions, like Iwokrama, due to required adherence to FSC Principle 5 (efficient use of forest products and economic viability) and FSC Principle 6 (mitigating environmental impacts; [Citation28]). The apparent lack of carbon benefits from FSC certification in Iwokrama may in part be attributed to the quality of national laws and their enforcement [Citation29]. For FSC certification to promote better climate outcomes, its auditors will need to pay more attention to practices that generate measurable emissions reductions from logging, e.g. improved felling and bucking for log recovery. For these improved practices to be adopted, incentive systems may be needed that reward workers for successful application of RIL-C practices, which would be a logical use of carbon financing. More fundamentally, a detailed theory-of-change analysis of how FSC auditors are expected to assess and promote good harvesting practices could uncover insufficiencies and unsatisfied assumptions, like those revealed for timber yield sustainability [Citation30].
Our study also reinforces the importance of improved log milling to forestry emissions, as only 18.5% (aboveground tree biomass only) and 43% of the extracted log biomass are converted to sawn lumber. Wood wastage from milling is found in slabs, bark, edges, off-cuts, sawdust, and shavings, with sawn wood recovery rates dependent on a number of factors such as log size and quality, species, defects, sawmilling equipment, mill maintenance, production methods, grading, storage, and drying [Citation13] but also with whether facilities are available to convert wood waste into marketable products such as chipboard and oriented strand board. Recovery rates reported for the Iwokrama forestry operations are similar to the 38-40% recovery rates reported for sawmills elsewhere in Guyana [Citation31]. Low sawmilling lumber yields are also common across the Brazilian Amazon (45%; [Citation32]) and Indonesia (54%) [Citation13]. The low recovery of sawn lumber has been attributed to outdated milling technology used by timber industries in these countries [Citation13]. For example, adopting new milling technologies resulted in recovery rates of 71% in Ghana [Citation33]. The 81.5% of the aboveground biomass of felled trees that remains in the forest also presents an opportunity to improve wood and sawn lumber recovery. Crowns, for example, generally include large diameter branches that could be recovered for sawn lumber. Adopting newer milling technologies, such as finger-jointed lumber production that utilizes smaller logs, could increase the tree biomass recovered. However, access and adoption of these improved technologies requires substantial monetary investments and would benefit from incentives, such as those from a program recently launched by the Government of Guyana to improve conversion of harvested trees to wood products [Citation34].
Assessments of logging emissions contribute to our understanding of the forestry sector’s greenhouse gas emissions and can reveal opportunities for emission reductions. For example, we identified low emissions that can be achieved well planned and constructed roads, log yards, and skid trails that covered only 1.2%, 0.3%, and 3.0% of the gross area of logging blocks. In contrast, we observed high emissions from the portions of harvested trees left in the forest (only 18.5% of the harvested tree aboveground biomass is converted into wood products) and trees killed during harvesting, representing an opportunity for emissions reductions. Leveraging the emerging compliance and voluntary carbon markets and direct government support should help incentivize forestry practices that reduce emissions from logging and enhance carbon stocks in managed forests. For example, several standards are currently available to generate carbon offset credits from reducing logging emissions and increasing forest carbon stocks through improved forest management actions (e.g. VM0035 Methodology for Improved Forest Management through Reduced Impact Logging). Developing similar standards that generate carbon offset credits from reducing wood waste during milling could provide financial returns that reduce investment barriers to adopting improved milling technology.
Supplemental Material
Download MS Word (18.9 KB)Acknowledgements
We would like to thank the field team that collected the data over several months.
Disclosure statement
No potential conflict of interest was reported by the author(s).
Data availability statement
Data files will be stored on Dryad with associated doi.
Additional information
Funding
References
- Lesiv M, Schepaschenko D, Buchhorn M, et al. Global forest management data for 2015 at a 100 m resolution. Sci Data. 2022;9(1):199. doi: 10.1038/s41597-022-01332-3.
- Blaser J. Status of tropical forest management. Yokohama, Japan: International Tropical Timber Organization; 2011.
- FAO. Global forest resources assessment 2020: country Reports. [Internet]. FAO. Available from: https://connect.fsc.org/document-centre/documents/retrieve/4103bb78-8c0b-45e8-8e18-4a4366a5a859?mode=view#viewer.action=download.
- Edwards DP, Tobias JA, Sheil D, et al. Maintaining ecosystem function and services in logged tropical forests. Trends Ecol Evol. 2014;29(9):511–520. doi: 10.1016/j.tree.2014.07.003.
- Malhi Y, Riutta T, Wearn OR, et al. Logged tropical forests have amplified and diverse ecosystem energetics. Nature. 2022;612(7941):707–713. doi: 10.1038/s41586-022-05523-1.
- Putz FE, Pinard MA. Reduced-impact logging as a carbon-offset method. Conserv Biol. 1993;7(4):755–757. doi: 10.1046/j.1523-1739.1993.7407551.x.
- Zuidema PA, Zwerts JA. An energetic look at the life in logged forests. Nature. 2022;612(7941):636–637. doi: 10.1038/d41586-022-04356-2.
- Ellis EA, Montero SA, Hernández Gómez IU, et al. Reduced-impact logging practices reduce forest disturbance and carbon emissions in community managed forests on the Yucatán Peninsula, Mexico. For Ecol Manage. 2019;437:396–410. doi: 10.1016/j.foreco.2019.01.040.
- Pearson TRH, Brown S, Murray L, et al. Greenhouse gas emissions from tropical forest degradation: an underestimated source. Carbon Balance Manag. 2017;12(1):3. doi: 10.1186/s13021-017-0072-2.
- Griscom BW, Busch J, Cook-Patton SC, et al. National mitigation potential from natural climate solutions in the tropics. Philos Trans R Soc Lond B Biol Sci. 2020;375(1794):20190126. doi: 10.1098/rstb.2019.0126.
- Bicknell JE, Struebig MJ, Edwards DP, et al. Improved timber harvest techniques maintain biodiversity in tropical forests. Curr Biol. 2014;24(23):R1119–R1120. doi: 10.1016/j.cub.2014.10.067.
- West TAP, Vidal E, Putz FE. Forest biomass recovery after conventional and reduced-impact logging in Amazonian Brazil. For Ecol Manage. 2014;314:59–63. doi: 10.1016/j.foreco.2013.11.022.
- Enters T. Asia-Pacific Forestry Commission. Trash or treasure? Logging and mill residues in Asia and the Pacific. Bangkok: Food and Agriculture Organization of the United Nations Regional Office for Asia and the Pacific; 2001.
- Daigneault A, Baker JS, Guo J, et al. How the future of the global forest sink depends on timber demand, forest management, and carbon policies. Glob Environ Change. 2022;76:1–13. doi: 10.1016/j.gloenvcha.2022.102582.
- Hertwich EG. Increased carbon footprint of materials production driven by rise in investments. Nat Geosci. 2021;14(3):151–155. doi: 10.1038/s41561-021-00690-8.
- Mishra A, Humpenöder F, Churkina G, et al. Land use change and carbon emissions of a transformation to timber cities. Nat Commun. 2022;13(1):4889. doi: 10.1038/s41467-022-32244-w.
- Government of Guyana. The Iwokrama International Centre for Rainforest Conservation and Development Act [Internet]. Available from: https://mola.gov.gy/sites/default/files/Cap.%2020.04%20Iwokrama.pdf.
- Griscom B, Ellis P, Putz FE. Carbon emissions performance of commercial logging in East Kalimantan, Indonesia. Glob Chang Biol. 2014;20(3):923–937. doi: 10.1111/gcb.12386.
- Zalman J, Ellis PW, Crabbe S, et al. Opportunities for carbon emissions reduction from selective logging in Suriname. For Ecol Manage. 2019;439:9–17. doi: 10.1016/j.foreco.2019.02.026.
- Pearson TRH, Brown S, Casarim FM. Carbon emissions from tropical forest degradation caused by logging. Environ Res Lett. 2014;9(3):034017. doi: 10.1088/1748-9326/9/3/034017.
- Chave J, Réjou-Méchain M, Búrquez A, et al. Improved allometric models to estimate the aboveground biomass of tropical trees. Glob Chang Biol. 2014;20(10):3177–3190. doi: 10.1111/gcb.12629.
- Réjou-Méchain M, Tanguy A, Piponiot C, et al. BIOMASS : an R package for estimating above-ground biomass and its uncertainty in tropical forests. Methods Ecol Evol. 2017;8(9):1163–1167. doi: 10.1111/2041-210X.12753.
- Mokany K, Raison RJ, Prokushkin AS. Critical analysis of root : shoot ratios in terrestrial biomes. Global Change Biol. 2006;12(1):84–96. doi: 10.1111/j.1365-2486.2005.001043.x.
- IPCC. IPCC Guidelines for National Greenhouse Gas Inventories: chapter 4: forest Land; 2006 [Internet]. Available from: https://www.ipcc-nggip.iges.or.jp/public/2006gl/pdf/4_Volume4/V4_04_Ch4_Forest_Land.pdf.
- Feldpausch TR, Jirka S, Passos CAM, et al. When big trees fall: damage and carbon export by reduced impact logging in southern Amazonia. For Ecol Manage. 2005;219(2-3):199–215. doi: 10.1016/j.foreco.2005.09.003.
- Johnson MO, Galbraith D, Gloor M, et al. Variation in stem mortality rates determines patterns of above-ground biomass in Amazonian forests: implications for dynamic global vegetation models. Glob Chang Biol. 2016;22(12):3996–4013. doi: 10.1111/gcb.13315.
- Van der Hout P. Code of practice for forest operations for timber sales agreement and wood cutting license holders; 2014.
- FSC FSC. Certification of Tropical Forests [Internet]. FSC International; 2019. Available from: https://ic.fsc.org/en/news-updates/events/event-details/fsc-involvement-in-rio20/certification-of-tropical-forests.
- Villalobos L, Coria J, Nordén A. Has forest certification reduced forest degradation in Sweden? Land Econ. 2018;94(2):220–238. doi: 10.3368/le.94.2.220.
- Romero C, Putz FE. Theory-of-change development for the evaluation of forest Stewardship Council Certification of Sustained Timber Yields from Natural Forests in Indonesia. Forests. 2018;9(9):547. doi: 10.3390/f9090547.
- Mendes A, Macqueen D. Raising forest revenues and employment Unlocking the potential of small and medium forest enterprises in Guyana [Internet]. International Institute for Environment and Development, Edinburgh, UK. Available from: https://www.researchgate.net/publication/228389634_Raising_forest_revenues_and_employment_unlocking_the_potential_of_small_and_medium_forest_enterprises_in_Guyana_IIED_Small_and_Medium_Forest_Enterprise.
- da Silva Luz E, Soares ÁAV, Goulart SL, et al. Challenges of the lumber production in the Amazon region: relation between sustainability of sawmills, process yield and logs quality. Environ Dev Sustain. 2021;23(4):4924–4948. doi: 10.1007/s10668-020-00797-9.
- Owusu F, Damnyag J, Blay D. Comparative analysis of recovery efficiencies of some milling techniques in Ghana. Ghana Journal of Forestry. 2011;27:87–100.
- Guyana Forestry Commission. Guyana Forestry Commission. $900M revolving fund to support forestry sector- President Ali announces; 2022 [Internet]. Available from: https://forestry.gov.gy/2022/10/29/900m-revolving-fund-to-support-forestry-sector-president-ali-announces/.