
 ?Mathematical formulae have been encoded as MathML and are displayed in this HTML version using MathJax in order to improve their display. Uncheck the box to turn MathJax off. This feature requires Javascript. Click on a formula to zoom.
ABSTRACT
The key idea in this paper is to propose multi-labels classification algorithms to handle benchmark thermal datasets that are practically associated with different data characteristics and have only one health condition (damaged composite materials). A suggested alternative approach for extracting the statistical contents from the thermal images, is also employed. This approach offers comparable advantages for classifying multi-labelled datasets over more complex methods. Overall scored accuracy of different methods utilised in this approach showed that Random Forest algorithm has a clear higher performance over the others. This investigation is very unique as there has been no similar work published so far. Finally, the results demonstrated in this work provide a new perspective on the inspection of composite materials using Infrared Pulsed Thermography.
1. Introduction
Inspection of composite materials (CMs) using Infrared Pulsed Thermography (IPT) techniques is currently receiving considerable attention in several industrial applications. There are many studies in the scientific and commercial communities tried to improve the inspection and/or classification of composite materials using thermal datasets. Over the past decades, research typically only investigated the feasibility of binary and/or multiclass machine learning (ML) algorithms to analyse the thermal images that were considered to be associated with only one preferable class/label (class of analyst’s choice) such as health conditions for composite materials samples (e.g. healthy or damaged composite materials). However, it is not always possible to apply these algorithms as in practice the carrying information by the recorded thermal images is indeed associated with a set of labels instead of only one. Yet, the acquired datasets may come from the field with only one known health condition. It is also well-known that the analysed images are firstly converted into big sized arrays for further image processing. To accelerate the analysis, authors of previous published work reduced the high dimensionality of the resulting arrays. This eventually leads to lose some of carrying information. Another issue is that the resulting thermal arrays in most cases will be of the same energy strengths (Pixels) and therefore significantly low classification accuracy may be obtained. It is for this reason the key idea in this paper is to propose multi-labels classification algorithms to handle benchmark thermal datasets that are practically associated with different data characteristics and have only one health condition (damaged composite materials). A suggested alternative approach for extracting the statistical contents from the thermal images, is also employed. This approach offers comparable advantages for classifying multi-labelled datasets over more complex methods. Overall scored accuracy of different methods utilised in this approach showed that Random Forest algorithm has a clear higher performance over the others. This investigation is very unique as there have been no similar work published so far to the best of the authors’ knowledge.
Often, test engineers want to regularly inspect how composite materials will function after sometimes of operating accumulation. However, monitoring the lifespan of composites is not an efficient use of time, especially for composites that are meant to last for decades. Instead, engineers use accelerated tests to simulate damages in composites. Accelerated thermography tests are useful for predicting the life expectancy of composites, anticipating potential failures and discriminating ‘good/healthy’ composites from ‘bad/damaged’ ones. There are several methods of accelerating thermography tests using recorded thermal data (images). One of the most well-known tests in engineering applications is the Pulsed Thermography (PT) test. In general, there are two types of thermographic methods for the inspection of the composites. The first type is the active method, where the thermal gradient is continuously produced/maintained using, for instance, cyclic stress. In the second type, passive method, the thermal gradient is produced from the transient changes [Citation1].
The inspection of composite materials using IRT has been of interest for a considerable period. For instance, Andrzej et al. [Citation2] undertook an investigation for the damage identification in aircraft composite structures. Authors employed Piezoelectric Transducers (PZT) sensing, Ultrasonic, and PI for monitoring aircraft elements in varying environmental conditions. The detection of defects using the Infrared Thermography (IRT) was also investigated by Péronnet et al. [Citation3]. In this investigation, three infrared thermographic techniques; IRT, Lock-in IRT and Pulse IRT, were applied to different types of composites that are used in aviation industry. Montanini [Citation4] also used lock-in and pulse phase infrared thermography to quantify subsurface defects in a reference specimen that was made out of Plexiglas. Thermal images recorded at different frequencies (frequency domain) were post-processed and direct measurement of material’s thermal diffusivity was undertaken. Comparative results investigation between IRT and Electronic Speckle Pattern Interferometry (ESPI) for the NDT&E of Aircraft composites was undertaken by Findeis et.al [Citation5]. Castanedo et al. [Citation6] carried out another comparative study for the inspection of aerospace materials using pulsed thermography, lock-in thermography and vibrothermography. Pulsed thermography method was also employed by Bendada et al. [Citation7] for the evaluation of aircraft composites. Hung et al. [Citation8] presented a review and comparison investigation between shearography and active thermography for non-destructive and evaluation applications.
Acquired data from thermography tests are very often modulated due to the high contribution of the noise sources. External reflections, variations in the optical properties of the specimen and non-uniform heating are considered as main contributory noise sources. However, several signal processing methods were developed to handle this issue, and hence capability of detection and quantifying different damages could eventually be enhanced [Citation9,Citation10]. Vavilov et al. [Citation11] provided a thorough review for the signal processing techniques widely employed for IRT data analysis. Feasibility of Gapped Smoothing Algorithm (GSA) for damage detection was investigated by Li et al. [Citation12]. For the detection of disbonds in an insulation, made out of low-density rubber, in solid rocket motors, Guo et al. [Citation13] employed Pulsed Thermography (PT) method. Lopez et al. [Citation14] optimised the processing of PT data acquired from composite fibre reinforced polymers (CFRP), with several simulated defects, using the Partial Least Square Thermography (PLST) method. To quantify the material damages in carbon fibre reinforced polymers (CFRP) under impact, Chang el al. [Citation15] used the Multi-Dimensional Ensemble Empirical Decomposition (MEEMD) algorithm. Also, for CFRP subjected to impact test, the Coefficient Clustering Analysis (CSA) method integrated with PT was applied [Citation16]. Initiation and propagation of fatigues were monitored using Pulsed Phase Thermography (PPT) method. Grammatikos et al. [Citation17] undertook an analysis for the durability and efficiency of the patch repair for an aluminium wing structure with CFRP composite patches using LIT method.
For better image contrast, and accordingly improved damage identification, Thermographic Signal Reconstruction (TSR) was applied to Step Heating (SHT) and Long Pulse Thermography (LPT) for damage inspections in aluminium and composite samples with flat bottom holes of different dimensions and depth [Citation18]. Arora et al. [Citation19] employed Frequency Modulated Thermography (FMT) method (time domain and frequency domain representations) to analyse an acquired data from CFRP samples with flat bottom holes. Sub-surface artificial defects in composite sandwich panels (commonly used materials in aircraft applications) could be identified using Laser-Line Thermography (LLT) [Citation20,Citation21]. Feasibility of Laser-Spot Thermography (LST), Laser-Line Thermography (LLT) and Ultrasonic Stimulated Thermography (UST) for inspections of composite materials, employed in aircraft industry, such as metallic turbine blades, aluminium samples, CFRP composites etc., to name few, was also assessed in several investigations [Citation22–26].
Sakagami et al. [Citation27] performed an experimental work using two different Direct Material-Based Thermography (DMT) approaches. The first approach is called Singular Method and it is basically dependent on the increase of electrical current density near the tip of cracked regions to generate the required heat on electrically conductive materials under examination. Internal health integrity of carbon fibres in CFRP composites has also been investigated using what-so-called Electrical Resistance Change Method (ERCM) and thermography [Citation28–30]. ERCM has been integrated with thermography by Suzuki et al. [Citation31,Citation32] for the inspections of defects in two outermost layers of a composite laminate, aerospace composites, that were subjected to an electrical voltage. Another combination of thermography and ERCM was made by Grammatikos et al. [Citation33] to undertake a comparative investigation between the available optical thermography techniques for aero-structures applications.
An up-to-date overview of methods used for Inductive thermography to detect surface cracks in metals are also presented in the literature. Detection and characterisation of short fatigue cracks in ferromagnetic and austenitic steel using inductive thermography was investigated by Oswald-Tranta [Citation34]. Influence of subsurface crack shape, crack depth, crack length and inclination angle on the recorded thermal images was analysed. Liu et al. [Citation35] proposed a factor analysis thermography (FAT) method to extract defect features from large number of thermal images. Authors postulated that the defect information was automatically extracted from thermograms via exploratory factor analysis using a fuzzy c-means (FCM) clustering algorithm for segmenting the defects and background. It was concluded that experiments on a panel painting that the proposed method could show a good accuracy and efficiency of thermographic in detection of defects. Kim et al. [Citation36] developed a method for the classification of thermal defects into material-related thermal bridges, bridges, air leakages, geometrical thermal and other thermal defects using thermal and visible images. To investigate the feasibility of the proposed method, a building with different thermal defects was thoroughly studied. A conclusion was reached by the authors that the proposed method could show a good potential for automatically classification of thermal defects in buildings.
ML algorithms were also employed to improve the feasibility of IRT for the inspection of composites. Example of this was the research work undertaken by Saeed et al. [Citation37]. Artificial Neural Network (NN) was integrated with a line-scan thermography to detect different defects depth. This configuration was applied to specifically designed CFRP coupons with embedded and flat bottom holes’ defects. The artificial neural network algorithm was also combined with what so called Pulsed Thermal Ellipsometry (PTE) to investigate the fibre orientation on laminates reinforced with randomly-oriented strands [Citation22]. Different CFRP samples were experimented using two thermography heating approaches. Another multilayer Neural Network (NN) algorithm was selected to online predict different defect depths on carbon fibre samples [Citation38]. The NN was linked line scan thermography setup to continuously transverse a controlled heater in tandem with a thermal detector in a linear x-y-z stage. To implement the proposed inspection method datasets were simulated using a multiphysics. This simulated data was employed to train the proposed NN model which eventually was validated using the analysis of experimental datasets.
Numerous initiatives to develop classification techniques for composites using thermal images were reported but most of the used classification algorithms could deal with thermal datasets, which have a set of input features and only one output class. However, in reality the problem might be different from a typical binary or multiclass classification, as often a thermal dataset and/or a thermal image can be associated with multiple categories rather than a single category. Often, a recorded thermal image from a given composite needs to be tagged to multiple labels/categories such as material type, geometry, sampling rate, recording direction, and so on, to name a few. Classification of massive number of thermal images belonging to multiple categories remains a challenging area for employing automated solutions. There are no publications, off the shelf, that explore the feasibility of multi-labels classification for thermal datasets. Although this issue is well known, it has unfortunately not received a significant attention yet. Thus, these challenges warrant ongoing research efforts in this field. This indeed motivated the authors to undertake the presented work, where classifying of multi-labelled thermal images related to different types of composite materials was profoundly investigated. Unlike the previous work, signs of the technical contribution of this work to the existing body of knowledge can include:
How to ‘scientifically’ and objectively process and analyse large amount of thermal data recorded from composite materials samples using several quantitative and qualitative multi-label classification (MLC) techniques.
The first known attempt at the extraction of statistical features from thermal images and use these features as an alternative option for training and testing MLC algorithms to classify different types of composite materials samples that are associated with multi-label set.
The first known attempt at the use of MLC for the inspection of composite materials.
The classification techniques applied here are rather new to the area of monitoring composite materials samples that are under IPT testing.
2. Data measurements and data processing
The specific details of the measurement procedure have been reported previously in [Citation39,Citation40]. The pulsed thermography experiments were undertaken to record the evolution of temperature over time on the surface of composite materials under testing. The thermal images were recorded using X6900 FLIR infrared camera with an InSb-CCD Matrix Sensor and image resolution of 640 × 512 pixels. Specifications of the used infrared camera are presented in . Two F×60 BALCAR photographic flashes, each with output energy of 6.2 KJ, were used to generate a heat flux for a duration of 2 ms. The output thermal light was exerted on the centre of all composite materials samples under testing. The infrared camera was facilitated with ResearchIR Max 4 software to record the thermal images at a resolution of 512 × 512 pixels. A control unit, connected to a data processing system was also employed to synchronise the acquiring of the data with the pulse generation (see . The distance between the thermal camera and the sample under testing was approximately 100 cm and the angle between the camera lenses and the sample surface was 90°. The two thermal flashes were placed 50 cm apart from the sample under testing with an angle of 45° to the sample surface.
Figure 1. Schematic diagram for the thermography test.
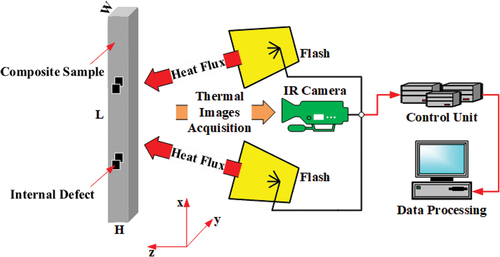
Table 1. Specifications of the used infrared camera [Citation39,Citation40].
Prior testing, predefined artificial damage was first introduced to composite materials samples made out of Carbon Fibre-Reinforced Plastic (CFRP) and Glass Fibre-Reinforced Plastic (GFRP) with thermal conductivity of 1600 W/m.K, 0.8 kg/m3 density and 1200 W.s/kg.K heat capacity. Each plate contains 25 square internal defects (Teflon inserts) of the same thickness with different area and depth (length/depth ratios between 1.7 and 75). It should, however, be noted that three different geometries (planar, curved and trapezoidal) of the same dimensions (300 mm x 300 mm x 2 mm) from every CFRP and GFRP sample were tested. IPT technique was then employed to record 24,000 thermal images over a set of 12 experiments that were undertaken using different CM sample each time (each test contains a dataset of 2000 thermal images). For each test, the resulting thermal evolution due to the heating and cooling of the sample surface was recorded for a total time period of 16–17 seconds. Yet, the IPT was applied to the front and back surfaces of each geometry. A frames sample rate of 120 Hz was set for the back-surface tests, while 145 Hz was employed to undertake the front-surface experiments. The experimental work was carried out at constant operating conditions of an ambient temperature of 21°C, an emissivity 0.9 and a wind speed of 0 m/s.
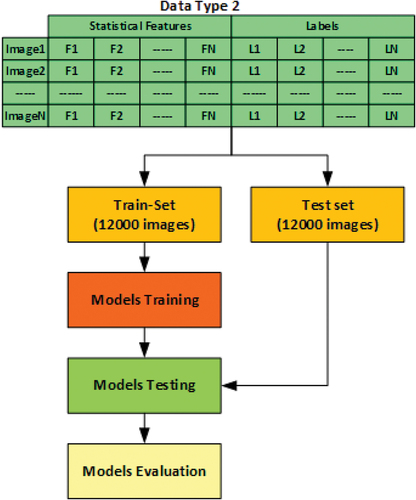
An important component of this research, is the processing of the collected data. To ease the analysis, the recorded thermal images were converted into numerical matrices (each image has a matrix with a size of 512 × 512). These matrices were also subjected to additional processing to search for any missing data. Two data formats have been proposed in this investigation for feeding the multi-label classification models. In the first format (conventional method), the producing matrices were directly tagged one by one to 11 predefined labels, presented in , and then were employed for training and testing the classification algorithms. The second data type (new proposed method) instead allows for more detailed analysis of some aspects of the images. In this type, the data was further analysed on an image by image basis. Instead of the use of image pixels, 26 statistical features (features from time (t) domain and frequency (f) domain) were extracted from each image and then were associated with the same labels in .
Table 2. Labels associated with each thermal image.
Unlike the first data type, this approach allowed a larger number of analysis to be run in much less time and high resulting accuracy, evidence of this will be shown later in the paper. It is worth to mention that the extracted features have quantitatively been estimated from the 2D images described in the following equations. provides the definition for the mathematical notations in equations 1–13. The steps described how the two types of data were extracted from the recorded images are depicted below in
Figure 2. Data types used for the multi-label classification.
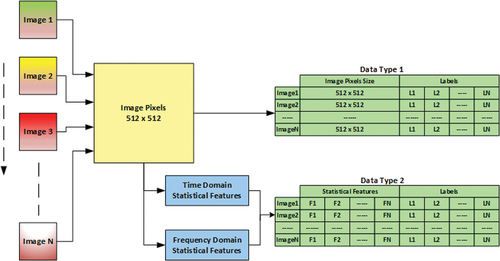
Table 3. Mathematical notations used in the above equations.
Features selection is an important aspect for every data scientist as it helps to build efficient predictive machine learning models that are free from correlated variables, biases and unwanted noise. Real-world datasets very commonly have some noisy features that have to be omitted to reduce the computational time, misprediction rate and accommodate the available memory space. Prior to the classification of the images, Pearson Correlation Coefficient (PCC) method was applied to test the correlation amongst the extracted statistical features. A statistical PCC value of (+1) indicates a 100% positive linear correlation between the features, whereas a value of (−1) means a negative linear correlation is present. If the PCC has a value of zero the variables are considered to have no linear correlation. From the assessment of correlation analyses, it is notable that a close correlation exists between some of the extracted features. A graphical description of the resulting correlation analysis is presented in However, depending only on the resulting intercorrelations for finding the best features to use in the MLC models is not enough as a random selection of some features and discard the rest variables will result in losing very important information. Hence, it was thought to carry out a further analysis to evaluate the importance of the extracted features for the classification tests. This approach will not only give an insight on the features with high weightage but also the features, which may be slowing down the classification models. The investigation was undertaken using BORUTA selection algorithm, which works as a wrapper algorithm around the well-known Random Forest method [Citation41]. Boruta model has performed 12 iterations for the extracted features from the 24,000 image frames. indicates the answer of BORUTA on the importance of features, where it can be seen that all 26 attributes are confirmed to be important features (no attributes deemed to be unimportant/rejected or tentative). The feature importance (variable importance) was also computed to describe/select which of the extracted features are more relevant for feeding the prediction algorithms. Plot of feature importance is presented in , where it can be seen that the importance of the features is ranging from 10% to 75%. Based on the results from the BORUTA analysis and the computation of the features importance, it was thought that it is more appropriate to include all features in the classification tests.
Figure 3. Correlation matrix.
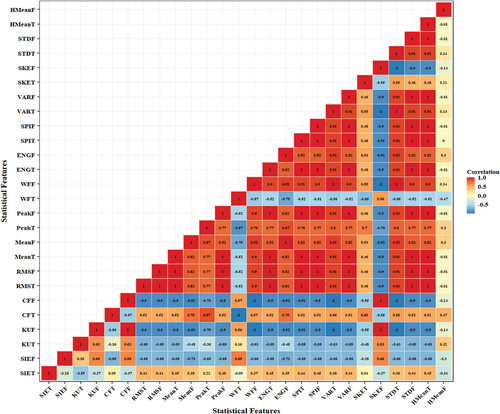
Figure 4. Features importance.
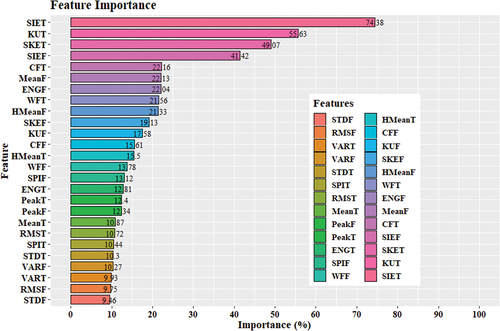
Table 4. BORUTA results for feature selection process.
3. Multi-label classification models
Unlike binary or multiclass classification problems, multi-label classification is a classification problem, where each instance is associated with multiple target labels instead of only one. In other words, the task in this type is to predict the label-sets of unseen instances, instead of a single label. For multi-label classification, what so called problem transformation method and algorithm adaptation method are used. In the first approach, classification algorithms attempt to convert the original multi-labelled data into binary or multiclass format. The resulting predictions are then combined to form the output label-sets. In algorithm adaptation type, multiclass models such as Random Forest (RF) algorithm, which has been proposed for this investigation, are first modified to suit the nature of the multi-labelled data and are then applied directly to the problem [Citation42, Citation43]. RF is a supervised ensemble of decision trees technique that uses a bagging method to construct a large number of relatively uncorrelated tress during the training process for the final prediction. The advantage of having many uncorrelated models is that the trees will protect each other from their individual errors. This structure, in turn, improves the accuracy and stability of the model by reducing the variance without increasing the bias and/or the noise. Each tree model is made up of a series of nodes and branches and splits the data at the root into subsets based on different features. At the end of the process, each individual tree will provide its prediction and classes with the most votes will represent the model prediction. It is worth pointing out that RF can also be used to identify the most significant variables in a given dataset from many input features.
Binary Relevance, and Chains algorithms are used for the problem transformation method. They map the multi-label data into a binary problem for each label. Binary Relevance decomposes the multi-label task into several independent binary classification tasks. Each label will use only one independent learning task to contribute to the final multi-label prediction and the overall prediction is determined by combining the prediction results from all independent binary learners. In this way, the labels are predicted independently of each other and no label dependencies are considered. To overcome the label correlation issue in Binary Relevance algorithm, due to the independency of the labels, labels are considered to be as one chain structure when the Chains method is applied. This will allow for a direct sharing of prediction between the learners. [Citation44–46].
The overall classification performance of these methods can be evaluated using several model evaluation metrics such as the accuracy, area under curve, F1-score, mean misclassification error, and so on, to name a few. lists the evaluation indicators used in this work to assess the high and low performance of the proposed classification algorithms. ROC curve (receiver operating characteristic curve) is another diagnostic tool used in this work to chart the performance of the proposed classification models for each data label. This graph shows the trend of two performance parameters (True Positive Rate and False Positive Rate) at different classification thresholds. The points in the ROC curve are computed using the area under curve (AUC) algorithm. AUC is a sorting-based algorithm that measures the entire 2D area from (0,0) to (1,1) for each data label under the ROC curve. AUC value of 0.0 indicates 100% wrong predictions by the model, while a model with 100% correct predictions has an AUC value of 1.0 [Citation46, Citation47,Citation48].
Table 5. Evaluation metrics.
4. Machine learning classification results
The whole dataset (24000 thermal images) was randomly split into two subsets. Fifty percent (50%) of the data (12000 thermal images) was employed for training the classification models, whereas the remaining 50% was devoted to the final test of the proposed models. It should be telling that, two approaches of data classification using the above-mentioned classification algorithms are undertaken in this investigation (see , and 5b). A comparative results investigation between multi-label classification of the thermal images based on the image pixels (data type 1) and multi-label classification based on the image statistical contents/features (data type 2) is presented.
Figure 5a. Multi-label classification approaches for image pixels dataset.
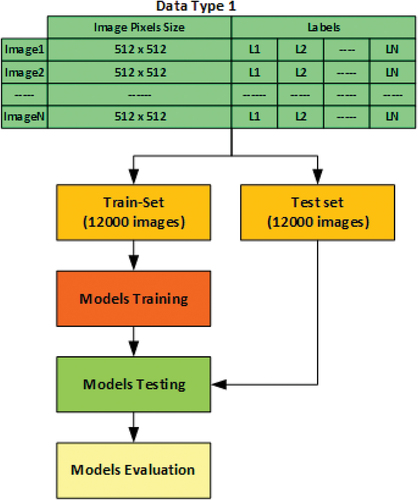
Figure 5b. Multi-label classification approaches for statistical features dataset.
Algorithm adaptation method was applied to the two types of data (image pixels dataset and statistical features dataset) using RF algorithm with 500 trees and 80 variables that are randomly sampled as candidates at each split. Results for the evaluation of the classification performance are presented in three different formats in . Most important components of high and low performance metrics for each label are highlighted in , while provide an overview of the scattered trend of these measures corresponding to each label. The last two exhibit the results from ROC curve, which provide the diagnostic ability of the classifier against each label. Observations from these figures show that the overall performance of RF method showed a high adequacy of handling multi-label data and could classify the test-sets at very high accuracy. However, the results demonstrate the potential superiority of processing data based on the statistical features over established methods (classification based on image pixels).
Figure 6. Evaluation metrics for RF model (image pixels dataset).
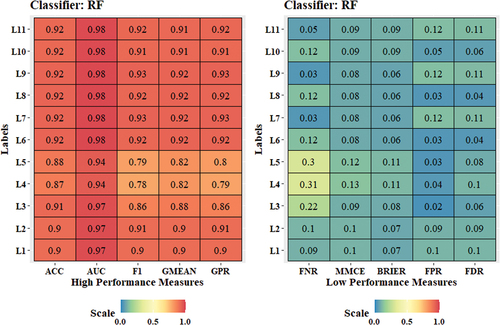
Figure 7. Evaluation metrics for RF model (statistical features dataset).
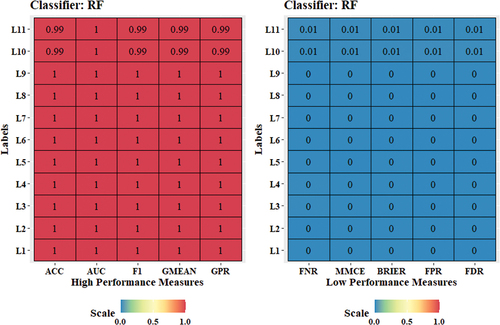
Figure 8. Trend of evaluation metrics for RF model (image pixels dataset).
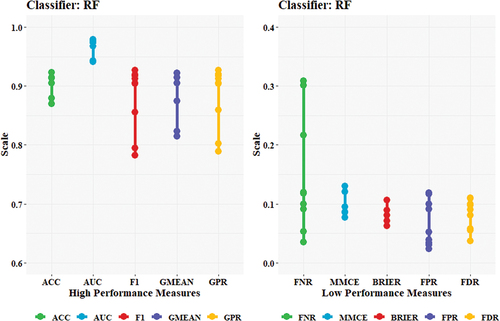
Figure 9. Trend of evaluation metrics for RF model (statistical features dataset).
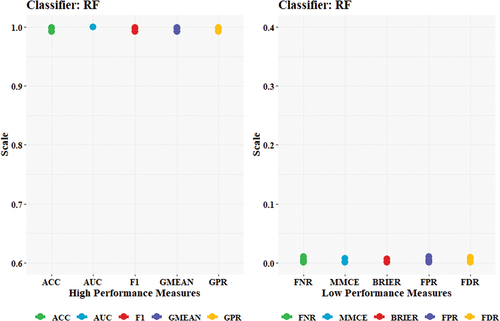
Figure 10. ROC curve for RF model (image pixels dataset).
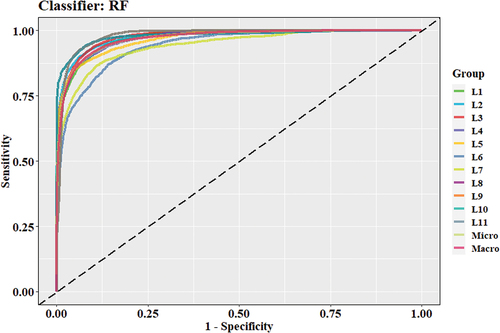
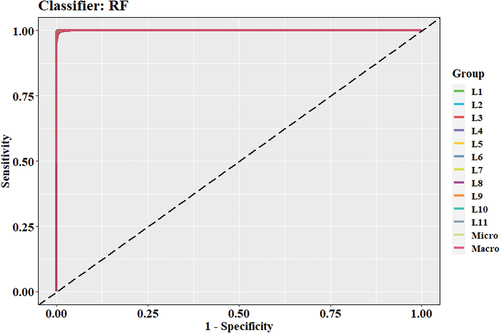
Figure 11. ROC curve for RF model (statistical features dataset).
Unlike the dataset from image pixels, it was found that such an approach (use of statistical features dataset for multi-label classification) produce high quality results in the evaluation metrics. For instance, results from high performance metrics show that RF yielded the highest value of 1.0 for all data labels and a value closer to zero for the low performance metrics; thus, high classification accuracy of ⁓100% for each label could be achieved (see ).
Closer examination reveals that the results are relatively in contrast with the findings from the analysis of image pixels dataset; slightly lower values of accuracy measures can be observed from . Yet, compared with the ROC curves in , marked ROC curves (AUC for each label is almost reaching a value of ⁓1.0), the results from the RF algorithm are evidently much better than those observed from (results from image pixels dataset). It is also important to note that the approach of analysing the statistical features dataset could reduce the computation time for training the models from (⁓5 minutes for the image pixels dataset) to (⁓15 seconds for statistical features dataset).
For the comparison of the multi-label classification feasibility between the algorithm adaptation method and problem transformation method, classification experiments were also conducted using Binary Relevance (BR), and Chains classifiers. Likewise, all data types were entered into BR, and Chains algorithms. None of the two methods exhibited what would be considered as a good classification performance for the image pixels dataset. Based on the observations from , the quality of results achieved from the analysis of this data type is far inferior to that obtained by RF method; both techniques visibly produced poor metrics’ values (see .
Figure 12. Evaluation metrics for BR model (image pixels dataset).
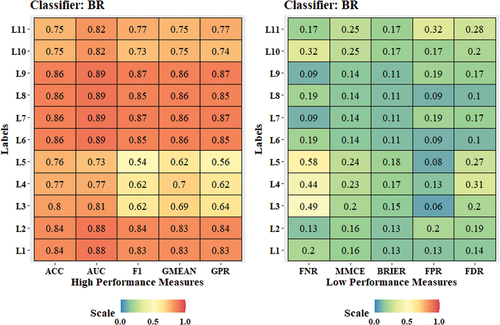
Figure 13. Evaluation metrics for Chains model (image pixels dataset).
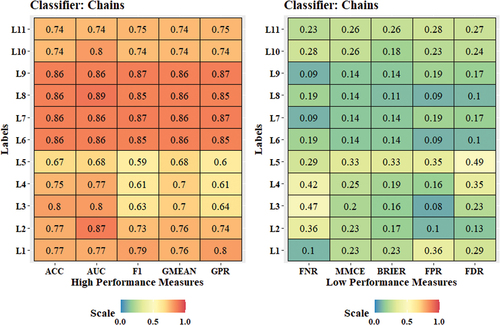
Figure 14. Trend of evaluation metrics for BR model (image pixels dataset).
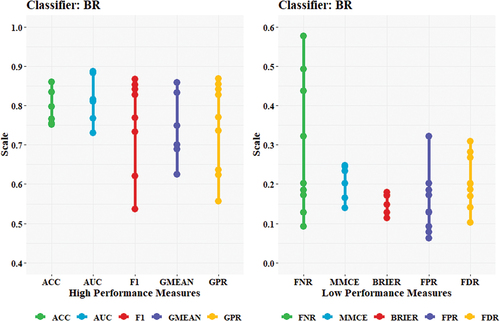
Figure 15. Trend of evaluation metrics for Chains model (image pixels dataset).
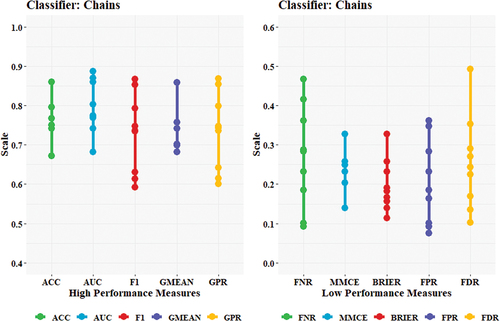
Figure 16. ROC curve for BR model (image pixels dataset).
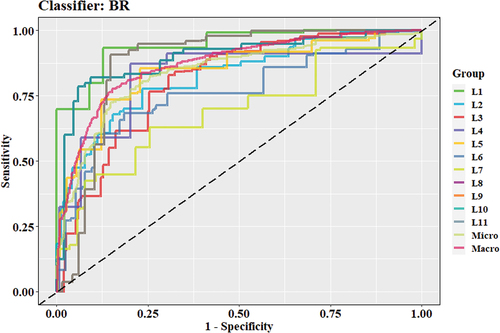
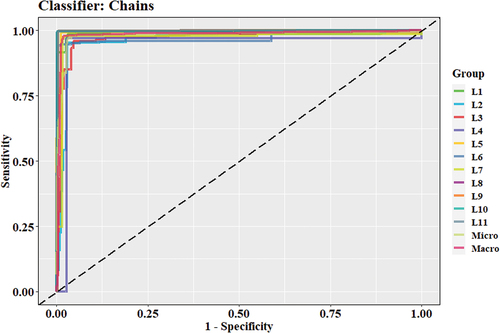
Figure 17. ROC curve for Chains model (image pixels dataset).
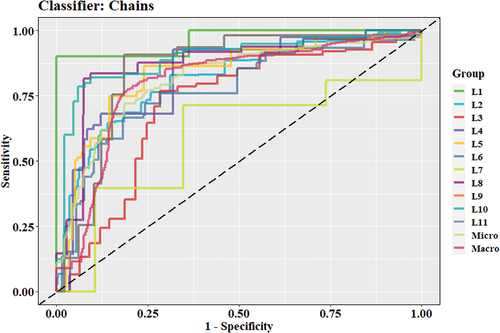
Also, observations from ROC curves, presented in , where the trade-off between the sensitivity and (1 – specificity) for the used classifiers is displayed, show that both algorithms largely failed in classifying some of data labels; the results were comparatively very poor with regard to the levels observed in . Different to the RF (ROC curves are very closer to the top-left corner; indication of a high classification performance), Binary Relevance and Chains classifiers have given a bunch of curves corresponding to the data labels lying very close to the diagonal line (Sensitivity = (1 – specificity)); the closer the curve to the 45-degree diagonal line, the less predictive accurate.
Figure 18. Evaluation metrics for BR model (statistical features dataset).
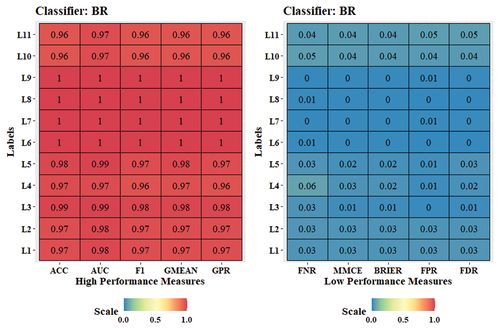
It should be noted, however, that the application of the statistical features dataset has on the other hand resulted in significant visible improvements in the classification accuracy. This can obviously be observed from , where the findings are in line with what has been found previously by RF model (algorithm adaptation method). Overall, the prediction metrics for Chains model such as F1-score showed a significant increase ranged from 0.59 for L5 using the image pixels dataset to 0.97 for the same label when the statistical features dataset is used (an increase average of 65% was calculated) (see .
Figure 19. Evaluation metrics for Chains model (statistical features dataset).
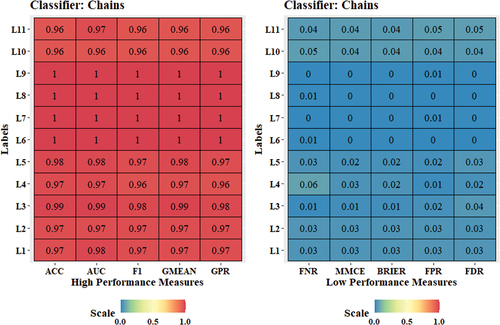
Figure 20. Trend of evaluation metrics for BR model (statistical features dataset).
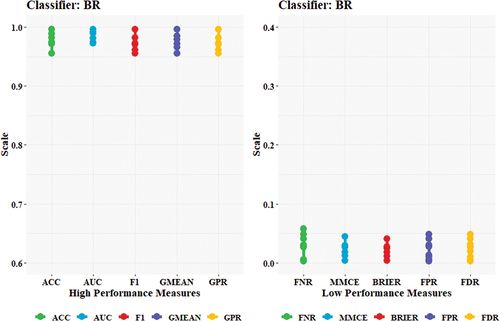
Figure 21. Trend of evaluation metrics for Chains model (statistical features dataset).
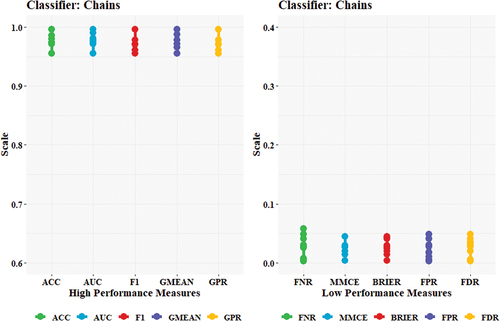
Figure 22. ROC curve for BR model (statistical features dataset).
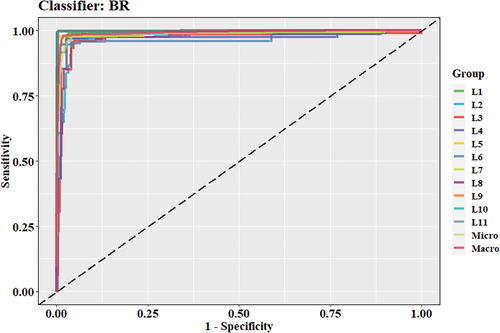
Figure 23. ROC curve for Chains model (statistical features dataset).
This increase has also been found to be more obvious using BR model for the same label L5, where a larger increase average of 80% was observed, shown in . Observations from these figures show also that this steadily increase in the prediction performance was then followed by a large decrease in the low performance metrics. The improved prediction accuracy could lead to key changes in the location of the resulting ROC curves. In consistency with the previous observations, a steep upward location for each ROC curve close the left top corner of the plot was observed; thus, leading to substantial climb in AUC values, presented in .
5. Discussion and conclusions
This work aims to develop a framework to investigate the feasibility of multi-label classification (MLC) models for the inspection of composite materials. Despite the wealth of literature available in the field, the study is unique as it is the first application of MLC models to simultaneous predict multiple factors associated with thermal images recorded from composite materials. No experimental results proving this method have, as yet, been presented. This type of monitoring for these multiple-factors/labels is very important in the real-world applications, where diagnosis of composite materials may have multiple concurrent complications. With this aim in mind, in this work data from 24,000 thermal images recorded from different geometric composite materials samples with different conditions over 12 experimental tests using IPT technique were employed to build up MLC models. The data was first cleaned and pre-processed to extract the carrying information into two different dataset approaches that have eventually been used to feed the proposed MLC models. The first approach involved the direct use of image pixels as the independent observations of the data, while the second approach employed the statistical features that were extracted from the thermal images using different statistical indicators (new method). Each thermal image was associated with multiple labels/factors that are directly associated with the health conditions, material type, and/or experimental setup. Selection of features was also performed using correlation analysis and BORUTA algorithm to investigate any missing values, inconsistent features, duplication, outliers, noisy features and eventually help to calculate the importance of each feature in the data. Different MLC classifiers were applied to the pre-processed dataset and several evaluation measures have primarily been determined to assess the overall multi-label predictive performance. This study leads to some useful conclusions, most important of which:
The results demonstrated in this work provide a new perspective on the inspection of composite materials using IPT technique.
The skewed distribution of multiple labels per image, along with the same number of recorded images (frames) per test, makes the analysed dataset a good inclusive benchmark.
The use of BORUTA algorithm significantly alleviated the selection of important feature in data and marked the dataset with 26 descriptive characteristics as confirmed (best fit data).
The evaluation results confirm that the proposed methods could produce a high predictive performance. The results suggest that the used approaches such as algorithm adaptation method (RF MLC model) and statistical features dataset are very promising alternative for classifying thermal images recorded from composite materials.
In all cases when the statistical features dataset was used, the computational time was markedly much lower than in those with image pixels dataset.
Proposed RF model obtains state of the art results outperforming the other MLC methods such as BR and Chains. RF model yielded the highest F1-score, GPR, and AUC close to 1.0 for all data labels in the resulting ROC curve and led in all the evaluation metrics. However, the use of statistical features dataset could evidently improve the classification accuracy for BR and Chains.
Although the experimental results further indicate that MLC models are efficient for classification of composite materials, this research can be considered as the first step towards more profound understanding of MLC for monitoring/classification composite materials conditions. The full potential of the proposed approaches for the other different types of data has not been proven yet, and hence further investigations are required to extend the capabilities of these approaches for the other types of composite materials. Also, incorporating new and/or improved prediction algorithms into the existing/proposed classification methods (another direction of research) may further lead to optimise the overall predictive performance of these techniques.
Disclosure statement
No potential conflict of interest was reported by the author(s).
References
- Ciampa F, Mahmoodi P, Pinto F, et al. Recent advances in active infrared thermography for non-destructive testing of aerospace components. Sensors. 2018;18(2):609.
- Katunin A, Dragan K, Dziendzikowski M. Damage identification in aircraft composite structures: a case study using various non-destructive testing techniques. Compos Struct. 2015;127:1–9.
- Péronnet E, Pastor M, Huillery R, et al., Non-destructive investigation of defects in composite structures by three infrared thermographic techniques. In 15thInternational Conference on Experimental Mechanics, Porto, Portugal. 2012.
- Montanini R. Quantitative determination of subsurface defects in a reference specimen made of Plexiglas by means of lock-in and pulse phase infrared thermography. Infrared Phys Technol. 2010;53(5):363–371.
- Findeis D, Gryzagoridis J, Lombe C. Comparing infrared thermography and ESPI for NDE of aircraft composites. Insight - Non-Destructive Test Condition Monit. 2010;52:5.
- Ibarra-Castanedo C, Genest M, Guibert S, et al. Inspection of aerospace materials by pulsed thermography, lock-in thermography, and vibrothermography: a comparative study. SPIE. 2007;6541:321–329.
- Bendada A, Erchiqui F, Lamontagne M. Pulsed thermography in the evaluation of an aircraft composite using 3D thermal quadrupoles and mathematical perturbations. Inverse Problems. 2005;21(3):857–877.
- Chen Y, Hung Y, Ng S, et al. Review and comparison of shearography and active thermography for nondestructive testing and evaluation (NdT&E). SPIE. 2009;7375:1139–1144.
- Zalameda J, Rajic N, Winfree W. A comparison of image processing algorithms for thermal nondestructive evaluation. SPIE. 2003;5073:374–385.
- Madruga FJ, Ibarra-Castanedo C, Conde OM, et al. Infrared thermography processing based on higher-order statistics. NDT & E Int. 2010;43(8):661–666.
- Vavilov VP, Burleigh DD. Review of pulsed thermal NDT: physical principles, theory and data processing. NDT & E Int. 2015;73:28–52.
- Li B, Ye L, Li E, et al. Gapped smoothing algorithm applied to defect identification using pulsed thermography. Case Stud NondestrTest Eval. 2015;30(2):171–195.
- Guo X, Vavilov V. Pulsed thermographic evaluation of disbonds in the insulation of solid rocket motors made of elastomers. Polymer Testing. 2015;45:31–40.
- Lopez F, Ibarra-Castanedo C, de Paulo Nicolau V, et al. Optimization of pulsed thermography inspection by partial least-squares regression. NDT & E Int. 2014;66:128–138.
- Chang Y-S, Yan Z, Wang K-H, et al. Non-destructive testing of CFRP using pulsed thermography and multi-dimensional ensemble empirical mode decomposition. J Taiwan Inst Chem Eng. 2016;61:54–63.
- Zhao Y, Tinsley L, Addepalli S, et al. A coefficient clustering analysis for damage assessment of composites based on pulsed thermographic inspection. NDT & E Int. 2016;83:59–67.
- Grammatikos SA, Kordatos EZ, Matikas TE, et al., Service and maintenance damage assessment of composite structures using various modes of infrared thermography. IOP Conference Series: Materials Science and Engineering; Bristol, UK. 2015;74:012006.
- Almond DP, Angioni SL, Pickering SG. Long pulse excitation thermographic non-destructive evaluation. NDT & E Int. 2017;87:7–14.
- Arora V, Siddiqui JA, Mulaveesala R, et al. Pulse compression approach to nonstationary infrared thermal wave imaging for nondestructive testing of carbon fiber reinforced polymers. IEEE Sens J. 2015;15(2):663–664.
- Ley O, Butera M, Godinez V. Inspection of composite structures using line scanning thermography. SPIE. 2012;8354:28–33.
- Ley O, Godinez V, Line scanning thermography and its application inspecting aerospace composites. In Proceedings of the 5th International Symposium on NDT in Aerospace, Singapore, 2013.
- Fernandes H, Zhang H, Figueiredo A, et al. Machine learning and infrared thermography for fiber orientation assessment on randomly-oriented strands parts. Sensors (Basel). 2018;18(1):288.
- Zhang H, Fernandes H, Djupkep Dizeu FB, et al. Pulsed micro-laser line thermography on submillimeter porosity in carbon fiber reinforced polymer composites: experimental and numerical analyses for the capability of detection. Appl Opt. 2016;55(34):D1–10.
- Khodayar F, Lopez F, Ibarra-Castanedo C, et al. Optimization of the inspection of large composite materials using robotized line scan thermography. J Nondestr Eval. 2017;36(2):32.
- Fedala Y, Streza M, Sepulveda F, et al. Infrared lock-in thermography crack localization on metallic surfaces for industrial diagnosis. J Nondestr Eval. 2014;33(3):335–341.
- Roemer J, Uhl T, Pieczonka L, Laser spot thermography for crack detection in aluminum structures, 7th International Symposium on NDT in Aerospace, 16. 18. Nov 2015, Bremen, Germany (AeroNDT 2015).
- Sakagami T, Ogura K. A new flaw inspection technique based on infrared thermal images under joule effect heating. Trans Jpn Soc Mech Eng Series A. 1992;58(555):2224–2231.
- Suzuki Y, Todoroki A, Mizutani Y, et al. Impact damage detection in CFRP using statistical analysis of resistance-temperature characteristics. J Solid Mech Mater Eng. 2011;5(1):33–43.
- Abry JC, Bochard S, Chateauminois A, et al. In situ detection of damage in CFRP laminates by electrical resistance measurements. Compos Sci Technol. 1999;59(6):925–935.
- Schulte K, Baron C. Load and failure analyses of CFRP laminates by means of electrical resistivity measurements. Compos Sci Technol. 1989;36(1):63–76.
- Suzuki Y, Todoroki A, Matsuzaki R, et al. Impact-damage visualization in CFRP by resistive heating: development of a new detection method for indentations caused by impact loads. Compos Part A Appl Sci Manuf. 2012;43(1):53–64.
- Suzuki Y, Todoroki A, Matsuzaki R, et al. Indentation-damage visualization in CFRP by resistive heating: analytical verification of the inspection of aircraft using its lightning protection systems. J Solid Mech Mater Eng. 2012;6(3):213–226.
- Grammatikos SA, Kordatos EZ, Barkoula NM, et al. Innovative non-destructive evaluation and damage characterisation of composite aerostructures using thermography. Plast Rubber Compos. 2011;40(6–7):342–348.
- Oswald-Tranta B. Detection and characterisation of short fatigue cracks by inductive thermography. Quant Infrared Thermogr J. 2022;19:239–260.
- Liu K, Huang K, Sfarra S, et al. Factor analysis thermography for defect detection of panel paintings. Quant Infrared Thermogr J. 2021;0:1–13.
- Kim C, Park G, Jang H, et al. Automated classification of thermal defects in the building envelope using thermal and visible images. Quant Infrared Thermogr J. 2022;0:1–17.
- Saeed N, Abdulrahman Y, Amer S, et al. Experimentally validated defect depth estimation using artificial neural network in pulsed thermography. Infrared Phys Technol. 2019;98:192–200.
- Saeed N, Omar MA, Abdulrahman Y. A neural network approach for quantifying defects depth, for nondestructive testing thermograms. Infrared Phys Technol. 2018;94:55–64.
- Erazo-Aux J, Loaiza-Correa H, Restrepo-Giron AD, et al. Thermal imaging dataset from composite material academic samples inspected by pulsed thermography. Data BR. 2020;32:106313.
- FLIR SystemsHigh Performance MWIR INSB Camera. Flir X6900sc. [ accessed on Sep 12, 2021]. Available online: https://www.flir.com/products/x6900sc-mwir/
- Szul T, Tabor S, Pancerz K. Application of the BORUTA algorithm to input data selection for a model based on rough set theory (RST) to prediction energy consumption for building heating. Energies. 2021;14:2779.
- Zhang M, Zhou Z. A review on multi-label learning algorithms. IEEE Trans Knowledge Data Eng. 2014;26:1819–1837.
- Pushpa M, Karpagavalli S. Multi-label classification: problem transformation methods in tamil phoneme classification. Procedia Comput Sci. 2017;115:572–579.
- Adeleke A, Noor A, Shamsul S, et al. An improved multi-label classifier chain method for automated text classification. Int J Adv Comput Sci Appl. 2021. DOI:http://dx.doi.org/10.14569/IJACSA.2021.0120352
- Elena M, Robin S, Jose B, et al. Dependent binary relevance models for multi-label classification. Pattern Recogn. 2014;47:1494–1508.
- Mohri M, Rostamizadeh A, Talwalkar A, et al. Foundations of machine learning (Adaptive computation and machine learning series). London (UK): The MIT Press; Aug. 2012.
- Bonaccorso G. Machine learning algorithms: a reference guide to popular algorithms for data science and machine learning. Birmingham (UK): Packt Publishing; Jul. 2017.
- Watt J, Borhani R, Katsaggelos AK. Machine learning refined, foundations, algorithms, and applications. 1st ed. Cambridge (UK): Cambridge University Press; Nov. 2016.