
 ?Mathematical formulae have been encoded as MathML and are displayed in this HTML version using MathJax in order to improve their display. Uncheck the box to turn MathJax off. This feature requires Javascript. Click on a formula to zoom.
Abstract
The aim of the study is to develop a scoring system for dairy farms in order to give specific information about the product and production process of milk. The scoring system, based on a multi-dimensional approach, was developed on the basis of data collected in 29 Italian dairy farms and included different aspects. For the evaluation of animal welfare, a selection of indicators set up in the European Project® assessment protocol for cattle 2009 was used. Environmental sustainability of milk production was assessed by a cradle-to-farm-gate Life Cycle Assessment. Laboratory analyses were carried out on bulk tank milk to evaluate microbiological, nutritional and nutraceutical quality. Nineteen variables were selected and retained to define six quality aspects: animal welfare, environmental and economic sustainability of farms, microbiological, nutritional and nutraceutical quality of milk. Each farm was visited twice; each visit received, for each variable, a score between 1 and 3 based on the frequency distribution of that variable in the farm sample. The relation among farm characteristics and quality aspects showed the importance to maximise dairy efficiency to improve environmental and economic sustainability of the farms and the inclusion of hay in dairy cows’ ration to enhance the nutraceutical and nutritional quality of milk. The proposed multi-dimensional scoring system is a practical tool: for the farmer, to support decisions for improving the quality of the product and the productive process; for the dairy company, as a value-added opportunity; for the consumer, who receives detailed information about nutritional characteristics and production system of dairy products.
Introduction
The agri-food sector has an important economic role at European and Italian level with important cultural, social and health implications.
The Lombardy region, Northern Italy, covers the 43% of the Italian milk production, the 50% of Lombardy milk being used for the production of Protected Designation of Origin (PDO) cheeses (Clal Citation2014).
The choice of the consumer is led by different needs, based on economic availability, culture and traditions; generally, the European consumer requires a good, nutrient and safe product.
The concept of quality related to animal and vegetable food products is very large, because it can be defined according to both objective scientific and technological criteria and to subjective criteria, based on consumers’ judgments. According to Giusti et al. (Citation2008) food quality definition includes: organoleptic and sensory attributes, food safety, nutritional value, functionality, service, stability, wholesomeness and psychological factors.
Starting from the large definition of food quality it is important, from a scientific point of view, to identify some measurable parameters able to quantify the quality level in a more precise way. This is useful, for instance, to make a comparison among foods of the same category and to monitor food preservation.
The demand for assurance schemes of high-quality animal products has been increasing over the last few decades, not only in terms of product attributes (health, safety, nutrition and sensory attributes), but also of ethical aspects (environmental sustainability and animal welfare) that involve the whole production process (Bredhal et al. Citation2001; Broom Citation2010).
In response to this demand, 129 public and private sustainability-related food information schemes have been identified by a survey carried out by the European Commission and are available at EU or national level (Grunert et al. Citation2014). The objective of these schemes is to increase transparency along the food chain and inform the consumer in a way that can promote sustainable consumption (Grunert et al. Citation2014). Informed choice, such as in the case of nutrition labelling, is hoped to empower people to consume more sustainably (European Commission Citation2008).
Among ethical concerns, the welfare of animals has increased significantly in the last decades in many European states and beyond (Buller Citation2013), and species-specific protocols for on-farm welfare assessment are presently a major objective worldwide and for the EU agricultural policy (Blokhuis et al. Citation2013). A protocol for on-farm welfare evaluation of dairy cattle has been recently developed in the European Project Welfare Quality® (Blokhuis et al. Citation2013).
The environmental sustainability of animal products is of great concern worldwide; many studies were carried out in order to calculate the environmental impact of milk production in Italy (Guerci et al. Citation2013; Bava et al. Citation2014; Pirlo et al. Citation2014) and in other countries (Del Prado et al. Citation2013; Roer et al. Citation2013). The Life Cycle Assessment (LCA) is the most frequently used method to assess environmental sustainability throughout the estimation of different environmental impact categories. All the upstream processes (e.g. feed production, purchasing of concentrate feed, barn management, slurry storage and spreading, etc.) are usually included in the system boundaries (IDF Citation2015). The aim of this kind of evaluations is to quantify environmental impacts linked to a production process and to identify the hot spot of the process, which could be improved to mitigate the impacts.
As for milk quality, the main topics involve microbiological, nutritional and nutraceutical aspects.
Raw milk harbours a complex microbial community including bacteria of technological relevance such as the lactic acid bacteria (LAB), which can contribute to subsequent desirable fermentative reactions (Quigley et al. Citation2013). Differently, a prevalent presence of spoilage bacteria can have considerable negative effects on the quality of milk and dairy products (Decimo et al. Citation2014). Moreover, late blowing caused by the outgrowth of clostridial spores present in raw milk, can create considerable product loss, especially in the production of hard and semi-hard raw milk cheese (Zucali et al. Citation2014).
Nowadays, there is a growing concern regarding a healthy way of living, and food has an important role in it. In this context, the consumer has increasingly become more aware of food quality including dietary fat composition. The attention of the scientific community is not only drawn to the level of saturated fatty acids (reported on nutritional labels) but also on the role of different dietary unsaturated fatty acids on health. In fact, numerous studies have ascertained the benefits of the conjugated isomers of linoleic acid (CLA) on the immune function with antilipogenic, antidiabetic, antiatherosclerotic and anticarcinogenic effects (Dilzer and Park Citation2012). In addition, the position of the first double bond from the end of the carbon chain has a recognised physiological importance, as the ω-3 family, in comparison to the ω-6 family, is very important in protecting against cardiovascular diseases (Rizos et al. Citation2012). Other fatty acids, which are not members of the unsaturated fatty acid family, but contribute with them in lowering the melting point of fat, are the branched chain fatty acids (BCFA) that are characterised by a methyl group attached to the second (iso) and third (anteiso) carbon atom from the methyl group end. The BCFA are correlated to gut health (especially of newborns) and are considered protective against cancer (Ran-Ressler et al. Citation2014).
Some studies have proposed integrated models in order to assess the sustainability of agriculture activity taking into account multiple factors associated with production (Meul et al. Citation2008; Müller-Lindenlauf et al. Citation2010). These authors considered, in particular, ecological aspects as biodiversity and environmental impact, economic (profitability and productivity) and social aspects including animal welfare and farm management of milk production. Also in the meat sector a multidisciplinary approach was tested: in the study of Castellini et al. (Citation2012) on three different poultry production systems, a multicriteria decision analysis was assessed and four dimensions were considered: economic, social, environmental and qualitative. The multidisciplinary approach has the advantage to consider simultaneously different aspects of the production chain, giving the possibility to the farmers to predict the strengths and weaknesses of the management choice.
We set up a novel scoring system for dairy farms that, using a multidimensional approach, gives information on both milk production process (animal welfare, environmental and economic sustainability) and final product quality (microbiological, nutritional and nutraceutical quality). The aim of the study was to test this scoring system on a group of dairy farms and to identify farm characteristics that can influence the final scores.
Materials and methods
Dairy cattle farms
Data and information of twenty-nine dairy cattle farms were gathered by means of direct on-farm surveys. All the farms were located in northern Italy and were members of a factory producing the PDO Italian cheese Grana Padano. All cows were Italian Holstein permanently kept indoor, with no access to pasture. This rearing system is the most commonly used in the North of Italy. Most of the farms (66%) were free stall barns with cubicles, 24% were tie stall barns and 10% were free stall barns with deep litter bedding.
Each farm was evaluated twice, during summer and during winter, for a total of 56 farm visits (2 visits were not possible because of technical problems).
Multi-dimensional assessment and scoring system
In order to create an easy-to-use tool for multiple quality aspects (animal welfare, environmental and economic sustainability of dairy farms, microbiological, nutritional and nutraceutical quality of milk), 19 variables were selected according to their informative characteristics and importance, resulted from previous studies (Bava et al. Citation2014; Zucali et al. Citation2014), and to their prevalence and variability in the sample (Figure ).
Figure 1. Variables, quality aspects and general index considered in the study.
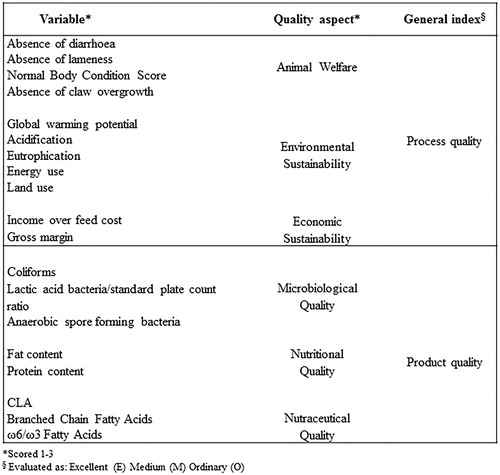
Animal welfare and environmental and economic sustainability defined the quality of the production process whereas microbiological, nutritional and nutraceutical attributes described the quality of the milk produced.
Animal welfare
Animal welfare was evaluated on 1296 individual lactating cows using a selection of indicators set up in the European Project Welfare Quality® (Citation2009): Body Condition Score (BCS, three levels), absence of lameness (% of animals), absence of diarrhoea (% of animals), and absence of claw overgrowth (% of animals). The number of cows sampled in each farm was determined on the basis of the current number of lactating cows on the herd size, following the sampling strategy recommended in the Welfare Quality® (Citation2009) protocol (e.g. all animals for herd size below 30 and, in any case, never less than 35% of the animals in the herd). All the assessments were made by trained observers. For the attribution of the BCS, each animal was observed from behind and from one side. As suggested by Welfare Quality® (Citation2009) for welfare evaluation purposes, a three level BCS was used, where 0 = too thin (deep tailhead cavity, spine to tuber coxae concave, transverse processes sharp, major bone structures prominent), 1 = normal and 2 = too fat (tailhead filled with fat, spine to tuber coxae convex, transverse processes invisible, outlines of fat patches visible under skin). The judgement was based mainly on visual clues, but palpation of the above-mentioned regions was helpful for a correct evaluation.
Lameness was evaluated in two different ways, depending on the farming system. In free stalls, cows were observed from behind and from one side, while they were walking on a plain and hard familiar surface. If the rhythm was regular and the weight of the cow was equally distributed on the four feet, then the animal was not lame. In tie-stalls, the cow’s legs were observed from behind while the cow was standing and encouraged to move sideways away from the observer; the observer recorded if the feet were rotated outwards or inwards, if the cow was resting on one foot more than on the others, if she was standing avoiding to bear weight on one foot or on part of one foot, if she was stepping (continuously shifting weight from one foot to another) or if she was reluctant to bear weight on one foot. When the animal was reluctant to bear weight on one foot, or when at least two of the other indicators were present, the cow was considered lame.
The presence of diarrhoea was confirmed on the basis of the presence of soft faeces or faecal soiling around or under the tail.
Claws were considered normal if they had a plain supporting surface area, if they were not bent, if they had the same length, if interdigital space was scarce or null and if the angle with the ground was not more than 50°. When two or more of these criteria were not respected, the claw was classified as overgrown.
Data were expressed as the percentage of animals without welfare problems in each farm.
Environmental and economic sustainability
The environmental impact of milk production in each dairy farm was evaluated through a detailed ‘‘cradle-to-farm-gate’’ LCA. Details about the application of the method were presented in Bava et al. (Citation2014). The system boundaries included all the on-farm processes plus the off-farm activities linked to the production of external inputs. Inventory data were obtained starting from personal interviews of farmers. Questions were addressed to obtain detailed information about cropping systems and field operations, fuel consumption, number of animals, housing systems, manure storage and animal rations. Dry matter intake of feed of dairy cows was calculated from feed ration composition and the utilisation of CPM-Dairy Ratio Analyser Beta V3 software. After that, by applying the equations suggested by Intergovernmental Panel on Climate Change (IPCC Citation2006) and European Environment Agency (EEA Citation2009), gas emissions were evaluated. The functional unit was 1 kg of Fat and Protein Corrected Milk (FPCM; 4.0% of fat and 3.3% of protein content) obtained with the equation suggested by IDF (Citation2015): FPCM = Production (kg/year) x [0.1226 x fat % + 0.0776 x crude protein % + 0.2534]. The environmental impact was obtained, using the software SIMAPRO (PRé Consultants Citation2014), and the categories chosen were: Global Warming Potential (GWP) expressed as kg CO2 eq/kg FPCM; acidification (g SO2-eq/kg FPCM), eutrophication (g PO43−-eq/kg FPCM), energy use, (MJ/kg FPCM) and land use (m2/kg FPCM) performed with the EPD 1.03 method, updated with IPCC (Citation2007) GWP conversion factors (100-year time horizon).
To estimate farm economic sustainability, gross margin and income over feed cost (IOFC) were calculated as suggested by Bava et al. (Citation2014). Gross margin was calculated as total receipts minus the direct production costs; the IOFC was the income from milk minus feeding costs (self-produced and purchased feed) per cow per day.
Microbiological and nutritional quality
Bulk milk was sampled from the tank, transported to the laboratory under refrigeration (4 °C) and submitted to microbiological analyses within 12 h from collection.
Standard Plate Count (SPC) was determined on each sample according to ISO method (ISO Citation2003). Coliforms were counted with Petrifilm Coliform/Escherichia coli Count Plates (3M, Minneapolis, MN) incubated for 24 h at 30 °C, lactic acid bacteria (LAB) on MRS agar (Biolife, Milan, Italy) incubated for 72 h at 30 °C under anaerobic conditions (Anaerocult A, Merck Millipore, Darmstadt, Germany). Anaerobic spore formers content was obtained throughout the Most Probable Number (MPN). MPN enumeration was performed with three 10-fold dilutions with three tubes at each dilution calculating results according to ISO (Citation2007). The culture medium used for MPN was prepared with reconstituted skimmed milk (10% wt/v) supplemented with a solution of yeast extract (1.0%), sodium lactate (3.36%), sodium acetate (1.0%), cysteine (0.2%) with vaseline/paraffin (1:1, wt/wt) seals. The heat treatment applied to the inoculated milk medium was 80 °C for 10 min. The incubation period was 7 days at 37 °C. Tubes exhibiting abundant gas formation were scored positive.
Proximate analysis of milk (protein, fat, lactose and casein) were performed by the Lombardy Regional Breeders Association (ARAL) laboratory with the MilkoscanTM FT 6500 Plus instrument (Foss, Hillerød, Denmark).
Nutraceutical quality
The nutraceutical evaluation of milk was based on fatty acid composition. Lipids, and the relative fatty acid methyl esters, were obtained as described by De Noni and Battelli (Citation2008), whereas the separation was performed on a CP Sil 88 column (100 m x 0.25 mm i.d., x 0.20 μm film thickness) using an Agilent 6890 gas chromatograph (Agilent, Santa Clara, CA) fitted with an on-column injector and a flame ionisation detector held at 280 °C. Hydrogen (0.5 ml/min) was used as the carrier gas. The oven was programmed as follows: initial temperature at 50 °C for 4 min, ramp to 120 C at 10 °C/min, held for 1 min; then ramp to 170 °C at 5° C/min, and held for 40 min; then ramp to 220° C at 4 °C/min and held for 25.50 min (total time:100 min). Instrument control, data collection, and data analysis were performed using Empower software (Waters Corporation, Milford, MA). The results were calculated as percentages of each fatty acid out of total fatty acids. The fatty acid composition ranged from C4 to C21 carbon number chain (linear/branched, saturated/unsaturated, cis/trans, and ω-9/ω-6/ω-3). The parameters used for the nutraceutical evaluation were: CLA (C18:2 cis9-trans11); sum of iso BCFA (iC14:0 + iC15:0 + iC16:0 + iC17 + iC18:0); ω6: ω3 ratio (C18:2n-6cis/C18:3n-3cis).
Scoring system
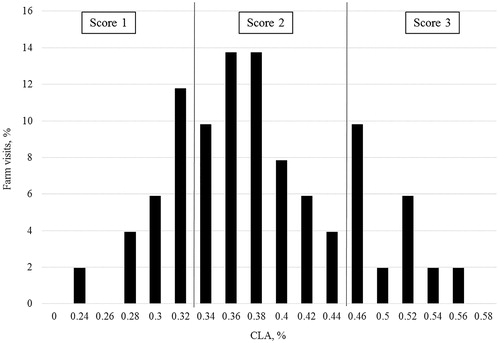
For each variable, interquartile ranges were calculated. The 25% best performing farms for each quality variable received the score 3, while the 25% worst performing farms were set to a score of 1; all the other farms were scored 2. An example of a rescaled variable is showed in . From the average of the scored variables, 6 quality aspects were calculated ().
Figure 2. Frequency distribution of CLA variable and identification of percentiles for the allocation to the 3-level rescaled variable.
The 6 quality aspects were then further summarised into two general indices: (A) process quality (based on three quality aspects: animal welfare, environmental and economic sustainability), and (B) product quality (based on the other three quality aspects: nutritional, nutraceutical and microbiological quality). Each general index was scored in three levels, separately for each farm visit: excellent (E), medium (M), ordinary (O). If the three quality aspects were higher than the average of the sample at the same time, the farm visit was assigned to level E; if none of the three quality aspects was above the average, the farm visit was assigned to level O; in all other cases, it was assigned to M.
Statistical analyses
In order to make the indices useful for the improvement of both farm management and the quality of process and product, a GLM (SAS Citation2004) analysis with two fixed factors was performed to compare the characteristics of the excellent, the medium and the ordinary observations. The model was:
where Y = dependent variable (Farm land (ha), Arable land (ha), Lactating cows (n), Livestock Unit (LU), Stocking density (LU/ha), Replacement rate (%), Milk production (kg FPCM/cow day), Feed intake (kg DMI cow/day), Dairy efficiency (kg FPCM/kg DMI), Forage/concentrate, Maize silage intake (%), Hay intake (%), Feed self-sufficiency (%)); m = general mean; A = effect of process quality index level (i = excellent, medium, ordinary); B = effect of product quality index level (j = excellent, medium, ordinary); S = effect of season (k = 1,2); eijkl = residual error.
Estimated means were obtained from a single model run. The interaction between A and B was initially included in the model but, as it was not significant, it was not included in the final model.
Livestock Unit (LU) was calculated for each farm following the coefficient proposed by DEFRA (Citation2010), while dairy efficiency (kg FPCM/kg DMI) was calculated for the lactating cows.
Results and discussion
The farms involved in the study (Table ) were characterised by larger dimension, higher stocking density and higher milk production compared to average Italian data (AIA Citation2014). At the same time a large variability could be observed in particular for farm land and arable land: in the sample there were farms that did not have arable land utilised for annual crops, because all hectares were permanent pasture destined to hay production and, consecutively, no silages were included in the cows’ diet. Also stocking density showed a high variability, revealing a different intensity level of the farms involved in the study. The average percentages of maize silage and hay intake are similar to what is commonly reported in North-Italian dairy farms.
Table 1. Average characteristics of the farms involved in the study.
The low feed self-sufficiency, showed by the mean value, was linked to the intensity level of the farming system characterised by high stocking density.
Thresholds of multi-dimensional assessment
In order to evaluate a product or a process, it is necessary to know the real values in the population and establish reachable thresholds. shows the mean values of the variables and percentiles used to define the multi-dimensional scoring system.
Table 2. Mean values and percentile of the variables chosen to define quality aspects.
The overall welfare situation in the visited farms was good, with a high percentage of animals in normal body conditions and that did not present diarrhoea. The average percentage of lame cows was only 10.5%, which is very close to the threshold (10%) suggested by EFSA (Citation2009) and considerably lower than the percentage of about 50% observed in Italian mountain dairy farms by Battini et al. (Citation2010) using the same scoring system. This is a good result, if we consider that cows were of Holstein genetic background (that seems to be one of the more susceptible breeds to this problem; Mattiello et al. Citation2011) and that they never had access to pasture (which is known to have a positive effect on the reduction of the incidence of lameness; Bielfeldt et al. Citation2005; Mattiello et al. Citation2005; Battini et al. Citation2010). Due to the low incidence of lameness, the benchmark values for this variable were set at very high standards (e.g. 99%); this means that even farms with minor lameness problems (below the 10% suggested threshold) would not fulfil the requirements for this variable. This is probably the main reason why only 3.5% of the farms reached the best score for the animal welfare index. The main welfare problem in the visited farms seems to be related to the presence of a relatively high percentage of cows with overgrown claws. This percentage was about three times higher than that recorded in a survey in North-Eastern Italian farms (Mattiello et al. Citation2009).
About the environmental impact aspects, the values of GWP reported are similar to what was found in a previous study in the same region by Guerci et al. (Citation2013) in intensive dairy farms, while the same authors found values of acidification and eutrophication higher than those reported in this study; this result is due to the different kind of farms included in the present study: some were intensive farms, with large use of fertilisers and high stocking density (LU/ha of land), some used small amounts of fertiliser and the number of animals per hectare was limited. Land use and eutrophication resulted higher than the findings of Meul et al. (Citation2014). The benchmark values (25th percentile) of all the impacts, except for land use, resulted higher than what O’Brien et al. (Citation2012) found as values of environmental impact in confined dairy systems; this suggests that the goal values are reachable in a dairy farm production system.
The microbiological data indicate that the milk produced was of good quality, highlighting that herds and milking hygiene were well controlled; nevertheless, high variation between samples was observed mainly due to the different cow and environmental hygienic conditions in the different farms (Zucali et al. Citation2011).
The mean value of SPC, that provides an estimate of the total number of aerobic bacteria present in raw milk, was 4.88 ± 0.82 Log10 cfu/mL. It is well known that SPC is strictly related to sanitary conditions, cleaning and sanitisation of milking equipment and cooling of milk (Bava et al. Citation2011), and that microbial aptitude of milk to processing is strongly influenced by specific groups of organisms.
Coliforms average content, which is known to be linked to cow hygiene and cow environment and efficacy of milking equipment sanitisation (Zucali et al. Citation2011), was 2.65 ± 1.43 Log10 cfu/mL and the 25th percentile was defined by a content of 1.78 Log10 cfu/mL.
The average content of LAB, expressed as percentage of SPC, was 83.4%, with a considerable variation among herds. The different LAB content could be related to a different stable environment, but also to a different cow hygiene since teat surface was demonstrated to be the main source of useful cheese-making bacteria (Vacheyrou et al. Citation2011). Since it is well documented that non starter lactic acid bacteria originating from raw milk are the main trait linked to the typicality of cheeses (Beresford et al. Citation2001; Moreno et al. Citation2006), a high LAB content represents a primary goal of milk destined to raw milk cheese making.
Anaerobic spore forming bacteria were further considered in the proposed scoring model because late blowing, caused by the outgrowth of clostridial spores present in raw milk, can create considerable product losses, especially in the production of hard and semi-hard cheeses such as Grana Padano and Parmigiano Reggiano.
The average count of anaerobic spore forming bacteria was 2.23 Log10 MPN/L with a level of 1.90 Log10 MPN/L delimiting the lowest contaminated milk samples within the 25th percentile. The defined level can be considered effective in preventing late blowing since the minimum level at which some authors reported the problem was with a value of 100 MPN/L (Borreani and Tabacco Citation2008).
As for the nutraceutical characteristics of milk samples, CLA levels found in this work were lower than those recorded by other authors in the same area for conventional farms (Bergamo et al. Citation2003, Prandini et al. Citation2009), also in the 75th percentile, whereas the ω-6/ω-3 ratio is more favourable than that recorded by Prandini et al. (Citation2009).
Regarding BCFA, the values recorded in the present study were higher than those from a previous study in the same area (1.1% of total FA for farms with low forage:concentrate ratio, 1.4 for farms with high forage:concentrate ratio and 2.3 in the summer grazing period) (Battelli and De Noni, Citation2009), and lower than those reported by Ferlay et al. (Citation2008) (65% concentrate gave 1.94, while 35% concentrate gave 2.23% of BCFA out of total FA) in Haute Loire Department, a semi-mountain area. As all the farms were located in a plain area, the feeding was quite conventional, and there was no transhumance to the mountain during summer, the levels of CLA, and ω-3 FA remained quite constant throughout the year.
Process and product quality evaluation
In order to deeply examine the relation between process and product quality and farm characteristics, the excellent (E), medium (M) and ordinary (O) farm visits were identified. The excellent farm visits (n = 15) in terms of process quality index showed the highest milk production and the highest capacity of transformation of the feed in milk (dairy efficiency; kg FPCM/kg DMI); the values are significantly different from the results achieved by others groups (medium and ordinary) (). This confirms the important relation between dairy efficiency and process aspects as environmental (Kristensen et al. Citation2011) and economic sustainability.
Table 3. Process quality index level (excellent, medium and ordinary): average characteristics of the observations.
Among the 56 farm visits only 12 (21.4%) were excellent for product quality index (), while most of them (40; 71.4%) had a medium quality. The excellent observations were characterised by significantly (P < .1) lower farm land compared to the others. The number of lactating cows was slightly lower, even if not significantly, in the excellent farms (P = .168). This suggests that reaching a high product quality index is easier in dairy farms of smaller size, probably due to the more efficient control of factors that could improve milk quality. In particular, the cows of these farms were fed with diet with higher forage/concentrate ratio that can concur to increase the level of branched chain fatty acids (Vlaeminck et al. Citation2005) and reduce the level of linoleic acid, and consequently the ω6/ω3 ratio (Sterk et al. Citation2011).
Table 4. Product quality index level (excellent, medium and ordinary): average characteristics of the observations.
The lack of significant effects is probably due to the fact that product quality may change also depending on farmer choices and management aspects not included in this study (as, for example, milking procedures or cow cleanliness).
Example of application of scoring system
In order to understand how the modification of a single farm management factor can affect the different process and product quality indices, the evaluating scheme was applied to the farms grouped based on different criteria. Considering that dairy efficiency is a variable that significantly affected the process quality index (Excellent observation for environmental impact, economic status and animal welfare; ), it is useful to analyse how the modification of this variable affects all the six quality aspects included in the scoring system (). Highly efficient farms had, as expected, the best indices for environmental and economic aspects, because they had the highest milk production using less feed resources; the production of feed, locally or globally, has an environmental and economic load. Maximising the animal efficiency allows to reduce feed production and purchasing for kg of product; it is well known (Gerber et al. Citation2013) that the production of animal feed is one of the main contributor (about 45%) to the environmental impact of animal products, in particular, for GWP impact category. The efficient farms (>1.4 kg FPCM/kg DMI) had also the best scores for microbiological and nutritional quality; this suggests an accurate farm management, in terms of barn and milking hygiene, which positively influenced microbiological quality. The high nutritional quality index could be determined by a balanced ration for lactating cows and by careful genetic choices.
Figure 3. Farm quality evaluation on the basis of dairy efficiency (kg FPCM/kg DMI).
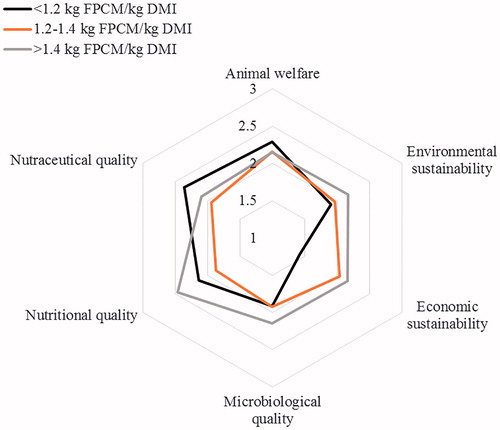
This suggests also that the attention to environmental sustainability is not just an additional load for the farmers, since an optimal farm management allows to achieve both environmental and production efficiency.
The high amount of hay inclusion in cow ration affected, although not significantly, the product quality index (Excellent observations for nutritional, nutraceutical and microbiological quality) (). Thus, classifying the observations on the basis of the percentage of hay in the lactating cows’ ration (% of DMI), it is possible to notice some differences in the values of the six quality aspects (). Looking at the single index value can give important information rather than considering only the product/process quality index.
Figure 4. Quality evaluation on the basis of the percentage of hay in the lactating cows’ ration (% of DMI).
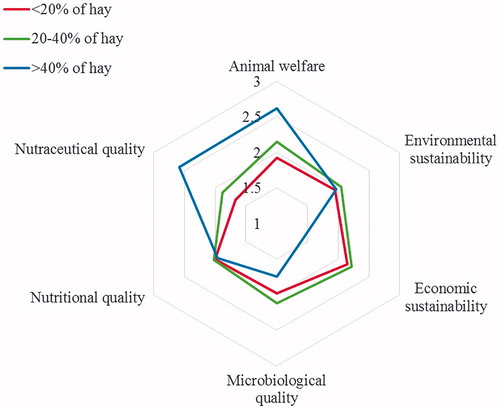
When more than 40% of hay was included in the diet of lactating cows, nutraceutical quality and animal welfare indices were the highest, but economic sustainability and microbiological indices were the worst. This suggests that including a high percentage of hay in the diet needs to be carefully evaluated from an economic point of view, because it may lower milk production and compromise the gross margin for the farmer. On the other hand, high quantity of hay in the ration gave good results in terms of nutraceutical value of milk: in fact, as mentioned above, CLA, BCFA and ω-3 FA are highly dependent on feed choices, as hay inclusion can promote the synthesis of these FA.
Animal welfare index was higher in the farms that included a higher proportion of hay in the diet. This result can be explained by the lower percentage of animals with diarrhoea and the lower percentage of animals with lameness recorded in farms with a higher proportion of hay in the diet. In fact, it is well known that an increase of forage, and in particular hay, in the cows ration can indirectly influence the onset of problems as diarrhoea and lameness: these problems can be indirectly influenced by the ration and a high proportion of forage in the diet can limit their onset (Calamari et al. Citation2007; Lean et al. Citation2013).
Conclusions
This study proposes a new concept of quality evaluation based, at the same time, on nutritional, microbiological, nutraceutical, environmental, animal welfare and economic aspects. The proposed quality scheme, applied to milk production at farm level, includes some variables that are easy to measure by the farmer after training (for example animal welfare or economic variables), others that could be obtained from routine milk analysis (for example, from breeder associations or dairy companies), and others that are more complex and require specific analyses (nutraceutical quality of milk and environmental sustainability of milk production).
The relation among farm characteristics and quality variables integrated in the quality scheme confirms the importance to maximise dairy efficiency in order to improve environmental and economic sustainability of the farms. Moreover the inclusion of hay in dairy cows’ ration can be beneficial for the nutraceutical and nutritional quality of milk.
In our study, the reference population was based only on 29 farms: therefore, this does not assume to represent a complete situation, but it can be used as a starting point for applying the proposed methodology.
The average values of the variables showed that the farms reached a good level of management and milk quality and the benchmark values proposed could be easily reachable in many other intensive dairy farms, located in the same geographical area. If this assessment scheme would be adopted, these benchmark values may be continuously updated with new inputs, generating a reference population that is more representative of the actual situation of dairy farms. The scored variables were combined in a farm scoring system. The tool strength is given by the possibility to associate different aspects of farm management and milk quality.
The beneficiaries of the tool may be many. First of all, farmers can use the proposed quality scheme as a practical tool for comparing their own farm performance with other farms and supporting decisions in order to improve the quality of the product and the process. Moreover the tool may help farmers to increase the monetary value of their activity through a more careful evaluation of costs and benefits. A label on milk highlighting these aspects may help farmers to increase the monetary value of their products underlining the quality of both product and process.
Another beneficiary can be the company that produces and commercialises milk or cheese, as it can evaluate and give a prize to the best farms which produce the raw milk with the best indices. Consumers can be the last beneficiaries of the proposed tool, which, properly simplified, could be a quality brand for dairy products: this new brand could certify the whole process and not only the nutritional characteristics of the product.
In conclusion, the advantage of the proposed quality scheme is the possibility to consider different aspects of milk production taking into account both the quality of the product and the quality of the process. The limit of this scheme is that it does not consider other broader aspects as ecological and social sustainability of milk production. These aspects might be integrated in the scheme in further studies.
Acknowledgements
The authors would like to thank Lucio Zanini (Associazione Regionale Allevatori Lombardia) and Martin Sanna (Santangiolina Latte Fattorie Lombarde Società Agricolo Cooperativa) for their technical support and precious advise. Many thanks are due to all the farmers who devoted part of their time to answer our questionnaires and to allow data collection in their farms, and to the students who helped with data collection.
Disclosure statement
The authors report no conflicts of interest. The authors alone are responsible for the content and writing of this article.
Funding
This research was supported by Plan for R&S (Research and Development), Region of Lombardy DG Agricoltura, Italy. Project no. 1726—Individuazione di modelli di aziende zootecniche per produzioni di eccellenza di latte e derivati.
References
- AIA. 2014. Bollettino dei controlli della produttivita del latte of the Italian Breeders Association; [cited 2015 Jan]. Available from: http://bollettino.aia.it/bollettino/bollettino.htm.
- Bava L, Zucali M, Sandrucci A, Brasca M, Vanoni L, Zanini L, Tamburini A. 2011. Effect of cleaning procedure and hygienic condition of milking equipment on bacterial count of bulk tank milk. J Dairy Res. 78:211–219.
- Bava L, Sandrucci A, Zucali M, Guerci M, Tamburini A. 2014. How can farming intensification affect the environmental impact of milk production? J Dairy Sci. 97:4579–4593.
- Battelli G, De Noni I. 2009. Branched-chain fatty acids: a potential parameter for assessing authenticity of PDO mountain cheeses. Proceedings “Methods and issues in cheese Authenticity Studies: a Workshop”; 2009 Sep 4–5; Avellino; p. 30.
- Battini M, Andreoli E, Mattiello S. 2010. Il benessere della bovina da latte nei sistemi zootecnici alpini: confronto tra differenti tipologie di stabulazione e gestione. Quaderni SoZooAlp. 6:169–182.
- Beresford TP, Fitzsimons NA, Brennan NL, Cogan TM. 2001. Recent advances in cheese microbiology. Int Dairy J. 11:259–274.
- Bergamo P, Fedele E, Iannibelli L, Marzillo G. 2003. Fat-soluble vitamin contents and fatty acid composition in organic and conventional Italian dairy products. Food Chem. 82:625–631.
- Bielfeldt JC, Badertscher R, Tölle KH, Krieter J. 2005. Risk factors influencing lameness and claw disorders in dairy cows. Livestock Prod Sci. 95:265–271.
- Blokhuis HJ, Miele M, Veissier I, Jones RB. 2013. Improving farm animal welfare. Science and society working together: the welfare quality approach. Wageningen, Netherlands: Wageningen Academic Publishers.
- Borreani G, Tabacco E. 2008. Low permeability to oxygen of a new barrier film prevents butyric acid bacteria spore formation in farm corn silage. J Dairy Sci. 91:4272–4281.
- Bredhal ME, Northern JR, Boeker A, Normile MA. 2001. Consumer demand sparks the growth of quality assurance schemes in the European food sector. In: Regmi A, editor. Changing structure of global food consumption and trade. Washington (DC): Market and Trade Economic Division, Economic Research Service, U.S. Department of Agriculture, Agriculture and Trade report; pp. 90–102. Available from: http://www.ers.usda.gov/media/293645/wrs011_1_.pdf.
- Broom DM. 2010. Animal welfare: an aspect of care, sustainability, and food quality required by the public. J Vet Med Educ. 37:83–88.
- Buller H. 2013. Animal welfare: from production to consumption. In: Blokhuis HJ, Miele M, Veissier I, Jones B, editors. Improving farm animal welfare. Wageningen, Netherlands: Wageningen Academic Publishers; p. 49–69.
- Calamari L, Bertoni G, Châtel A, Turille G. 2007. Messa a punto di un modello per la valutazione del benessere della vacca da latte negli allevamenti della Valle d’Aosta. Quaderni SoZooAlp. 5:67–79.
- Castellini C, Boggia A, Cortina C, Dal Bosco A, Paolotti L, Novelli E, Mugnai C. 2012. A multicriteria approach for measuring the sustainability of different poultry production systems. J Cleaner Prod. 37:192–201.
- Clal. 2014 [cited 2015 Jan]. Available from: http://www.clal.it/.
- De Noni I, Battelli G. 2008. Terpenes and fatty acid profiles of milk fat and “Bitto” cheese as affected by transhumance of cows on different mountain pastures. Food Chem. 109:299–309.
- Decimo M, Morandi S, Silvetti T, Brasca M. 2014. Characterisation of gram‐negative psychrotrophic bacteria isolated from italian bulk tank milk. J Food Sci. 79:2081–2090.
- DEFRA. 2010. Department for Environment, Food and Rural Affairs. Definitions of terms used in farm business management. Available from: http://www.defra.gov.uk.
- Del Prado A, Crosson P, Olesen JE, Rotz CA. 2013. Whole-farm models to quantify greenhouse gas emissions and their potential use for linking climate change mitigation and adaptation in temperate grassland ruminant-based farming systems. Animal. 7:373–385.
- Dilzer A, Park Y. 2012. Implication of conjugated linoleic acid (CLA) in human health. Crit Rev Food Sci Nutr. 52:488–513.
- EEA. 2009. EMEP/EEA air pollutant emission inventory guidebook. Technical guidance to prepare national emission inventories. 4.D Crop production and agricultural soils; [cited 2012 Feb]. Available from: http://www.eea.europa.eu/publications/emep-eea-emission-inventory-guidebook-2009/part-b-sectoral-guidancechapters/4-agriculture/4-d/4-d-crop-production-and-agricultural-soils.pdf/view.
- EFSA. 2009. Scientific opinion on welfare of dairy cows in relation to leg and locomotion problems based on a risk assessment with special reference to the impact of housing, feeding, management and genetic selection. EFSA J. 1142:1–57.
- European Commission. 2008. Sustainable Consumption and Production and Sustainable Industrial Policy Action Plan. COM 397 Final.
- Ferlay A, Agabriel C, Sibra C, Journal C, Martin B, Chilliard Y. 2008. Tanker milk variability in fatty acids according to farm feeding and husbandry practises in a French semi-mountain area. Dairy Sci Technol. 88:193–215.
- Gerber PJ, Steinfeld H, Henderson B, Mottet A, Opio C, Dijkman J, Falcucci A, Tempio G. 2013. Tackling climate change through livestock – A global assessment of emissions and mitigation opportunities. Roma: Food and Agriculture Organisation of the United Nations (FAO).
- Giusti AM, Bignetti E, Cannella C. 2008. Exploring new frontiers in total food quality definition and assessment: from chemical to neurochemical properties. Food Bioprocess Technol. 1:130–142.
- Grunert KG, Hieke S, Wills J. 2014. Sustainability labels on food products: consumer motivation, understanding and use. Food Policy. 44:177–189.
- Guerci M, Bava L, Zucali M, Sandrucci A, Penati C, Tamburini A. 2013. Effect of farming strategies on environmental impact of intensive dairy farms in Italy. J Dairy Res. 80:300–308.
- IDF. 2015. Bulletin of the International Dairy Federation no 479/2015. A common carbon footprint approach for dairy. The IDF guide to standard lifecycle assessment methodology for the dairy sector. Brussels (Belgium): International Dairy Federation.
- ISO. 2003. International Organisation for Standardisation ISO 4833:2003. Microbiology of food and animal feeding stuffs. Horizontal method for the enumeration of microorganisms. Colony count technique at 30 C. Geneva (Switzerland).
- ISO. 2007. International Organisation for Standardisation ISO 7218:2007. Microbiology of food and animal feeding stuffs-general requirements and guidance for microbiological examinations. Geneva (Switzerland).
- Intergovernmental Panel on Climate Change (IPCC). 2006. Emissions from livestock and manure management. Chapter 10 and 11; [cited 2015 Jan]. Available from: http://www.ipcc-nggip.iges.or.jp/public/2006gl.
- IPCC. 2007: Intergovernmental Panel on Climate Change. Climate change 2007: the physical science basis. In: Solomon S, Qin D, Manning M, Chen Z, Marquis M, Averyt KB, editors. Contribution of working group I to the fourth assessment report of the intergovernmental panel on climate change. New York, NY: Cambridge University Press.
- Kristensen T, Mogensen L, Knudsen MT, Hermansen JE. 2011. Effect of production system and farming strategy on greenhouse gas emissions from commercial dairy farms in a life cycle approach. Livestock Sci. 140:136–148.
- Lean IJ, Westwood CT, Golder HM, Vermunt JJ. 2013. Impact of nutrition on lameness and claw health in cattle. Livestock Sci. 156:71–87.
- Mattiello S, Arduino D, Tosi MV, Carenzi C. 2005. Survey on housing, management and welfare of dairy cattle in tie-stalls in western Italian Alps. Acta Agric Scand Sect A Anim Sci. 55:31–39.
- Mattiello S, Battini M, Andreoli E, Barbieri S. 2011. Short communication: breed differences affecting dairy cattle welfare in traditional alpine tie-stall husbandry systems. J Dairy Sci. 94:2403–2407.
- Mattiello S, Klotz C, Baroli D, Minero M, Ferrante V, Canali E. 2009. Welfare problems in alpine dairy cattle farms in Alto Adige (Eastern Italian Alps). Ital J Anim Sci. 8(Suppl. 2):628–630.
- Meul M, Van Middelaar CE, de Boer IJM, Van Passel S, Fremaut D, Haesaert G. 2014. Potential of life cycle assessment to support environmental decision making at commercial dairy farms. Agr Syst. 131:105–115.
- Meul M, Van Passel S, Nevens F, Dessein J, Rogge E, Mulier A, Van Hauwermeiren A. 2008. MOTIFS: a monitoring tool for integrated farm sustainability. Agronomy Sust Dev. 28:321–332.
- Moreno MF, Sarantinopoulos P, Tsakalidou E, De Vuyst L. 2006. The role and application of enterococci in food and health. Int J Food Microbiol. 106:1–24.
- Müller-Lindenlauf M, Deittert C, Köpke U. 2010. Assessment of environmental effects, animal welfare and milk quality among organic dairy farms. Livestock Sci. 128:140–148.
- O’Brien D, Shalloo L, Patton J, Buckley F, Grainger C, Wallace M. 2012. Evaluation of the effect of accounting method, IPCC v. LCA, on grass-based and confinement dairy systems’ greenhouse gas emissions. Animal. 9:1512–1527.
- Pirlo G, Carè S, Fantin V, Falconi F, Buttol P, Terzano GM, Masoni P, Pacelli C. 2014. Factors affecting life cycle assessment of milk produced on 6 Mediterranean buffalo farms. J Dairy Sci. 97:6583–6593.
- Prandini A, Sigolo S, Piva G. 2009. Conjugated linoleic acid (CLA) and fatty acid composition of milk, curd and Grana Padano cheese in conventional and organic farming systems. J Dairy Res. 76:278–282.
- PRé Consultants. 2014. SimaPro (8.0.3.), LCA software. Amersfoort, The Netherlands; [cited 2015 Jan]. Available from: http://www.pre.nl.
- Quigley L, O'Sullivan O, Stanton C, Beresford TP, Ross RP, Fitzgerald GF, Cotter PD. 2013. The complex microbiota of raw milk. FEMS Microbiol Rev. 37:664–698.
- Ran-Ressler RR, Bae SE, Lawrence P, Wang DH, Brenna JT. 2014. Branched-chain fatty acid content of foods and estimated intake in the USA. Br J Nutr. 112:565–572.
- Rizos EC, Ntzani EE, Bika E, Kostapanos MS, Elisaf MS. 2012. Association between omega-3 fatty acid supplementation and risk of major cardiovascular disease events: a systematic review and meta-analysis. J Am Med Ass. 308:1024–1033.
- Roer AG, Johansen A, Bakken AK, Daugstad K, Fystro G, Strømman AH. 2013. Environmental impacts of combined milk and meat production in Norway according to a life cycle assessment with expanded system boundaries. Livestock Sci. 155:384–396.
- SAS. 2004. 9.2. SAS Inst. Inc., Cary, NC. Available from: http://support.sas.com/documentation/onlinedoc/91pdf/index.html.
- Sterk A, Johansson BEO, Taweel HZH, Murphy M, van Vuuren AM, Hendriks WH, Dijkstra J. 2011. Effects of forage type, forage to concentrate ratio, and crushed linseed supplementation on milk fatty acid profile in lactating dairy cows. J. Dairy Sci. 94:6078–6091.
- Vacheyrou M, Normand AC, Guyot P, Cassagne C, Piarroux R, Bouton Y. 2011. Cultivable microbial communities in raw cow milk and potential transfers from stables of sixteen French farms. Int J Food Microbiol. 146:253–262.
- Vlaeminck B, Fievez V, Cabrita ARJ, Fonseca AJM, Dewhurst RJ. 2005. Factors affecting odd- and branched-chain fatty acids in milk: a review. Anim Feed Sci Tech. 131:389–417.
- Welfare Quality®. 2009. Welfare quality® assessment protocol for cattle. Welfare quality® consortium. Lelystad, Netherlands. Available from: http://www.agricultura.gov.br/arq_editor/file/camaras_setoriais/Leite_e_derivados/41RO/Welfare%20Quality.pdf.
- Zucali M, Bava L, Colombini S, Brasca M, Decimo M, Morandi S, Tamburini A, Crovetto GM. 2014. Management practices and forage quality affecting the contamination of milk with anaerobic spore-forming bacteria. J Sci Food Agric. 95:1294–1302.
- Zucali M, Bava L, Tamburini A, Brasca M, Vanoni L, Sandrucci A. 2011. Effect of cleaning procedure and hygienic condition of milking equipment on bacterial count of bulk tank milk. J Dairy Res. 78:436–441.