
Abstract
The aim of this study was to investigate the sources of variation of milk fatty acids (FA) routinely predicted by mid-infrared spectroscopy in Holstein-Friesian (HF), Brown Swiss (BS), Simmental (SI) and Alpine Grey (AG) cattle breeds. A linear mixed model was used to analyse the data which included 153,801 individual milk samples from 14,301 cows. Fixed effects included in the model were breed, month of sampling, year of sampling, stage of lactation, parity and first order interactions between them, and random effects were herd nested within breed, cow nested within breed and the residual error. Milk of AG cows exhibited the lowest content of saturated FA and the greatest content of unsaturated FA, whereas milk of BS had an opposite pattern. Holstein-Friesian and SI were intermediate between AG and BS breeds for all the FA except for total C18:1, which was the greatest in HF. Saturated FA, C14:0 and C16:0 increased from calving until 120 days in milk, whereas unsaturated FA and C18:1 decreased. First parity cows produced milk with lower concentration of de novo FA than multiparous animals. The greatest content of unsaturated FA and C18:1 was observed in summer, whereas saturated FA, C14:0, C16:0 and C18:0 decreased in summer and increased in winter. The differences in milk FA profile among breeds are useful for genetic selection and for feeding strategies.
Introduction
Milk and dairy products contribute to less than 15% of the total fat in human diet and about 25% of total saturated fat in western diets (Huth & Park Citation2012). Average bovine milk fat contains 70% saturated fatty acids (SFA), 25% monounsaturated fatty acids (MUFA) and 5% polyunsaturated fatty acids (PUFA). The relationship between the amount of saturated fat in the diet and the incidence of cardiovascular and coronary heart diseases has been widely investigated in the last years, with controversial results (Zyriax & Windler Citation2000; German et al. Citation2009; Huth & Park Citation2012). There is also evidence that milk fatty acid (FA) composition influences the technological properties of butter (MacGibbon & McLennan Citation1987; Rønholt et al. Citation2013). For example, increasing the concentrations of C18:1 and C18:2 and reducing the concentrations of C8:0 to C14:0 results in softer milk fat, with improved spreadability.
Milk FA composition is influenced by several factors, the main being feeding, species, breed, individual variability (Ferlay et al. Citation2011; Poulsen et al. Citation2012), stage of lactation and metabolic status of the animal. The negative energy balance that may occur during early stages of lactation is responsible for a rapid decrease of milk SFA until the peak of lactation and an increase thereafter, whereas unsaturated FA (UFA) exhibit an opposite trend (Arnould & Soyeurt Citation2009; Gross et al. Citation2011). Feeding practice is a major factor that influences milk FA composition (Ferlay et al. Citation2011; Marseglia et al. Citation2013; Comino et al. Citation2015). Several studies demonstrated an increase of UFA and a decrease of SFA content in milk during grazing season; in particular, de novo synthesised FA had a minimum in summer whereas blood-derived FA had an opposite trend and a minimum during winter (Heck et al. Citation2009). Moreover, several studies reported the effect of diets supplemented with linseed and rapeseed on milk FA composition: according to a meta-analysis of Ferlay et al. (Citation2011), oilseed supplementation induces a decrease in milk short- and medium-chain FA percentages and a simultaneous increase in percentages of total FA with 18 carbons.
Currently, the most notable differences in the average composition of milk FA have been reported between Holstein-Friesian (HF) and Jersey breeds. Milk from Jersey cows tends to have greater concentration of some short- and medium-chain saturated FA, such as C6:0, C8:0, C10:0, C12:0 and C14:0 but lower concentration of some UFA, such as C14:1, C16:1 and C18:1 relative to milk from HF cows (Arnould & Soyeurt Citation2009). This variation could be exploited in a crossbreeding programme to achieve a preferred FA profile. Moreover, considering several studies summarised by Ferlay et al. (Citation2011), the French cattle breeds (Montbéliarde and Tarentaise) had different milk FA composition compared with HF cows. The majority of studies reported in the literature have dealt with FA composition of milk from HF cows, and only few papers investigated milk FA profile of other cattle breeds (Soyeurt et al. Citation2007; Maurice-Van Eijndhoven et al. Citation2013; Lopez-Villalobos et al. Citation2014).
Concentration of FA in milk is usually determined by gas chromatographic technique, which requires a highly skilled staff and is time expensive; this prevents the collection of phenotypes on a large scale. As recently reviewed by De Marchi et al. (Citation2014), the use of mid-infrared spectroscopy (MIRS) has great potentiality to predict milk FA concentration (Soyeurt et al. Citation2008; Penasa et al. Citation2015) as applied to a large date set in New Zealand dairy cattle with thousands of MIRS spectra from milk samples used for normal herd-testing to determine fat and protein concentration (Lopez-Villalobos et al. Citation2014). The present work aimed at describing the phenotypic variation of major milk FA groups and individual FA predicted by MIRS using a large data file of four Italian cattle breeds.
Materials and methods
Data and editing
Information on individual milk samples from purebred specialised dairy [HF and Brown Swiss (BS)] and dual-purpose [Simmental (SI) and Alpine Grey (AG)] cows spanning a 2-year period (January 2012 to December 2013) were retrieved from the database of the South Tirol Dairy Association (Bolzano, Italy) and the Breeders Association of Bolzano province (Bolzano, Italy). Samples were collected during routine cow milk testing, combined with preservative immediately after collection and processed according to International Committee for Animal Recording (ICAR) procedures at the milk laboratory of the South Tirol Dairy Association (Bolzano, Italy). The method of milk recording in Bolzano province during the period of the study was the ‘A4’, i.e. each cow was monthly (every 4 weeks) controlled for milk production and composition. Daily milk yield was the sum of morning and evening milkings, whereas milk composition was determined on morning or evening milking samples.
Milk fat, protein, casein, lactose, urea (MU) and FA were determined by Milko-Scan FT6000 using MIRS prediction models developed and commercialised by FOSS (FOSS Electric A/S, Hillerød, Denmark). In particular, FA traits (g/100 g total FA) considered in the present study were those reported in the FOSS Application Note 64 and included 7 groups, namely SFA, UFA, MUFA, PUFA, short-chain FA (SCFA), medium-chain FA (MCFA) and long-chain FA (LCFA), and 4 individual FA, namely C14:0, C16:0, C18:0 and C18:1. According to the Application Note 64, UFA were calculated as: UFA =100 − SFA. Information on individual FA included in each group can be retrieved from Hein et al. (Citation2016), who conducted a large study in Denmark using FA traits reported in FOSS Application Note 64. Measures of goodness of fit of MIRS prediction equations developed by FOSS (FOSS Electric A/S, Hillerød, Denmark) for individual and groups of FA are summarised in Table (FOSS, personal communication). The coefficients of determination of validation (R2v) underline that groups of FA are better predicted than individual FA. In particular, R2v of prediction models for groups of FA ranged from 0.72 (PUFA) to 0.98 (SCFA), and for individual FA were comprised between 0.55 (C16:0) and 0.81 (C18:1). Somatic cell count (SCC) was assessed by Cell Fossomatic 250 (FOSS Electric A/S, Hillerød, Denmark) and was transformed to SCS according to the formula SCS =3 + log2(SCC/100,000).
Table 1. Fitting statistics of mid-infrared prediction models for groups and individual fatty acids of bovine milk (FOSS, personal communication).
Editing procedure aimed at retaining records from cows between 6 and 450 days in milk (DIM) and from parity 1 to 15. Moreover, animals with less than 3 observations within lactation were discarded from the database. The normality assumption was checked for all the traits and records were deleted if they deviated more than 3.5 standard deviations from the respective mean of each trait. After editing, the dataset consisted of 153,801 observations from 14,301 cows and 1000 single-breed herds. The number of cows (herds) was 5277 (397) for BS, 4342 (270) for SI, 3258 (265) for AG and 1424 (68) for HF.
Statistical analysis
Data were analysed through a generalised linear model using the MIXED procedure of SAS (SAS Institute Inc., Cary, NC). The model was as follows:
where yijklmnop is the dependent variable, μ is the overall intercept of the model, Bi is the fixed effect of the ith breed (i = HF, BS, SI, AG), Mj is the fixed effect of the jth month of sampling (j = 1–12), Yeark is the fixed effect of the kth year of sampling (k = 2012, 2013); Sl is the fixed effect of the lth class of stage of lactation (l = 1–14, the first being a class from 6 to 30 d, followed by 12 classes of 30 d each, and the last being a class from 391 to 450 d); Paritym is the fixed effect of the mth class of parity of the cow (m = 1–5, with the last including parities 5 to 15); (B × M)ij is the fixed interaction effect between breed and month of sampling; (B × Year)ik is the fixed interaction effect between breed and year of sampling; (B × S)il is the fixed interaction effect between breed and stage of lactation; (B × Parity)im is the fixed interaction effect between breed and parity; (M × Year)jk is the fixed interaction effect between month and year of sampling; (S × Parity)lm is the fixed interaction effect between stage of lactation and parity; Hn(Bi) is the random effect of the nth herd nested within the ith breed ∼N(0,σ2herd(B)); Cowo(Bi) is the random effect of the oth cow nested within the ith breed ∼N(0,σ2cow(B)); and eijklmnop is the random residual ∼N(0,σ2e). Significance of breed effect was tested on the mean squares of herd within breed. A multiple comparison of means was performed for the main effect of breed, using Bonferroni’s test (p < .05).
Results
Descriptive statistics and significance of fixed effects
Descriptive statistics of milk and FA composition are reported in Table . The coefficient of variation for traditional milk traits ranged from 4% (lactose) to 76% (SCS). The overall mean for FA groups was 69.90 (SFA), 30.10 (UFA), 26.65 (MUFA), 3.32 (PUFA), 10.79 (SCFA), 43.86 (MCFA) and 31.40 (LCFA) g/100 g total FA, with a coefficient of variation between 5% (SFA) and 18% (PUFA). Regarding individual FA, C14:0, C16:0, C18:0 and C18:1 averaged 11.97, 31.85, 10.03 and 21.59 g/100 g total FA, respectively, with a coefficient of variation between 10% (C16:0) and 17% (C18:0 and C18:1). All fixed effects included in the model were highly significant (p < .001) in explaining the variation of milk FA composition, with the exception of year of sampling for SCS (p = .96). The first-order interaction effects between month and year, stage of lactation and parity, breed and parity, and breed and month were highly significant (p < .001) for all traits (data not shown).
Table 2. Descriptive statistics of milk yield, composition, urea, somatic cell score (SCS) and fatty acid (FA) profile.
Effect of breed
Data used in the present study were from single-breed herds and thus herd effect was nested within breed. Even if information on farm management of HF, BS, SI and AG cows was not available, it is likely that rearing conditions (including feeding) were different for the four breeds. Therefore, the breed-estimated effect could also account for a portion of management effect.
Least squares means of milk composition, MU, SCS and FA profile across breeds are reported in Table . The HF produced about 5 kg/d more milk than BS and SI, and ∼11 kg/d more milk than AG breed (p < .05). Brown Swiss cows yielded milk with greater fat, protein and casein percentages, and SCS compared with other breeds (p < .05). Milk urea averaged 21.06 mg/100 mL (Table ) and it was greater in milk of BS and AG than HF and SI breeds (p < .05; Table ).
Table 3. Least squares means of milk yield, composition, urea, somatic cell score (SCS) and fatty acid (FA) profile of cows of different breeds.
The AG cows produced milk with the lowest fat percentage (3.95%) and SFA content (68.67 g/100 g total FA), and with the greatest content of UFA (31.34 g/100 g total FA) and PUFA (3.19 g/100 g total FA) (p < .05). On the contrary, BS cows yielded milk with the greatest fat percentage (4.28%) and SFA content (70.18 g/100 g total FA), and the lowest content of UFA (29.66 g/100 g total FA) and MUFA (24.59 g/100 g total FA) (p < .05). Also, the BS breed showed the greatest content of SCFA (11.07 g/100 g total FA) and C14:0 (12.10 g/100 g total FA), and the lowest content of LCFA (30.53 g/100 g total FA) and C18:1 (20.94 g/100 g total FA) (p < .05). Holstein-Friesian breed produced milk with the lowest content of SCFA (10.04 g/100 g total FA) and C18:0 (9.58 g/100 g total FA), and the greatest content of C18:1 (22.89 g/100 g total FA) (p < .05). Finally, milk from SI breed exhibited greater content of MCFA (46.19 g/100 g total FA) compared with other breeds (p < .05) (Table ).
Effects of parity number, lactation stage and season
Least squares means of FA profile across parity for HF and BS, and SI and AG breeds are reported in Tables and , respectively. In all breeds, SFA were lower in primiparous than multiparous cows, whereas an opposite trend was detected for unsaturated FA groups. No relevant differences were highlighted across parities for SCFA and MCFA, whereas LCFA were higher in primiparous than multiparous cows. Regardless of the breed, the contents of C14:0 and C16:0 were lower, and those of C18:0 and C18:1 were higher in primiparous than multiparous cows. Trends of FA profiles through the lactation were similar across breeds (data not shown), and thus only least squares means adjusted by breed effect are presented in Table . The content of SFA in milk increased until 120 DIM and decreased thereafter, whereas UFA, MUFA and PUFA exhibited an opposite trend with minimum values at around 120–150 DIM. The content of SCFA was almost constant across lactation, whereas MCFA and LCFA showed specific patterns. In particular, MCFA content had a minimum at 60 DIM and increased thereafter until reaching a plateau between 180 and 450 DIM. Regarding LCFA, their content in milk decreased until 150 DIM and then increased slightly until the end of lactation. The variation of C14:0 across DIM resembled that of SFA, and C16:0 exhibited increasing values between calving and 90 DIM and reached a plateau thereafter. The contents of C18:0 and C18:1 showed an opposite trend compared with C14:0, with decreasing contents from calving to 210 and 150 DIM, respectively, and increasing values thereafter.
Table 4. Least squares means of milk fatty acid (FA) composition of Holstein-Friesian and Brown Swiss cattle breeds at different parities.
Table 5. Least squares means of milk fatty acid (FA) composition of Simmental and Alpine Grey cattle breeds at different parities.
Table 6. Least squares means of milk fatty acid (FA) composition at different stages of lactationTable Footnotea.
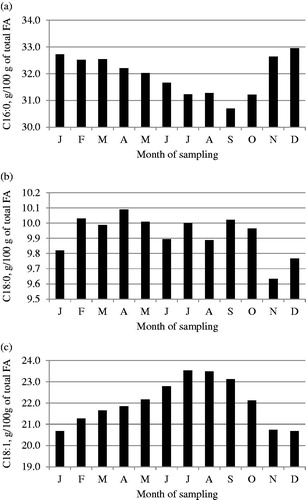
Least squares means of FA composition across month of sampling are depicted in Figures . Saturated FA, SCFA, MCFA and C16:0 content decreased during the summer season (June to September) and increased during fall, whereas an opposite trend was generally detected for UFA, LCFA and C18:1.
Figure 1. Least squares means of (a) saturated fatty acids (SFA) and (b) unsaturated fatty acids (UFA) across month of sampling.
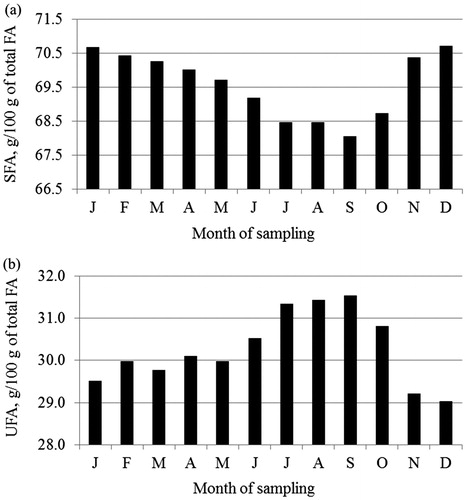
Figure 2. Least squares means of (a) short-chain fatty acids (SCFA), (b) medium-chain fatty acids (MCFA) and (c) long-chain fatty acids (LCFA) across month of sampling.
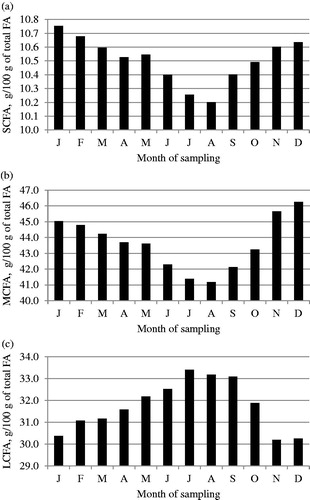
Figure 3. Least squares means of (a) C16:0, (b) C18:0 and (c) C18:1 fatty acids across month of sampling.
Discussion
Effect of breed
Penasa et al. (2015) reported a smaller superiority (about 3 kg/d) of HF over BS cows in higher input systems compared with the value (5 kg/d) of the present work. De Marchi et al. (Citation2007) carried out a field study to compare the milk composition of bulk milk samples from Alpine cattle breeds, and they demonstrated the superiority of BS for protein and fat contents compared with other cattle breeds. The level of MU in BS cows (21.03 mg/100 mL) was lower than the value reported by Samoré et al. (Citation2007) using a large dataset from 26 provinces of Italy (25.9 mg/100 mL), and the average value of MU (20.95 mg/100 mL) in milk of AG breed was lower than the value (28.95 mg/100 mL) reported by Bobbo et al. (Citation2014) in a mountain area close to Bolzano province (Italy). The management of the herd influences MU and Bobbo et al. (Citation2014) reported values of MU that were lower in modern than in traditional dairy systems of North of Italy. Nutrition, regarded both as feeding system (e.g. total mixed ration vs. conventional feeding and pasture) and diet composition, is probably one of the main factors differentiating farm systems in the present study. Concerning diet composition, dietary CP content is the most important nutritional factor influencing MU (Nousiainen et al. Citation2004). Nevertheless, MU is also affected by the dietary carbohydrate content: including adequate carbohydrates in the diet, which provides the energy for the rumen microbes to convert ammonia into microbial protein, is a way to reduce MU (Ishler Citation2008). Moreover, according to Ishler (Citation2008) it is possible that the different levels of MU among breeds are related to differences in rumen population metabolism and to a different capacity of the various breeds to recycle MU.
The comparison of milk FA composition among studies is difficult because of differences in the methodology used for its determination and in its expression. Also, most papers have been carried out on limited number of milk samples of HF breed and using gas-chromatography as reference method for the determination of FA composition. The present study and some others (Rutten et al. Citation2010; Lopez-Villalobos et al. Citation2014; Penasa et al. Citation2015) have used large data of FA predicted using MIRS at the moment of normal herd-testing for fat, protein and lactose or at a posteriori prediction. De Marchi et al. (Citation2011) investigated the potential of MIRS technology to predict FA profile of milk from BS cows; the comparison with our study however is not possible because FA were expressed on a milk basis in the study of De Marchi et al. (Citation2011) and as g/100 g total FA in the present research. Some consideration can be made through the comparison with other works. Mele et al. (Citation2009) analysed milk of 990 Italian HF cows reared in 34 commercial herds and reported lower content of MUFA (19.97%), C14:0 (9.18%), C16:0 (24.75%) and C18:0 (9.04%) compared with the present study. Soyeurt et al. (Citation2007) obtained values of SFA (70.72%), MUFA (25.35%), C14:0 (11.09%), C16:0 (30.76%), C18:0 (12.44%) and C18:1 (23.63%) in milk of HF breed that were comparable with findings of our study. Also Malacarne et al. (Citation2001), in a study on 40 herds of 4 different breeds sampled in mid-late lactation from September to November, found similar values for HF breed, even if they reported a greater value for C18:0 (11.37%). The same authors reported results of Italian Brown milk FA, showing similar levels of C14:0 (12.21%), lower levels of C16:0 (29.78%) and greater levels of C18:0 (11.71%) and C18:1 (24.55%), as well as data on Reggiana and Modenese, which are dairy cattle breeds typical of north Italy. Both the latter breeds were found to have greater C14:0 (12.29 and 12.77%, respectively), C:18:0 (11.32 and 11.33%) and C:18:1 (23.64 and 23.44%) and lower levels of C16:0 (31.26 and 30.61%) compared with breeds considered in the present study. Other comparable data comes from Niero et al. (Citation2016) and Renna et al. (Citation2014) who investigated milk yield, milk quality and FA composition of Burlina, a typical local cattle breed of northeast Italy, and Aosta Red Pied breed, typical of northwest Italy. Milk from Burlina and Aosta Red Pied cows exhibited lower content of C14:0 (11.11 and 10.18%, respectively), C16:0 (29.16 and 28.17%) and C:18:0 (7.95 and 6.58%) compared with Holstein-Friesian, Brown Swiss, Simmental and Alpine Grey cows studied in the present work. Moreover, Burlina milk fat was characterised by higher amount of SFA (72.02%) and PUFA (4.27%), and lower amount of UFA (27.90%) and MUFA (23.53%) if compared with other breeds. The content of groups of FA in milk of Aosta Red Pied breed was in general lower than that of breeds investigated in the present study. Calculations from Renna et al. (Citation2014) for groups of FA were however conducted differently than calculations from Niero et al. (Citation2016) and because of major differences, it appears that they were not comparable with values of the present report.
Effects of parity number, lactation stage and season
The effect of parity on FA composition has been widely investigated in the literature, with contrasting results. Kgwatalala et al. (Citation2009) reported no parity effect on milk FA composition of Canadian HF cows, whereas Kelsey et al. (Citation2003) observed significant effect of parity on most of the milk FA studied in US Holsteins. Also, Bilal et al. (Citation2014) reported a relatively greater proportion of desirable FA in milk of primiparous than multiparous Canadian HF cows, but no parity effect on C16:0 and C18:0. The mammary gland of a primiparous cow is metabolically less active than that of later parity animals, leading to a lower expression of FA synthase in the mammary gland (Miller et al. Citation2006). This could explain the lower content of C14:0 and C16:0 in first lactation cows, as C14:0 and ∼50% of C16:0 are synthesised de novo in the mammary gland. Similar results were observed by Niero et al. (Citation2016) in Burlina breed, whose primiparous cows showed significantly lower levels of C16:0 and significantly higher levels of C18:1n9 with respect to cows of the other parities. Moreover, primiparous cows have on average lower rumen capacity and consequently lower dry matter intake and higher passage rate along the first two-thirds of the lactation, as well as lower capacity to adapt to the lactation diet (i.e. capacity to absorb volatile FA produced by diet fermentation). This could have affected the levels of groups and individual FA across parity through a variation in the ruminal fermentation pattern toward a more acidogenic condition (Ramirez Ramirez et al. Citation2016) leading to an increment of UFA, including both MUFA and PUFA. Again, a similar trend was observed in Burlina breed (Niero et al. Citation2016) since the primiparous cows showed higher levels of UFA (29.96 vs an average of 27.12%) and MUFA (25.36 vs an average of 22.87%), and lower levels of SFA (69.72 vs an average of 72.78%) if compared to other parity cows. Primiparous cows are more susceptible to developing acidosis after parturition than multiparous cows (Krause & Oetzel Citation2006). Moreover, after experiencing acidosis, cows become more susceptible to subsequent bouts of acidosis and can suffer long-term consequences in terms of health and productivity (Dohme et al. Citation2008).
Regarding the variation of FA composition across DIM, results from the present study confirmed those of Palmquist et al. (Citation1993), Soyeurt et al. (Citation2008) and Mele et al. (Citation2009). During the first period of lactation (within 100 DIM) cows are more likely in a negative energy balance and they use preformed LCFA mobilised from body fat reserves for milk production, whereas there is a larger contribution to milk from de novo FA as lactation progresses (Palmquist et al. Citation1993). The greater C18:0 and C18:1 content at the beginning of lactation is responsible for the inhibition of the mammary gland lipogenic enzymes that synthesise de novo FA, especially C14:0 and ∼50% of C16:0, positively correlated with high serum low density lipoprotein cholesterol levels (Palmquist et al. Citation1993; Mele et al. Citation2009). Similar results were confirmed also by Niero et al. (Citation2016) in Burlina cows which showed lower C14:0 and C16:0, and greater C18:0 and C18:1n9 at the beginning of lactation.
The effect of sampling month may be explained by specific management practices throughout the year. Herds included in the present study were located in a mountainous area where cows are often given access to pasture from June to September. It should be considered that the FA profile of cow milk fat is also significantly affected by temperature and humidity which can act directly on the animals or indirectly affecting forage quality (Renna et al. Citation2010).
Conclusions
Breed was an important factor to explain the variation of FA composition of milk, along with the stage of lactation and parity. Alpine Grey breed presented the best FA composition with lower content of SFA and greater content of UFA, especially MUFA, PUFA and C18:1. The variation of FA during lactation was very different between SFA and other groups of FA as well between C14:0 and C16:0 and the other individual FA. The knowledge of important factors affecting milk FA composition may aid in defining genetic and management strategies to obtain milk with a desired FA profile. However, further research is needed to focus on feeding practices of the herds to better disentangle the breed and management effects on milk FA composition.
Acknowledgements
The authors thank the South Tirol Dairy Association (Bolzano, Italy) and the Breeders Association of Bolzano province (Bolzano, Italy) for providing data used in the present study.
Disclosure statement
The authors declare that there is no conflict of interest associated with this paper. The authors alone are responsible for the content and writing of this article.
Related Research Data
References
- Arnould VMR, Soyeurt H. 2009. Genetic variability of milk fatty acids. J Appl Genet. 50:29–39.
- Bilal G, Cue RI, Mustafa AF, Hayes JF. 2014. Effects of parity age at calving and stage of lactation on fatty acid composition of milk in Canadian Holsteins. Can J Anim Sci. 94:401–410.
- Bobbo T, Cecchinato A, Cipolat-Gotet C, Stocco G, Bittante G. 2014. Effect of breed and dairy system on milk composition and udder health traits in multi-breed dairy herds. Acta Agr Kapos. 18:81–88.
- Comino L, Righi F, Coppa M, Quarantelli A, Tabacco E, Borreani G. 2015. Relationships among early lactation milk fat depression, cattle productivity and fatty acid composition on intensive dairy farms in Northern Italy. Ital J Anim Sci. 14:350–361.
- De Marchi M, Dal Zotto R, Cassandro M, Bittante G. 2007. Milk coagulation ability of five dairy cattle breeds. J Dairy Sci. 90:3986–3992.
- De Marchi M, Penasa M, Cecchinato A, Mele M, Secchiari P, Bittante G. 2011. Effectiveness of mid-infrared spectroscopy to predict fatty acid composition of Brown Swiss bovine milk. Animal. 5:1653–1658.
- De Marchi M, Toffanin V, Cassandro M, Penasa M. 2014. Invited review: mid-infrared spectroscopy as phenotyping tool for milk traits. J Dairy Sci. 97:1171–1186.
- Dohme F, DeVries TJ, Beauchemin KA. 2008. Repeated ruminal acidosis challenges in lactating dairy cows at high and low risk for developing acidosis: ruminal pH. J Dairy Sci. 91:3554–3567.
- Ferlay A, Glasser F, Martin B, Andueza D, Chilliard Y. 2011. Effects of feeding factors and breed on cow milk fatty acid composition: recent data. Bull UASVM Vet Med. 68:137–145.
- German JB, Gibson RA, Krauss RM, Nestel P, Lamarche B, van Staveren WA, Steijns JM, de Groot LCPGM, Lock AL, Destaillats F. 2009. A reappraisal of the impact of dairy foods and milk fat on cardiovascular disease risk. Eur J Nutr. 48:191–203.
- Gross J, van Dorland HA, Bruckmaier RM, Schwarz FJ. 2011. Milk fatty acid profile related to energy balance in dairy cows. J Dairy Res. 78:479–488.
- Heck JML, van Valenberg HJF, Dijkstra J, van Hooijdonk ACM. 2009. Seasonal variation in the Dutch bovine raw milk composition. J Dairy Sci. 92:4745–4755.
- Hein L, Buitenhuis AJ, Gregersen SB, Larsen LB, Demirovic D, Warnecke S, Nielsen NH, Munk A, Sørensen LP, Pedersen J, Kargo M. 2016. Detailed milk fatty acid profiling of the Danish dairy cattle population. Proceedings of the 40th International Committee for Animal Recording (ICAR) Meeting, 24–28 October, Puerto Varas, Chile.
- Huth PJ, Park KM. 2012. Influence of dairy product and milk fat consumption on cardiovascular disease risk: a review of the evidence. Adv Nutr. 3:266–285.
- Ishler V. 2008. Interpretation of milk urea nitrogen (MUN) values [Internet]. Philadelphia: Penn State University, Department of Animal Science; [cited 2016 Mar 9]. Available from: http://extension.psu.edu/animals/dairy/nutrient-management/certified-dairy/tools/interpretation-of-mun-values/
- Kelsey JA, Corl BA, Collier RJ, Bauman DE. 2003. The effect of breed, parity, and stage of lactation on conjugated linoleic acid (CLA) in milk fat from dairy cows. J Dairy Sci. 86:2588–2597.
- Kgwatalala PM, Ibeagha-Awemu EM, Mustafa AF, Zhao X. 2009. Stearoyl-CoA desaturase 1 genotype and stage of lactation influences milk fatty acid composition of Canadian Holstein cows. Anim Genet. 40:609–615.
- Krause KM, Oetzel GR. 2006. Understanding and preventing subacute ruminal acidosis in dairy herds: a review. Anim Feed Sci Technol. 126:215–236.
- Lopez-Villalobos N, Spelman RJ, Melis J, Davis SR, Berry SD, Lehnert K, Holroyd SE, MacGibbon AKH, Snell RG. 2014. Estimation of genetic and crossbreeding parameters of fatty acid concentrations in milk fat predicted by mid-infrared spectroscopy in New Zealand dairy cattle. J Dairy Res. 81:340–349.
- MacGibbon AKH, McLennan WD. 1987. Hardness of New Zealand patted butter: seasonal and regional variations. NZ J Dairy Sci Tech. 22:143–156.
- Malacarne M, Summer A, Formaggioni P, Franceschi P, Mariani P. 2001. Composizione in acidi grassi del grasso del latte di quattro razze bovine allevate nella zona di produzione del Parmigiano-Reggiano. Ann Fac Med Vet. 21:249–259.
- Marseglia A, Caligiani A, Comino L, Righi F, Quarantelli A, Palla G. 2013. Cyclopropyl and ω-cyclohexyl fatty acids as quality markers of cow milk and cheese. Food Chem. 140:711–716.
- Maurice-Van Eijndhoven MHT, Bovenhuis H, Soyeurt H, Calus MPL. 2013. Differences in milk fat composition predicted by mid-infrared spectrometry among dairy cattle breeds in the Netherlands. J Dairy Sci. 96:2570–2582.
- Mele M, Dal Zotto R, Cassandro M, Conte G, Serra A, Buccioni A, Bittante G, Secchiari P. 2009. Genetic parameters for conjugated linoleic acid, selected milk fatty acids, and milk fatty acid unsaturation of Italian Holstein-Friesian cows. J Dairy Sci. 92:392–400.
- Miller N, Delbecchi L, Petitclerc D, Wagner GF, Talbot BG, Lacasse P. 2006. Effect of stage of lactation and parity on mammary gland cell renewal. J Dairy Sci. 89:4669–4677.
- Niero G, Visentin G, Ton S, De Marchi M, Penasa M, Cassandro M. 2016. Phenotypic characterisation of milk technological traits, protein fractions, and major mineral and fatty acid composition of Burlina cattle breed. Ital J Anim. Sci. 15:576–583.
- Nousiainen J, Shingfield KJ, Huhtanen P. 2004. Evaluation of milk urea nitrogen as a diagnostic of protein feeding. J. Dairy Sci. 87:386–398.
- Palmquist DL, Beaulieu AD, Barbano DM. 1993. Feed and animal factors influencing milk fat composition. J Dairy Sci. 76:1753–1771.
- Penasa M, Tiezzi F, Gottardo P, Cassandro M, De Marchi M. 2015. Genetics of milk fatty acid groups predicted during routine data recording in Holstein dairy cattle. Livest Sci. 173:9–13.
- Poulsen NA, Gustavsson F, Glantz M, Paulsson M, Larsen LB, Larsen MK. 2012. The influence of feed and herd on fatty acid composition in 3 dairy breeds (Danish Holstein, Danish Jersey, and Swedish Red). J Dairy Sci. 95:6362–6371.
- Ramirez Ramirez HA, Harvatine KJ, Kononoff PJ. 2016. Short communication: forage particle size and fat intake affect rumen passage, the fatty acid profile of milk, and milk fat production in dairy cows consuming dried distillers grains with solubles. J. Dairy Sci. 99:392–398.
- Renna M, Cornale P, Lussiana C, Battaglini LM, Turille G, Mimosi A. 2014. Milk yield, gross composition and fatty acid profile of dual-purpose Aosta Red Pied cows fed separate concentrate-forage versus total mixed ration. Anim Sci J. 85:37–45.
- Renna M, Lussiana C, Malfatto V, Mimosi A, Battaglini LM. 2010. Effect of exposure to heat stress conditions on milk yield and quality of dairy cows grazing on Alpine pasture. Proc. 9th European IFSA Symp., 4–7 July, Vienna, Austria; p. 1338–1348.
- Rønholt S, Mortensen K, Knudsen JC. 2013. The effective factors on the structure of butter and other milk fat-based products. Compr Rev Food Sci Food Saf. 12:468–482.
- Rutten MJM, Bovenhuis H, van Arendonk JAM. 2010. The effect of the number of observations used for Fourier transform infrared model calibration for bovine milk fat composition on the estimated genetic parameters of the predicted data. J Dairy Sci. 93:4872–4882.
- Samoré AB, Romani C, Rossoni A, Frigo E, Pedron O, Bagnato A. 2007. Genetic parameters for casein and urea content in the Italian Brown Swiss dairy cattle. Ital J Anim Sci. 6(Suppl. 1):201–203.
- Soyeurt H, Dardenne P, Dehareng F, Bastin C, Gengler N. 2008. Genetic parameters of saturated and monounsaturated fatty acid content and the ratio of saturated to unsaturated fatty acids in bovine milk. J Dairy Sci. 91:3611–3626.
- Soyeurt H, Gillon A, Vanderick S, Mayeres P, Bertozzi C, Gengler N. 2007. Estimation of heritability and genetic correlations for the major fatty acids in bovine milk. J Dairy Sci. 90:4435–4442.
- Zyriax BC, Windler E. 2000. Dietary fat in the prevention of cardiovascular disease - a review. Eur J Lipid Sci Technol. 102:355–365.