
Abstract
A farm gate-to-plant gate life cycle assessment was performed to estimate the environmental impact of Asiago Protected Designation of Origin (PDO) cheese, the fourth most produced Italian PDO cheese. One manufacturing plant were surveyed for primary data. Emphasis was given to manufacturing processes, wherein environmental hotspots were identified. However the farm phase was discussed in order to obtain a clear prospect of Asiago cheese production. Inputs and outputs at the plant, such as cheese ingredients, fuels, electricity, water, cleaning agents, packaging, waste, and associated transport were included. Asiago cheese was the main product and co-products were other cheeses and liquid whey. Raw milk, other materials and energy flows were allocated using economic allocation strategy, while salt was attributed using plant specific information. Scenario analysis was about allocation strategies and time of cheese aging. SimaPro© 8.1.1 was the modelling software. Ecoinvent® v3.1 database was used for upstream processes. Climate change and energy consumption per kg of Asiago cheese was 10.1 kg CO2-eq and 70.2 MJ, respectively. Uncertainty analysis gave 95% confidence interval of 6.2–17.5 kg CO2-eq and 41.8–115 MJ per kg of Asiago cheese. The main impact driver was raw milk production. At the plant, electricity and fuels usage, refrigerants, packaging and wastewater treatment had the highest contribution to the overall impacts, except for fresh water eutrophication where wastewater treatment had the largest impact. Energy and fuel consumption were the crucial “hot spots” to focus on for efficiency and mitigation procedures at plant.
Introduction
Increasingly, producers are giving attention to environmental sustainability in food production by seeking improved resource-use efficiency and aiming to sell eco-friendly products in order to enter new markets of consumers who are increasingly concerned about the environmental impacts of food. The Italian dairy industry has become more conscious of the environmental impacts of their activities, performing studies to determine the sources of impacts and to develop mitigation options.
Italy is the third largest European cheese producer (11%) (Clal Citation2015) and the fourth largest globally (6%) (FAOSTAT Citation2014). In 2014, Italy produced over 11 million metric tonnes (mt) of milk and 1 million mt of cheese (Clal Citation2015). Italian dairy industry is based on cheese production (Sumner Citation2013). Approximately 25% of Italian cheese production existing under the Protected Designation of Origin (PDO) (Assolatte Citation2015). PDO cheese is made with milk produced in defined production areas and follows a prescribed manufacturing process with rigorous specifications, and roughly 51% of all Italian milk (50% cows, 80% ewes and goats, 78% buffalos) is used to manufacture PDO cheese (Sumner Citation2013). PDO cheese made with cow’s milk reached 433,000 mt in 2014, which made up 44% of the cow’s milk cheese market in Italy (Clal Citation2015). Particularly, Asiago is a PDO cheese which is produced from cow’s milk in two regions (Veneto and Trentino) in North-eastern Italy. Asiago cheese production was 21,458 mt (1,600 mt were exported) in 2014, ranking the fourth most produced Italian PDO cheese (Clal Citation2015). Asiago cheese must comply specific production guidelines (Disciplinare di Produzione DOP “Asiago” Citation2006), which define specific restrictions regarding classification; production area; cow feeding; product traceability; manufacturing processes; identification and branding; conservation and aging processes; chemical and organoleptic features; and packaging. Furthermore, there are three types of Asiago cheese: “pressato", “d’allevo”, and “prodotto della montagna". For Asiago “pressato”, the fat, protein, and moisture content must be 30% (± 4.0), 24% (±3.5), and 39.5% (±4.5), respectively. While for Asiago “d’allevo”, the fat, protein, and moisture content must be 31% (± 4.0), 28% (±3.5), and 34.5% (± 4.5), respectively. Asiago cheese is often manufactured in small plants located in rural areas using traditional methods, and represents a pillar that supports a traditional Italian industry with significant cultural and social importance, therefore understanding its environmental sustainability is important. This is particularly true because of the expected Italian increase of PDO cheese production in the future (Clal Citation2015).
Life cycle assessment (LCA) is a technique for assessing the potential environmental impacts and relative hotspots associated with a product, process, or service throughout its lifetime (ISO Citation2006), and it is used to quantify mitigation and efficiency improvements. LCA can be used to measure the environmental impacts of PDO cheese (González-García, Hospido et al. Citation2013).
Various LCAs on dairy products are present in literature. These LCAs have differences in typology of analysed dairy product and country, system boundaries, functional unit, allocation and estimated impact categories, which lead to difficulties in making exact comparisons. Analyzed dairy products are fluid milk, such as fluid milk in the US (Thoma et al. Citation2013) and fluid milk in Italy (Fantin et al. Citation2012), or butter, such as Italian butter (Bianconi et al. Citation1998; Masoni et al. Citation1998) and butter in the UK, Germany, and France (Nilsson et al. Citation2010), or yogurt, like the Spain one (González-García et al. Citation2013a). Furthermore, there are LCAs on the cheese lifecycle, some of them consider the production of cheese, such as Dutch semi-hard cheese production (van Middelaar et al. Citation2011), Portuguese mature cheese production (González-García et al. Citation2013b), Serbian cheese production (Djekic et al. Citation2014) and Swedish cheese production (Flysjö et al. Citation2014), but others consider the whole lifecycle, including consumption, such as Swedish semi-hard cheese (Berlin Citation2002), world-wide cheese (Guinard et al. Citation2009), cheddar cheese and mozzarella cheese in the US (Kim et al. Citation2013). In some LCAs on cheese the functional unit is kg of cheese as sold (Berlin Citation2002; González-García et al. Citation2013b) or others use kg of dry matter consumed (Kim et al. Citation2013). Only few LCAs on PDO cheeses are reported in literature (Fornasari, Citation2013; González-García, Hospido et al. Citation2013; Barjolle et al. Citation2015), where González-García, Hospido et al. (Citation2013) was the analysis of a Spain PDO cheese production, while Fornasari (Citation2013) included the distribution and consumption phases for PDO cheese. Different authors determined different environmental impacts: Flysjö et al. (Citation2014) quantified the carbon footprint of cheese production, while Djekic et al. (Citation2014), González-García et al. (Citation2013b) and Kim et al. (Citation2013) estimated more than one environmental impact categories (such as energy demand, eutrophication, acidification, ozone layer depletion, photo chemical oxidant formation, human toxicity). Berlin (Citation2002), Kim et al. (Citation2013) and the abovementioned authors agree that cheese manufacturing is the second-largest contributor to post-farm gate environmental impacts, while post-manufacturing plant activities such as distribution, retail, consumption, and final disposal have lower relative contribution when they are compared to cheese plant overall impact (Fornasari Citation2013; Kim et al. Citation2013). As reported by Fornasari (Citation2013), González-García, Hospido et al. (Citation2013), Kim et al. (Citation2013) and Guinard et al. (Citation2009) energy usage is the main emission drivers at plant. Allocation is critical in LCAs on cheese, influencing final emissions per functional unit. The application of just one allocation strategy is not sufficient for decision making, considering the influence of allocation strategy on the LCA results, thus a comparison of different allocation strategies is crucial and suggested in order to consider LCA as a decision support tool (Luo et al. Citation2009). Economic allocation strategy (based on the revenue from each plant product) was used by Berlin (Citation2002), Nilsson et al. (Citation2010), van Middelaar et al. (Citation2011) and Fornasari (Citation2013). Kim et al. (Citation2013) performed a LCA study where economic allocation and milk solids allocation strategies (base on milk solids content of each plant product) were applied, while the impacts have been totally assigned to cheese without using allocation strategy in González-García, Hospido et al. (Citation2013). The time of cheese aging is one of the most sensitive inputs in the cheese-making process (Aguirre-Villegas et al. Citation2012), and its impact is derived mainly from electricity, heating, and refrigerants (Kim et al. Citation2013) that are used to maintain proper aging conditions. Ramirez et al. (Citation2006) estimated that cheese storage uses 24% of energy consumption for cheese processing, while Xu et al. (Citation2009) reported that cheese aging and storage contribute 32% (9–65%) of total energy used in the global cheese industry. Furthermore, Kim et al. (Citation2013) showed that long aging (60 months) can increase CC by 6% and 22% per kg of cheese in cradle-to-plant gate and from the farm gate-to-plant gate assessment, respectively. Additionally, long aging has an impact on TO, which is primarily associated with increased electricity use for additional refrigeration.
Improving the sustainability of dairy cheese sector is a global issue in order to reduce environmental impacts from that sector. PDO cheese production represents an important part of the international and Italian dairy sector, however nowadays a limited number of studies on environmental impacts arising from PDO cheese production are present in literature. We consider a useful contribution to improve the sustainability of dairy sector to provide this first study on the potential environmental impacts arising from Asiago PDO cheese production, which has a strategical role in the Italian PDO cheese sector and which is facing an increase of production and export. This study has a great emphasis on the production plant, and the results may will help producers to underline inefficacies and to improve sustainability.
Materials and methods
Goal and scope definition
The goal of this study is to quantify potential environmental impacts and point out the principal impact drivers in Asiago PDO cheese production for the purpose of highlighting opportunities for improving environmental sustainability. The scope regards a farm gate-to-plant gate LCA and a great emphasis is given to the production cheese plant, although some data and discussion of the farm phase were integrated in the study. The LCA was based on the ISO 14040–14044 methodologies (ISO Citation2006) and ISO TS ISO 14067 methodology (ISO Citation2013).
Functional unit
The functional unit was one kg of Asiago cheese produced (37.7% moisture content) at the plant gate and ready-to-sell to wholesale/retail after an aging time (28 days). We consider that the chosen function unit (1 kg of Asiago cheese) is the most suitable one to represent the cheese production and the main addressees of the this study, that are stakeholders of cheese manufacturing chain. Liquid whey and other cheese, produced together with Asiago cheese in the plant, were also sources of revenue and therefore were considered as co-products of Asiago cheese. As abovementioned in Introduction section, there are three types of Asiago PDO cheese: “pressato”, “d’allevo”, and “prodotto della montagna”. This study did not consider “prodotto della montagna” Asiago PDO cheese because it is particular production manufactured during the summer in the highlands. Moreover, this study did not differentiate “pressato” and “d’allevo” Asiago PDO cheese, which are commonly produced in the same facility, but given the inability to collect data for a particular type of Asiago cheese and because data were collected at a plant level, we reported a combination of these two cheese. However, a scenario analysis, based on time of cheese aging, presents the differentiation of these two type of Asiago cheese.
System boundaries
The system boundaries encompassed raw milk production at farm and upstream emissions all the way up to the cheese plant gate, including the waste management of the plant (Figure ). Notably, this study is not a detailed engineering analysis, and some data were available only at the whole plant scale, therefore there was not direct assignation to a specific cheese-making operation.
Figure 1. System boundaries of Asiago cheese production.
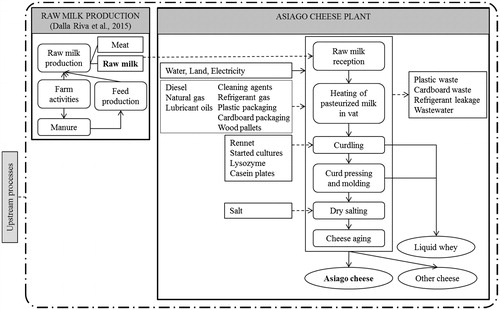
Cheese manufacturing was modelled as: raw milk collection at farm and transport to the cheese plant, raw milk refrigeration and pasteurisation, heating of pasteurised milk in vat, curdling, curd pressing and moulding, dry salting, and cheese aging. Cheese was generally sold as whole wheels and transported to retail centres. The inventory includes all inputs and outputs such as fuels, electricity, water, cleaning agents, packaging materials, waste. Furthermore, transport of inputs and waste were included in the model. All cheese ingredients were inventoried, but the environmental impacts were not identified for some (rennet, started cultures, lysozyme, and casein plates) due to the annual consumption (< 0.01% of total input mass) and/or the lack of data to estimate their impacts (González-García et al. Citation2013a). The production of capital goods (machinery, buildings, infrastructures, and equipment) and employee-related activities were excluded from the study following Berlin (Citation2002) and González-García, Hospido et al. (Citation2013); although they were included in some Ecoinvent® processes (Fantin et al. Citation2012). The post-plant gate stages such as retailer distribution and customer consumption were excluded due to a lack of detailed data and in light of this study’s focussed aim of estimating the environmental impacts of the manufacturing stage.
Life cycle inventory
Information and data reported by Dalla Riva et al. (Citation2015) were used to model impacts of raw milk production (Figure and Table ). One Asiago cheese plant was surveyed for the analysis, and the plant worked milk deriving by 65 dairy farms. Dalla Riva et al. (Citation2015) surveyed 34 dairy farms, which produced the 75% of milk collected from the 65 farms and processed by the plant. Table shows the primary data for farm gate-to-plant gate perspective: in 2014, primary data for 2013 were collected through personal interviews with plant operators. The Ecoinvent® v3.1 default system model (Weidema et al. Citation2013) database was used for upstream processes, emissions, and waste treatments related to primary data. SimaPro© 8.1.1 was the modelling software used (PRé Consultants The Netherlands Citation2014).
Table 1. Inventory data, before allocation, at farm phase and at the plant. Transport and explanation of economic allocation model are shown for farm gate-to-plant gate perspective.
The cleaning agents used in the plant were broken down into their active ingredients, and the environmental impacts for each of these were taken into account. When a specific active ingredient was not available in the background database, a substitute was utilised that was chemically similar. The transport processes were adopted from the Ecoinvent® v3.1 database (Weidema et al. Citation2013). The transport distance (km) of delivered materials was included in the study (Table ). Where available, actual transport data were used (derived from plant-specific information). Where data of actual transport distance were not available and where background data of transport distance of Ecoinvent® v3.1 database (Weidema et al. Citation2013) were not appropriate, a transport distance was assumed. For example, 500 km transport was assumed for waste (cardboard, plastic, lubricant oil, and wood pallets) disposal, following a similar approach used by González-García et al. Citation2013a, Citation2013b). Moreover in cases where the origin of the materials was unknown and in cases where an input was composed by multiple ingredients with potentially different transport distances (such as cleaning agents and fuels) the Ecoinvent® v3.1 database (Weidema et al. Citation2013) was used.
The plant had not the equipment to treat the wastewater derived by plant processes, therefore wastewater was directly discharged into municipal wastewater collector and treated at a municipal wastewater treatment plant. The municipal wastewater treatment plant was modelled using Ecoinvent® v3.1 database (Weidema et al. Citation2013). The cardboard and plastic waste generated by the plant were treated using three treatments (recycling, municipal incineration, and landfill treatment according ARPA (Citation2013) and ISPRA (Citation2014)). ISPRA (Citation2014) was used to assume the percentages of cardboard and plastic waste treated into recycling, municipal incineration, and landfill treatment. While wood pallet waste and lubricant oil waste were disposed by municipal incineration according plant-specific information. Municipal incineration and landfill treatments were modelled using Ecoinvent® v3.1 database (Weidema et al. Citation2013), while specific Italian recycling unit processes were adopted for cardboard and plastic waste, based on Arena et al. (Citation2004) and Perugini et al. (Citation2005).
Allocation
The surveyed plant was a multi-output system, so allocation was necessary to assign resources and emissions to each product. The default allocation model is called Economic allocation Model (EM), which was based on simultaneous use of plant-specific information, called system separation of resource assignment (Kim et al. Citation2013), and use of economic allocation strategy (based on revenue derived from each product, which was based on the sales quantity and the mean price per kg of product obtained by averaging annual prices from 2009–2013, in order to attenuate price volatility and inflation effects) for remaining unassigned resources. In Table the combination of plant-specific information and allocation strategy are shown for each resource at plant. System separation was used where plant-specific information was available to assign a specific resource and its amount to a specific product. For example, this situation is clear for salt and minor ingredients of cheese, and related transport. Salt and its transport were assigned exclusively to cheese and other cheese based on plant-specific information; specifically, a dry salting process was used during manufacturing, which allows separation of the liquid whey system from the cheese system for assignment of salt burdens. Other minor ingredients such as rennet, starter cultures, lysozyme, casein plates, and pelures, were also assigned, based on plant-specific information, to cheese and other cheese, as separate systems from liquid whey). In case specific information were not available, economic allocation strategy has been used for: incoming raw milk, inputs (electricity, fuels, lubricant oils, refrigerants, water, cleaning agents, land), packaging (corrugated cardboard boxes, plastics, wood pallets), solid wastes (lubricant oils, refrigerants, packaging waste), and wastewater.
Life cycle impact assessment
The environmental impact categories evaluated in the LCA were climate change (CC), ozone depletion (OD), terrestrial acidification (TA), freshwater eutrophication (FE), toxicity (TO: sum of human-terrestrial-freshwater-marine toxicity), photochemical oxidant formation (POF), land occupation (LO: sum of agricultural and urban), and water depletion (WD) using ReCiPe midpoint (H) V1.11 (Goedkoop et al. Citation2009). Cumulative energy demand (CED) was also accounted (Frischknecht, Jungbluth, Althaus, Doka et al. Citation2007). Normalization and uncertainty analysis were performed, and both analyses are explained and discussed in the last part of Results and discussion section.
Scenario analyses
Two scenario analyses (allocation strategy and time of cheese aging) were performed in order to test the robustness of the results.
The first scenario analysis evaluated how an alternate allocation strategy can influence the emissions per kg of cheese. The scenario analysis was carried out using an allocation strategy based on milk solids content (Milk Solids allocation Model, MSM). Each of the various milk solids of the incoming raw milk (fat, protein, lactose, ash) can be conceptually considered as a singular input, which is destined to different products (Kim et al. Citation2013). Therefore the milk solids content of each product became the allocation key, in conjunction with plant-specific information, following the EM. The milk solids allocation strategy in MSM was applied for all resources at manufacturing plant in order to provide a comparison with the economic allocation model (EM) and to assess the robustness of conclusions based on EM.
The time of cheese aging is one of the most sensitive inputs in the cheese-making process (Aguirre-Villegas et al. Citation2012). In our study the manufacturing data were available for the entire dairy plant; thus, a scenario analysis based on literature data was performed in order to differentiate Asiago PDO “pressato” (20 days of aging) and “d’allevo" (180 days of aging). Climate change and cumulative energy demand categories were investigated in the aging scenario. Actual primary data for cheese aging was not available at the plant, therefore we assumed this data from literature: 0.157 kWh per kg of cheese per day were assumed to age the cheese, according Karousou et al. (Citation2010). In fact, Karousou et al. (Citation2010) estimated environmental impacts of Parmigiano Reggiano PDO cheese, another Italian PDO cheese, which is produced in bordering regions and with similar aging room parameters of Asiago PDO cheese, thus we considered this data suitable to represent Asiago PDO cheese aging scenario. According to Xu et al. (Citation2009) electricity and natural gas are used in aging cheese in the ratio of 33.5% electricity and 66.5% natural gas; we used this ratio in assigning whole plant energy data to the aging process. The total aging energy was calculated for the two types of Asiago cheese using number of aging days and energy requirement per day. This energy was removed from the plant total in order to highlight the impact of aging. All other material flows were allocated between the two types of Asiago PDO, other cheeses, and liquid whey, using EM and MSM.
Results and discussion
Life cycle impact assessment results
The analysis, results and discussion were done at the plant level, despite that milk production at farm was the main contributor, except for OD where cheese manufacturing was main contributor (Table ). Farm impacts were mainly caused by feed production. Soybean and corn, used as main ingredients in concentrate feed for lactating cows, determined the main impacts related to purchased feed, while corn silage production drove the impacts of on-farm feed production. In feed production, main drivers were fertiliser (nitrogen and phosphorus released in water during fertiliser application were main cause for FE and TA, respectively), water for irrigation and land use for cultivation. Enteric CH4 and N2O from manure management were main contributors to CC, while minor impacts derived by transport of off-farm inputs and field/cowshed operations.
Table 2. Environmental impact per 1 kg of Asiago cheese from cradle-to-plant gate, for economic allocation model.
The manufacturing stage was the main contributor in all impact categories (Figure ), without considering the farm phase into the analysis. Figure shows a detailed contribution at whole plant level of the drivers in the manufacturing stage for each impact category. Electricity was the largest contributor to CED, TA, CC and POF, and it was second largest contributor to LO. Fuels and lubricant oil were the second contributors to CED, CC, TA. TO was mainly derived from heavy metals released by usage of diesel, natural gas and electricity during cheese-making process and transport of resources to the plant. Waste treatment (mainly wastewater treatment) was the main contributor to FE. Refrigerant leakage was major responsible for OD. Raw milk transportation was the main driver for TO and secondary for POF. In LO, the largest influence came from packaging (mainly cardboard packaging), resulting from land occupation of tree plantations. Meanwhile packaging had minor contribution for FE, POF, TO and TA. Finally, plant process water was first driver for WD, where water was firstly present as steam, cold and hot water during cheese-making process, and secondarily mainly used for cleaning-in-place operations.
Figure 2. Environmental impact per 1 kg of Asiago cheese from farm gate-to-plant gate, and % contribution of emission drivers, using economic allocation model. (CC: Climate Change; OD: Ozone Depletion; TA: Terrestrial Acidification; FE: Freshwater Eutrophication; TO: Toxicity; POF: Photochemical Oxidant Formation; LO: Land Occupation; WD: Water Depletion; CED: Cumulative Energy Demand).
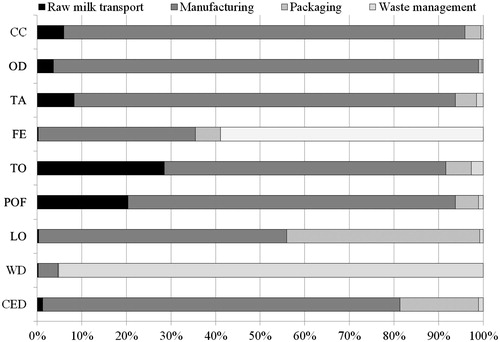
Figure 3. Environmental impact drivers in the manufacturing stage of Asiago cheese at the plant, using economic allocation model. (CC: Climate Change; OD: Ozone Depletion; TA: Terrestrial Acidification; FE: Freshwater Eutrophication; TO: Toxicity; POF: Photochemical Oxidant Formation; LO: Land Occupation; WD: Water Depletion; CED: Cumulative Energy Demand).
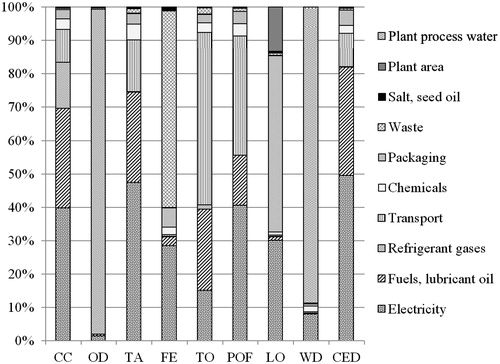
Production and utilisation of electricity and natural gas as first contributors at plant are in line with Kim et al. (Citation2013) and Guinard et al. (Citation2009). Primarily user of energy were cheese-making processes, such as pasteurisation of milk, and heat, steam and cool water production. Refrigeration and packaging had generally lower impact than energy usage for cheese-making due to the typology of cheese. In fact Asiago cheese requires low quantity of packaging because it is stored as wheels in the plant; furthermore the aging period does not requires extreme temperature therefore energy consumption is lower than energy used during manufacturing processes. Our results demonstrate that FE mainly occurred due to waste water treatment, which is in line with that reported by González-García, Hospido et al. Citation2013; González-García et al. Citation2013b) and Kim et al. (Citation2013). Additionally, the packaging production and utilisation have large impacts on LO, in line with van Middelaar et al. (Citation2011) and González-García et al. (Citation2013b). Moreover, in our study the transport activities associated with the cheese plant had a relevant impact on TO and AC, as reported by Berlin (Citation2002), Guinard et al. (Citation2009), and González-García, Hospido et al. (Citation2013). Finally, the Asiago cheese had similar values of CC and CED as those reported by González-García, Hospido et al. (Citation2013), but greater emissions than those from other authors. TA was similar to that reported by Djekic et al. (Citation2014), but lower than other studies. Furthermore, LO and WD were similar to results from other studies. Meanwhile our values of OD were greater than other reported values (Table ).
Table 3. Comparison between present study results and results of other cheese LCAs. Results are shown per 1 kg of cheese. The LCAs were selected considering only results with impacts having the same unit of measure, and no adjustment for system boundaries and adopted methods were applied. Cheese yield and allocation strategy are shown.
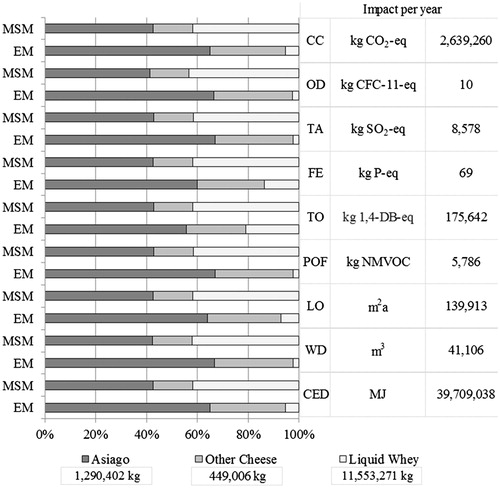
Figure shows the annual amount of products and emissions, as well as the comparison between allocation model (EM and MSM) results from farm gate-to-plant gate perspective. In our study economic allocation factors were 67%, 31%, and 2% for Asiago, other cheeses, and liquid whey, respectively; however, when using milk solids allocation strategy, the factors changed to 43%, 15%, and 42%, respectively. The larger economic allocation factor than milk solids allocation factors for cheese was in line to those reported by González-García et al. (Citation2013b). According to EM, the largest portion of emissions (from 56% to 67%) was attributed to Asiago cheese, followed by other cheeses (from 24% to 31%); while liquid whey showed the lowest impact (from 2% to 21%). These values reflect the annual economic revenue derived from each product. In applying MSM, the main emissions for all impact categories were still assigned to Asiago cheese (from 41% to 43%) and secondarily to liquid whey (from 42% to 43%); while other cheeses (from 15% to 16%) had the lowest impacts, having been produced in smaller amounts than the other products.
Figure 4. Impacts allocated between products at plant, using economic allocation model (EM) and milk solids allocation model (MSM). (CC: Climate Change; OD: Ozone Depletion; TA: Terrestrial Acidification; FE: Freshwater Eutrophication; TO: Toxicity, POF: Photochemical Oxidant Formation; LO: Land Occupation; WD: Water Depletion; CED: Cumulative Energy Demand).
Scenario analyses: Allocation strategy and time of cheese aging
The results appear to be deeply influenced by the allocation strategy. MSM (Table ) resulted in the same trend for emission drivers as estimated using EM (Table ). As expected, most of the impacts were allocated to Asiago cheese using EM, due to the low revenues obtained by selling whey; this is contrary to the results obtained by using MSM that allocated more impacts to whey. While the numerical results of individual co-products were affected by the choice of allocation strategy, the overall conclusions regarding sources of environmental impact remain unchanged, as do recommendations for improving the environmental footprint of the plant. Evaluating the effects of using different allocation strategies is considered an important point in the robustness of the study results. Accordingly, changing from EM to MSM reduced the fraction of total emissions assigned to the main product, Asiago cheese (Figure ), which is similar to results reported by Flysjö et al. (Citation2014) who showed a progressive decrease of emissions per kg of cheese moving from cheese revenue to milk solids allocation strategy. However, allocation does not make emissions disappear; it simply moves them from the Asiago cheese to the whey and to other cheese, as previously shown.
Table 4. Results of 1,000 Monte Carlo runs uncertainty analysis of 1 kg of Asiago cheese from cradle-to-plant gate, using economic allocation model.
Table 5. Milk solids allocation model and % variation compared with economic allocation model. Results per 1 kg of Asiago cheese.
Asiago “d’allevo" with longer aging (162-180 days) had greater emissions than Asiago “pressato” (20 days of aging) in both allocation models (Table ). In EM, Asiago “d’allevo” had 22% and 23% greater CC and CED, respectively, than Asiago “pressato”, and the aging of Asiago “d’allevo” contributed about seven percent of the plant total of CC and CED. In this analysis, the contributions to CC and CED were 5.86E-04 kg CO2-eq and 1.03E-02 MJ per kg of Asiago cheese per day of aging, respectively. We did not consider refrigerant leakage on the aging room due to lack of specific data. However, the longer the aging, the more refrigerant is required, which increases leaking losses, contributing to increased impact in OD, FE, POF, and TO, as shown by Kim et al. (Citation2013).
Table 6. Difference of climate change and cumulative energy demand impact between Asiago “pressato” (short aging) and Asiago “d’allevo” (long aging). Results per 1 kg of Asiago cheese at plant, using economic allocation model and milk solids allocation model.
Manufacturing plant and transport improvements
Concerning the manufacturing plant, we found that the energy and fuels were the main emission drivers; which was also reported by González-García et al. (Citation2013b). Energy efficiency and more renewable sourcing of fuels have been suggested as ways to reduce plant impacts (van Middelaar et al. Citation2011; Aguirre-Villegas et al. Citation2012; González-García, Hospido et al. Citation2013; González-García et al. Citation2013a, Citation2013b). According to Karlsson et al. (Citation2004), a reduction of emissions derived from energy use in plants is achievable by reducing total energy requirements, without the need for major investments or advanced technical equipment. Thus, we suggest a focussed energy audit analysis to identify plant-specific inefficiencies. Furthermore, reducing transport distances and retrofitting existing trucks with emission controls could reduce the emissions attributed to transport. Although, we found the contribution of transport to impacts to be small compared to other sources (Berlin et al. Citation2008; González-García et al. Citation2013a); in our study, raw milk transport in Euro 3 diesel trucks had post-farm gate contributions to TO and POF, so a minor improvement is possible with a shift to more efficient trucks.
Normalization and uncertainty analysis
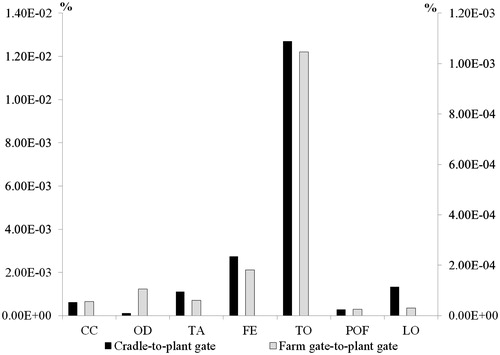
Emissions from the annual per capita Asiago cheese consumption were normalised using ReCiPe Midpoint (H) V1.11 European normalisation (Goedkoop et al. Citation2009). This shows the fractional contribution of Asiago cheese production to an average European citizen’s cumulative environmental impact. As discussed by Kim et al. (Citation2013), a direct quantitative comparison must be used with caution. Importantly, normalisation is a useful tool in representing cheese impacts on a national or international scale, and it can suggest to actors across the production chain where to focus strategies and policies to reduce the most relevant impacts on a regional scale. Results of normalisation before allocation, for both the cradle-to-plant gate and from farm gate-to-plant gate perspective are shown in Figure . Both perspectives suggest TO and FE as the main impact categories for targeting improvements such as transport improvement, electricity and fuels saving and chemical use.
Figure 5. Normalization of Asiago cheese production (% contribution of Asiago cheese impacts to European impacts.: cradle-to-plant gate perspective on left axis; farm gate-to-plant gate perspective on right axis), using economic allocation model. (CC: Climate Change; OD: Ozone Depletion; TA: Terrestrial Acidification; FE: Freshwater Eutrophication; TO: Toxicity; POF: Photochemical Oxidant Formation; LO: Land Occupation; WD: Water Depletion; CED: Cumulative Energy Demand).
The uncertainty of the results in cradle-to-plant gate perspective was analysed from 1,000 Monte Carlo simulation runs and presented in Table . The quality of individual data inputs was assigned using the Ecoinvent® 2.0 pedigree matrix (Frischknecht, Jungbluth, Althaus, Hischier et al. Citation2007). Specifically, the 95% confidence interval was 6.2 to 17.5 kg CO2-eq and 41.8 to 115.1 MJ per kg of Asiago cheese for CC and CED, respectively.
Conclusions
This study assessed the environmental impacts of the manufacturing of the Asiago cheese, the fourth most produced Italian PDO cheese. Although raw milk production at farm was the main contributor to overall impact categories, the study emphasised the analysis from farm gate-to-plant gate perspective. Energy and fuels usage were the main contributors to ozone depletion, climate change, cumulative energy demand, terrestrial acidification, and photochemical oxidant formation; therefore, the use of renewable energy and fuels is suggested. Wastewater management was the largest contributor to freshwater eutrophication, while packaging (cardboard) was the largest contributor to land occupation. Allocation strategies influenced the emissions per kg of Asiago cheese, where economic allocation strategy attributed greater emissions to cheese than milk solids allocation strategy, which valorised the whey co-product. We also found that the time of cheese aging increased emissions per kg of Asiago cheese and represented 6–11% of the climate change and cumulative energy demand per kg of Asiago cheese at the plant.
Acknowledgments
The authors would like to thank Soligo Dairy Cooperative (Farra di Soligo, Italy) and the local dairy farmers for their support in providing critical data through the survey.
Disclosure statement
The authors declare that there is no conflict of interest associated with this paper. The authors alone are responsible for the content and writing of this article.
References
- Aguirre-Villegas HA, Milan FX, Kraatz S, Reinemann DJ. 2012. Life cycle impact assessment and allocation methods development for cheese and whey processing. Trans ASABE. 55:613–627.
- Arena U, Mastellone ML, Perugini F, Clift R. 2004. Environmental assessment of paper waste management options by means of LCA methodology. Ind Eng Chem Res. 43:5702–5714.
- ARPA. 2013. Produzione e gestione dei Rifiuti Urbani nel Veneto 2013. Agenzia regionale per la prevenzione e protezione ambientale del Veneto. http://www.arpa.veneto.it/temi-ambientali/rifiuti/rifiuti-urbani/rifiuti-urbani-2013.
- Assolatte. 2015. Il settore lattiero caseario in Italia e in Unione Europea 08-10-2014. http://www.assolatte.it/it/home/news_detail/attualita/assolatte-e-i-numeri-del-settore-italiano-e-europeo-produzione-fatturato-addetti- Visited May 2015.
- Barjolle D, Schmitt E, Cravero V, Tanquerey-Cado A. 2015. Sustainability Assessment of PDO Value Chains: The Cases of L’Etivaz and Le Gruyere in Switzerland. In 145th Seminar, April 14-15, 2015, Parma, Italy (No. 200318). European Association of Agricultural Economists.
- Berlin J, Sonesson U, Tillman AM. 2008. Product Chain Actors’ Potential for Greening the Product Life Cycle. J Ind Ecol. 12:95–110.
- Berlin J. 2002. Environmental life cycle assessment (LCA) of Swedish semi-hard cheese. Int Dairy J. 12:939–953.
- Bianconi P, Marani S, Masoni P, Raggi A, Sara B, Scartozzi D, Tarantini M. 1998. Application of life-cycle assessment to the italian dairy industry: a case-study. In: Proc. Int. Conf. Life Cycle Assess. Agric., Agro-Ind. Forest., Brussels, Belgium. Sustainable Energy Systems Division, ENEA, Bologna, Italy. p. 59–62.
- Clal. 2015. Italy: dairy sector. [accessed 2015 May]. http://www.clal.it/en/?section=quadro_italia
- Dalla Riva A, Burek J, Kim D, Thoma G, Cassandro M, De Marchi M. 2015. The environmental impact of cow milk in the northeast of Italy. Poljopriv/Agri Poljopriv. 21(1 Suppl):105–108.
- Disciplinare di Produzione DOP “Asiago’. 2006. Procedural guideline of Asiago PDO production. D.M.03/08/2006 Gazzetta Ufficiale n. 190 del 17/08/06. Italy. Italian
- Djekic I, Miocinovic J, Tomasevic I, Smigic N, Tomic N. 2014. Environmental life-cycle assessment of various dairy products. J Clean Prod. 68:64–72.
- Fantin V, Buttol P, Pergreffi R, Masoni P. 2012. Life cycle assessment of Italian high quality milk production. A comparison with an EPD study. J Clean Prod. 28:150–159.
- FAOSTAT. 2014. Food and Agriculture Organization of the United Nations. http://faostat3.fao.org/home/index.html#HOME - visited May 2015.
- Flysjö A, Thrane M, Hermansen JE. 2014. Method to assess the carbon footprint at product level in the dairy industry. Int Dairy J. 34:86–92.
- Fornasari L. 2013. Developing a model for the Life Cycle Assessment of the Parmigiano-Reggiano cheese. Prog Nutr. 15:184–193.
- Frischknecht R, Jungbluth N, Althaus HJ, Doka G, Heck T, Hellweg S, Wernet G. 2007. Overview and methodology. Ecoinvent Rep. 1:237.
- Frischknecht R, Jungbluth N, Althaus HJ, Hischier R, Doka G, Bauer C, Loerincik Y. 2007. Implementation of life cycle impact assessment methods. Data v2. 0 (2007). Ecoinvent report No. 3. Ecoinvent Centre, Swiss Federal Laboratories for Materials Testing and Research (EMPA), Duebendorf (Switzerland).
- Goedkoop MJ, Heijungs R, Huijbregts MAJ, De Schryver AM, Struijs J, Van Zelm R. 2009. ReCiPe 2008: A life cycle impact assessment method which comprises harmonised category indicators at the midpoint and the endpoint level; First edition Report I: Characterisation. 6 January 2009. http://www.lcia-recipe.net.
- González-García S, Castanheira ÉG, Dias AC, Arroja L. 2013a. Environmental life cycle assessment of a dairy product: the yoghurt. Int J Life Cycle Assess. 18:796–811.
- González-García S, Castanheira ÉG, Dias AC, Arroja L. 2013b. Environmental performance of a Portuguese mature cheese-making dairy mill. J Clean Prod. 41:65–73.
- González-García S, Hospido A, Moreira MT, Feijoo G, Arroja L. 2013. Environmental Life Cycle Assessment of a Galician cheese: San Simon da Costa. J Clean Prod. 52:253–262.
- Guinard C, Verones F, Loerincik Y, Jolliet O. 2009. Environmental/ecological impact of the dairy sector: Literature review on dairy products for an inventory of key issues, list of environmental initiative and influences on the dairy sector. Bull Int Dairy Fed. 436:60.
- ISO. 2006. ISO 14040: environmental management—life cycle assessment— principles and framework. ISO 14044: environmental management—life cycle assessment— requirements and guidelines. Geneva: International Organization of Standardization.
- ISO. 2013. ISO 14067. Greenhouse gases—carbon footprint of products: requirements and guidelines for quantification and communication. ISO 14067, Geneva.
- ISPRA. 2014. Rapporto Rifiuti Urbani - Edizione 2014. Dati di sintesi. Istituto Superiore per la Protezione e la Ricerca Ambientale Rapporti 202/2014 ISBN: 978-88-448-0665-1. Italian
- Karlsson M, Rohdin P, Karlsson F, Moshfegh B. 2004. Energikonsekvenser av strukturerat energieffektivitetstänkande för Arla Foods (EKSET). Sweden: Department of Energy Systems, Linköping University of Technology, Linköping.
- Karousou N, Stefanou F, Theofilidi M, Chasapis D, Christodoulaki R. 2010. Energy and economic potential assessment for SAHC plants in selected agrofood sectors. SAHC Project Promotion of Solar Assisted Heating and Cooling in the agrofood sector. Intelligent Energy – Europe (IEE) ALTENER- Renewable heating and cooling EIE/07/224.
- Kim D, Thoma G, Nutter D, Milani F, Ulrich R, Norris G. 2013. Life cycle assessment of cheese and whey production in the USA. Int J Life Cycle Assess. 18:1019–1035.
- Luo L, Voet EVD, Huppes G, Haes HAUD. 2009. Allocation issues in LCA methodology: a case study of corn stover-based fuel ethanol. Int J Life Cycle Assess. 14:529–539.
- Masoni P, Scartozzi D, Tarantini M, Sra B, Raggi A. 1998. A life cycle assessment pilot study in an Italian dairy company. Proceedings of the Third International Conference on EcoBalance, Tsukuba, Japan, 1998 Oct 25–27.
- Nilsson K, Flysjö A, Davis J, Sim S, Unger N, Bell S. 2010. Comparative life cycle assessment of margarine and butter consumed in the UK, Germany and France. Int J Life Cycle Assess. 15:916–926.
- Perugini F, Mastellone ML, Arena U. 2005. A life cycle assessment of mechanical and feedstock recycling options for management of plastic packaging wastes. Environ Prog. 24:137–154.
- PRé Consultants The Netherlands. 2014. SimaPro© version 8. http://www.pre.nl/.
- Ramirez C, Patel M, Blok K. 2006. From fluid milk to milk powder: Energy use and energy efficiency in the European dairy industry. Energy. 31:1984–2004.
- Sumner J. 2013. Proceedings of the World Dairy Summit (2011) Bulletin No. 457/2012, International Dairy Federation, Boulevard Auguste Reyers 70/B, 1030 Brussels, Belgium.
- IPCC. 2006. Guidelines for National Greenhouse Gas Inventories. Chapter 10: Emissions from livestock and manure management. Chapter 11: N2O emissions from managed soils, and CO2 emissions from lime and urea application. In: Eggelston S, Buendia L, Miwa K, Ngara T, Tanabe K, editors. Volume 4: Agriculture, Forestry and Other Land Use. Japan: IGES. p. 1–87; 1–54.
- Thoma G, Jolliet O, Wang Y. 2013. A biophysical approach to allocation of life cycle environmental burdens for fluid milk supply chain analysis. Int Dairy J. 31:S41–S49.
- Van Middelaar CV, Berentsen P, Dolman M, Boer ID. 2011. Eco-efficiency in the production chain of Dutch semi-hard cheese. Livestock Sci. 139:91–99.
- Weidema BP, Bauer C, Hischier R, Mutel C, Nemecek T, Reinhard T, Vadenbo CO, Wernet G. 2013. The ecoinvent database: Overview and methodology, Data quality guideline for the ecoinvent database version 3. http://www.ecoinvent.org/.
- Xu T, Flapper J, Kramer KJ. 2009. Characterization of energy use and performance of global cheese processing. Energy. 34:1993–2000.