
Abstract
This study characterises diets used on-farm and examines nutrient and feed intake (DMI) together with other animal specific traits (body weight, milk yield, body condition score). Data came from the project ‘Efficient Cow’ to develop efficiency traits for Austrian cattle breeding (161 farms, 6105 cows, one-year data collection). Most diets were grass silage- or maize silage-based. Nearly half (42.8%) of the records were diets with separately fed concentrate or were partial mixed rations (PMR, 42.9%), and 12.0% were total mixed rations (TMR). Feedstuffs from permanent grassland ranged between 62% (TMR) and 84% (pure forage diets) of forage. Partial mixed rations and TMR showed the highest average proportion of maize silage (30%). The little importance of pure forage diets and pasture reflected the above-average production level of the farms. Most production traits increased from Fleckvieh (FV) over FV groups with increasing Red Holstein (RH) genes to Holstein Friesian (HF). The FV group with highest RH proportion and HF had the highest energy corrected milk yield (ECM) and DMI (29.3 vs. 29.2 kg ECM/d; 20.8 vs. 20.9 kg DMI/d). Brown Swiss (BS) and FV had lower levels (26.5 vs. 26.7 kg ECM/d; 19.8 vs. 19.7 kg DMI/d). Body condition declined in relation to proportion of RH genes from FV to HF (FV 3.42 Pt., BS 2.88 Pt., HF 2.61 Pt.). The study allowed a broad view on the continuous spectrum between dual-purpose and dairy breeds due to the different characteristics of metabolism and on the common diets on Austrian dairy farms.
Highlights
• Study to develop efficiency traits for cattle breeding
• Broad view on feed intake and common diets on Austrian dairy farms
Introduction
In Austria 47.5% of the agricultural area was permanent grassland in 2013, of which 56.5% was extensively used e.g. alpine pastures (BMLFUW Citation2016). In 2015, dairy production contributed to the total Austrian agricultural production value with 16.5%. Therefore, it plays a major role in producing products for human consumption from fibrous matter (BMLFUW Citation2016). In Austria, the following dairy breed distribution exists: Fleckvieh (FV, dual-purpose Simmental) is the dominant breed at 73.3% of all 422,777 recorded dairy cows, followed by the specialised dairy breeds Brown Swiss (BS) at 12.0% and Holstein Friesian (HF) at 11.7%. Compared to 1950, in 2015 milk yield per lactation has more than doubled (2998 kg vs. 7281 kg, ZAR Citation2016). The sharp increase since 1995 has been caused by pronounced genetic gain and by dropping prices of concentrate with Austria’s accession to the European Union (Knaus Citation2009; ZuchtData Citation2016). This change of circumstances resulted in an increase of larger, more specialised farms feeding more intensive diets (Knaus Citation2016). However, feed costs make up ∼50% of the total costs in dairy production (de Haas et al. Citation2014). Besides environmental impacts, feed costs are one reason why international research in dairy cattle focuses on efficiency or efficiency related traits like body weight, feed and energy intake, body condition score (BCS) or reproduction (e.g. Veerkamp Citation1998; Pryce et al. Citation2000). Several comparisons among breeds or cows with different potential for milk performance were conducted (e.g. Dillon et al. Citation2003; Yan et al. Citation2006).
The Federal Association of Austrian Cattle Breeders (ZAR) initiated the project ‘Efficient Cow’ in 2012 to compare different dairy cow genotypes relating to efficiency traits, and the impact of higher efficiency on greenhouse gas emissions. As recording efficiency related traits in research herds is limited in Austria, the project focussed on a large-scale on-farm data collection. This offered the possibility to additionally study feeding and diet plans, production and management of the commercial Austrian dairy farms. Furthermore veterinarian diagnoses, lameness scores, ketosis milk tests and hoof trimming data were recorded for testing novel health traits. The aim of this paper is two-fold: firstly, the paper describes diet composition according to feeding system and primary forage components (forage type). Secondly, it discusses the influence of genotype, parity and lactation stage on feed and nutrient intake, milk yield, body weight and BCS. Furthermore, the effect of genotype considers the impact of the ‘Holsteinisation’ (Harris and Kolver Citation2001, p. E56) of Austrian FV by creating FV groups with increasing Red Holstein (RH) genes.
Materials and methods
Data recording and calculation
No work carried out for this research was subject to the approval of an ethics committee. Data was collected in 2014 from 161 dairy herds and 3634 FV, 1034 HF and 1437 BS cows. Austria is partitioned into eight main production areas due to topography and climate (Statistik Austria Citation2018). All farms were located in the traditional dairying regions. They were situated between 300 and 1460 m above sea level in flat, hilly and mountainous areas. Genotypes were spread over all production areas picturing Austrian distribution of breeds (ZAR 2016). The number of single-breed farms owning BS was 24, HF 8 and FV 78. Within all single-FV farms pure-bred FV was also mixed with FV × RH. In the remaining farms, two (39 farms) or three breeds (12 farms) were kept. The number of animals per breed within these multi-breed farms is quite heterogeneous. Single cows of other breeds or crosses with other breeds (except FV × RH crosses) were not considered in this study. Most of the cows were housed in free-stall barns and milked twice a day in a milking parlour. At each routine performance recording day, the Austrian milk recording organisations collected additional trait information like body weight (with a mobile scale), BCS, belly girth, heart girth, diet and diet quality. Forage was sampled at the start of project, or before forage was fed during year. Forage samples were taken separately based on botanic origin, number of growth (first cutting separately) and conservation. Data was recorded into the Austrian central cattle database following extensive plausibility checks. The milk recording methods AT4 and AT5 with annual 9 to 11 alternated one-test recordings were usually applied (ICAR Citation2017). On average, farms had 9.8 performance recordings. The number of reports per cow ranged between 1 and 12 with a mean of 6.2 reports and a mode of 8. Herd sizes ranged between 3.2 and 97.9 cows reflecting the wide range of herd size in Austria. The average herd size of 32.7 cows was almost twice as high as the Austrian average of 16.5 cows (ZAR Citation2016). Compared to other Austrian farms, the project farms had an above-average production level. A more specialised dairy production with larger herds replaced small-scale operations during the last 50 years (Knaus Citation2009, Citation2016). This trend is continuing (BMLFUW Citation2016).
Forage samples were analysed in the laboratory for feed analyses of the Chamber of Agriculture in Lower Austria. Forage samples were analysed for crude protein, ether extracts, crude fibre, ash, and dry matter according to Weende analysis. Neutral detergent fibre, acid detergent fibre and acid detergent lignin were quantified according to Van Soest et al. (Citation1991). Methods were applied according to the guidelines by VDLUFA (Citation1976–2012). On average 7.5 forage analyses were available per farm. Chemical composition of concentrates was obtained from DLG (Citation1997) supplemented by LfL Grub (Citation2015). Ingredients of commercial compound feed were provided by Tiefenthaller (Citation2014). Energy content and utilisable crude protein at the duodenum (uCP) were calculated according to GfE (Citation2001), the interpolation of digestibility coefficients and proportion of uCP (DLG 1997) were performed according to Gruber et al. (Citation1997). The average chemical composition of feedstuffs is presented in Table . Because only individual concentrate intake could be measured on-farm, novel strategies for recording information on diet composition and estimating individual feed intake were developed considering the wide variety of diet composition and feeding systems in Austria (Ledinek et al. Citation2016). The feeding systems are pure forage diets (FOR), diets with separately fed concentrate (e.g. feeding station, SEP), both partially mixed and separately fed concentrate (e.g. mixing wagon plus feeding station, PMR) and total mixed rations (TMR). Information on diet composition was collected by means of forms at each test day (Ledinek et al. Citation2016). Before data entry, completed forms were checked across dates and different form types within each farm to ensure a complete data recording. Implausibilities were clarified with the person responsible for on-farm data recording or with the farmer. The most important feeding data is:
Table 1. Chemical composition (±standard deviation) of selected forages in g/kg dry matter (DM), unless stated otherwise.
Start date of fed concentrate mixture and ration
Feeding system: TMR, PMR and SEP (FOR = SEP without concentrate)
Category of forage considering conservation (fresh, silage, hay), number of growth and botanical origin (grassland, forage maize, legumes, straw)
Concentrate mixture and commercial compound feed
Individual amount of concentrates fed separately from forage
Daily dry matter intake (DMI) was predicted using the feed intake model developed by Gruber et al. (Citation2004). Jensen et al. (Citation2015) validated the up-to-date feed intake models of NRC (Citation2001), Volden et al. (Citation2011), Wageningen-DCM (Zom et al. Citation2012), TDMI-Index (Huhtanen et al. Citation2011) and Gruber et al. (Citation2004). The model of Gruber et al. (Citation2004) was found to be the most accurate in this evaluation. The validation was based on a set of 12 Scandinavian experiments involving 917 lactating dairy cows and 94 treatments. The breeds were Jersey and Danish/Swedish Red, varying in parity and lactation stages. Prediction models considered similar feed- and animal-specific parameters. The empirical regression model of Gruber et al. (Citation2004) includes the fixed effects of breed, parity, management level, lactation stage depending on days in milk (DIM), and the regression coefficient for the energy content of forage. The regression coefficients for milk performance, body weight and amount of concentrate have to be calculated depending on DIM. Collection of information on diet composition and feed intake prediction were described in detail by Ledinek et al. (Citation2016).
Energy corrected milk yield (ECM) was calculated according to the guidelines of GfE (2001). Daily net energy intake and nutrient intake were determined by multiplying net energy and nutrient density with the estimated daily dry matter intake. BCS recording followed the five-point system of Edmonson et al. (Citation1989).
Statistical analysis
The data set included 38,070 milk recording results from 6105 cows on 161 farms. Data had been statistically and visually checked using Statgraphics Centurion XVII (2015 Statpoint Technologies, Inc., Warrenton, Virginia, USA), MS Excel 2010 and MS Access 2010 before and during processing (e.g. feed intake prediction). Depending on traits and their distribution, records were discarded if they deviated with standard deviation ≥3 (e.g. body weight, belly and heart girth) or ≥3.5 (e.g. BCS and muscle score) from the previous or the next record of a cow without plausible reason. Cows with conspicuous records were additionally checked across all traits. Before final statistical modelling in SAS, the used data and their distributions were checked to identify effects for modelling. In this process, records with DIM >336 (lactation stage >12) were discarded due to a low number of records.
Another point was to identify the primary forage components within diets for establishing forage types. This classification was used for analysing diet composition and for keeping the effect of forage constant within the statistical model. The starting point was the individual forage composition at each performance recording (38,070 records). Diets, which consisted of an above-average proportion of a forage component (e.g. GS: grass silage; MS: maize silage) were encoded as ‘based on the respective forage’. Then respective codes from each record were combined (e.g. GSMS) and resulted in the presented forage types (Figure ). Finally, the proportion of each forage component was analysed within forage type (as done within feeding system Figure ). Tables and show the distribution of records, farms and cows within forage type and feeding system. The higher number of cows and farms is due to double counting. Farmers could change the way and amount of concentrate feeding and therefore the feeding system as well as the fed forage. This could happen either for the entire herd or an individual cow depending on milk performance or available feedstuff. Therefore, all statistical (descriptive) analyses refer to the individual feeding situation rather than farm or herd level.
Figure 1. (a) (upper). Forage composition according to forage type (FG: fresh grass; GS: grass silage; HA: hay from permanent grassland; MS: maize silage; CL: clover; AL: alfalfa; ST: straw). Forage type: Diets, which consisted of an above-average proportion of one of the above-named forage components, were encoded as ‘based on the respective forage’. The respective codes from each record were combined and resulted in the presented forage types. The grouping of forage type is based on the individual diet composition at each performance recording (N = 38,070). (b). Forage composition according to feeding system. The feeding system describes how diets and especially concentrates were fed (FOR: pure forage diet; SEP: forage diet with separately supplemented concentrate; PMR: partial mixed ration; TMR: total mixed ration). The grouping of feeding system is based on the individual diet composition at each performance recording (N = 38,070).
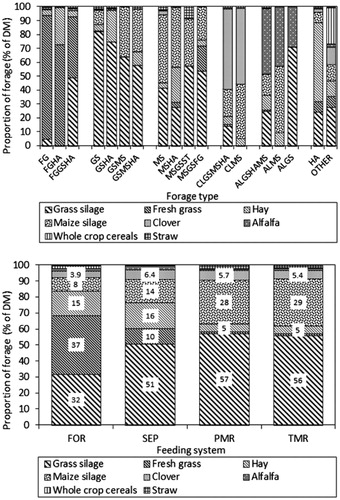
Table 2. Distribution of records, cows and farms in forage types.
Table 3. Distribution of records, cows and farms in feeding systems.
The classes HF and BS included pure-bred cows only (100% HF and BS ancestry). Fleckvieh cows were classified into FV (100% FV, 1576 cows), FV × RH6.25 (FV with ≤10% RH genes, average of 6.25%, 963 cows), FV × RH12.5 (FV with >10 to ≤15.6% RH genes, average of 12.5%, 342 cows), FV × RH25 (FV with >15.6 to ≤44.5% RH genes, average of 25%, 404 cows), and FV × RH5075 (FV with >44.5% RH genes, average 68%, 349 cows, the groups FV × RH50 and FV × RH75 were combined). The proportion of RH genes in the dual-purpose breed Fleckvieh was chosen to characterise specialisation on dairy performance (potential for milk production). This system allowed an objective comparison between dual-purpose type FV and the specialised dairy type HF/RH. Contrary to this, a comparison using estimated breeding values is only valid within population. Genotypes were distributed over all feeding systems (Table ) and forage types. The proportion of FV data in feeding systems decreased from FOR, SEP, PMR to TMR with 41.2 to 18.7%. The group HF had the highest proportion in PMR and TMR (20.7 and 20.6%). With both about 28% of all data records BS had an emphasis on SEP and TMR.
Table 4. Data distribution of genotypes in feeding systems.
Days in milk were divided into 28-day classes (4 × 7 days, lactation months) of lactation stage. The final model included twelve classes with DIM 1 to 336.
Data was analysed using PROC MIXED (SAS 9.4, SAS Citation2015), REML for the estimation of variance components, the Kenward-Roger method for the approximation of the denominator degrees of freedom and the default covariance structure VC. This covariance structure models a different variance component for each random effect and had the smallest Akaike information criterion. The fixed effects of genotype, parity (1, 2, 3 + 4, ≥5), lactation stage (1–12) and their interactions as well as forage type (1–18, Figure ) and farm (1–161) were included in the final model. Thus, influence of diet and management was considered. The model also included a random cow effect (1–6105) nested within genotype and farm. The effect of forage type on DMI, nutrient intake and the other traits is not discussed in this publication, because it was only included as correction factor and is not the topic of discussion in this article. Multiple comparisons were carried out using the specification ADJUST = TUKEY and the differences between the least squares means within genotype and parity with p < .05 were considered significant.
Results and discussion
Descriptive statistics of diet composition and feeding system
Figure illustrates forage composition according to forage type. The groups of bars show diets containing above-average fresh grass (pasture), grass silage, maize silage, clover, alfalfa and hay from permanent grassland. Preservation and botanical composition varied considerably due to climatic variation in Austria. However, forage composition is split into two primary categories: nearly pure grass silage ration [type GS (grass silage) 82% grass silage, 39.5% of data records] and type MS (maize silage) with 49% maize silage and 42% grass silage (27.1% of data records). Type MS equated approximately to the diets of commercial Danish herds (Kristensen et al. Citation2015). Although milk production based on alfalfa and clover represented only 8.5 and 2.6% of data records, growing legumes was regionally able to replace forage from permanent grassland. In contrast grass silage from Danish farms is rye grass- and clover-based (Kristensen et al. Citation2015). Only 8.1% of records belonged to hay-based diets (56.5% hay). The rare use of pasture-based diets (5.6% of data records) has two reasons: on one hand, pasture is more limited by climate and topography than e.g. in Ireland and New Zealand, where seasonal grazing systems are common (Dillon et al. Citation1995; Harris and Kolver Citation2001). On the other hand, the project farms represented an above-average production level in Austria.
Figure describes forage composition according to feeding system. Concentrate was either mixed (totally) into forage in PMR and TMR or supplemented separately via feeding station (SEP). Pure forage diets contained a high proportion of pasture and hay. Pasture and hay were hardly common in the more intense PMR and TMR. The proportion of grass silage, especially of maize silage, increased simultaneously to nearly 60 and 30% of forage dry matter in the mixed rations. Despite this, feedstuffs from permanent grassland dominated with at least 62% of forage in TMR and most at 84% in FOR. Concentrate proportions of SEP, PMR and TMR were 27, 35 and 30%. Pure forage diets were used only at 2.4% of milk performance tests. Partially separate and individual concentrate supplementation dominated with 85.7% (42.8% SEP, 42.9% PMR). Overall, concentrate levels, the degree of mechanisation (data not shown) and the lack of pasture as well as pure forage diets confirmed that project farms rank at the current upper end of the structural change of Alpine dairy farming. Larger, non-seasonal, indoor-feeding and more specialised dairy production more and more replaced the traditional, forage-based and small-scaled one in the last 50 years (Knaus Citation2009, Citation2016).
Effect of genotype
Estimated feed and nutrient intake as well as total diet composition differed among genotypes (p < .001). Especially FV groups up to an average of 12.5% RH genes were biologically similar (Table ). Differences increased with a higher RH gene proportion. The groups HF and FV × RH5075 were similar in most traits except parameters calculated relative to body weight. The dairy type BS was mainly located in the range of FV to FV × RH25 for nutrient and dry matter intake, but was similar to HF and FV × RH5075 relative to body weight. This was expected after examination of previous results from Ledinek and Gruber (Citation2014) and data from Austrian dairy cow performance recording programme (ZAR Citation2016).
Table 5. Effect of genotype and parity on estimated daily feed and nutrient intake, chemical composition of diet and body weight, body condition score and milk yield (least squares means).
Relative to body weight, differences in DMI and neutral detergent fibre (NDF) intake between the lighter specialised dairy groups and the heavier FV groups were emphasised. Dillon et al. (Citation2003) found a higher decline of relative DMI from Danish HF and Irish HF to the lower yielding breeds French Montbeliarde and Normande. This effect occurred between cows of medium and high genetic merit for dairy traits within the same breed as well (Kennedy et al. Citation2003). Furthermore, increased concentrate supplementation enhanced the DMI of HF cows kept on pasture. The higher feed intake and concentrate proportion in cows and breeds of higher milk yield potential were also found in the studies of e.g. Gruber et al. (Citation1995) and Dillon et al. (Citation2003). Overall, the level of g NDF per kg body weight indicates DMI was not physically limited by fibre content in the diet. However, with 12.2 g NDF/kg body weight HF approaches the limit of 12.5 g NDF/kg body weight described by Mertens (Citation1994). Therefore, fibre content was high relative to energy requirements, although concentrate proportion and diet quality were the highest of all genotypes. Total diets used in the commercial Danish dairy farms (Kristensen et al. Citation2015) are characterised by a slightly higher crude protein but slightly lower NDF content. This is most likely due to higher maize silage proportions (nearly 50%) and the rye grass-clover mixture of grass silage. The lower intake of uCP rather than crude protein in the current study indicated a small surplus of rumen degradable nitrogen. This surplus was below the tolerable 50 g/d (GfE Citation2001).
Intake parameters and ECM increased in relation to potential of milk performance. In contrast, average body weight, even more clearly BCS, declined in accordance to the findings by Dillon et al. (Citation2003). Apart from body weight, similar results were found for medium and high genetic merit HF cows (Buckley et al. Citation2000). We recorded the highest body weight difference between the two poles, with HF and BS having the lowest (662 and 649 kg). The FV groups up to an average of 25% RH genes had the highest body weight (722 to 729 kg). In contrast, the BCS of BS having the same ECM as FV was approximately midway of HF and FV. Previous and comparable studies in Austria indicate a body weight range of 646 to 761 kg for FV, 589 to 688 kg for HF and 636 to 698 kg for BS (Gruber et al. Citation1995; Haiger and Knaus Citation2010; Ledinek and Gruber Citation2015; Gruber and Stegfellner Citation2015). In a Swiss study by Piccand et al. (Citation2013) BS, HF and FV were lighter and differences between FV and HF were smaller. However, cows were managed in a seasonal-calving, pasture-based dairy system and FV had a high proportion of RH equal to FV × RH5075.
In the current study, FV and BS produced 12% more milk than the average Austrian performance-tested cows of the relevant breeds in 2015. The group HF produced only 5% more (ZAR 2016). Therefore, FV and BS had more similarities to HF compared to their breed averages. This pictured the above-average production level of the project farms and the change in Austrian dairy production towards a more specialised and intensive one (Knaus Citation2009, Citation2016).
Effect of parity and genotype × parity
Parities differed in intake parameters, body weight and BCS (p < .001), but not in chemical diet composition (Table ). Although differences in concentrate proportion and energy content of the total diet were statistically significant, they were too small to be of biological significance. Interaction between genotype and parity is significant for most parameters except diet quality (data not shown). However, the order of genotypes within parity mostly remains the same. In cases when it did not, differences were numerically small and not significant.
The effect of parity pictured the growth and aging of the cows within all genotypes. Estimated intake of concentrates, forage, crude protein, uCP, energy and DMI developed in a degressive and simultaneous increase up to parity 3 + 4. A slight decline to parity ≥5 followed. Contrary to ECM and the intake parameters, body weight increased to parity ≥5, and BCS decreased.
Cows of parity 3 + 4 had a 2.78 kg higher DMI than cows of first parity, the concentrate being 0.99 kg. Kennedy et al. (Citation2003) reported an increase of 4.4 kg to the third parity, whereas Buckley et al. (Citation2000) observed only an increase up to second parity. Relative to body weight we found that cows of parity 3 + 4 only had a higher DMI of 7.4 g DM compared to first parity cows. Relative feed intake was slightly lower than in parity 2, although cows of parity 3 + 4 had a higher milk performance. Additional requirements for higher milk yield were not completely met in parity 3 + 4 as the development of BCS showed, although milk performance is an important driver of DMI (Kennedy et al. Citation2003; Gruber et al. Citation2004). Due to the similar proportion of concentrate among all parities within genotype, the positive effect of higher levels of concentrate on DMI (Kennedy et al. Citation2003) is negligible. The lower DMI per kg body weight of cows in parity ≥5 can be explained with higher body weight and lower requirements for milk performance. Furthermore, more frequent diseases in older cows reduce DMI as shown in several studies on feed intake (Gruber et al. Citation2004).
Daily ECM increased up to parity 3 + 4 with 29.3 kg, with the biggest rise between parity 1 and 2. This agrees with Kennedy et al. (Citation2003) and Gruber and Stegfellner (Citation2015). In the current study HF had the highest increase from parity 1 to 3 + 4 with 5.8 kg ECM, followed by BS with 5.1 kg. The peak in milk performance of FV × RH6.25 and FV × RH12.5 was less pronounced in parity 3 + 4 than in the other groups.
Body weight grew degressively as reported in diverse studies (Enevoldsen and Kristensen Citation1997; Buckley et al. Citation2000; Yan et al. Citation2006). In parity ≥5 cows were 100 kg heavier than in the first parity with 644 kg. The specialised dairy groups BS and HF had a similar body weight in parity 1 with 600 and 606 kg, but growth was less pronounced in BS (75 vs. 93 kg difference). All FV groups gained more than 100 kg and had up to 772 kg in parity ≥5. This big difference between young and older cows was not found to be unusual. Blöttner et al. (Citation2011) reported differences of 88 and 100 kg for HF × BS and HF between parity 1 and 3. Buckley et al. (Citation2000) observed 99 kg. Comparable Austrian studies described a body weight of 640 to 654 kg for first parity cows and 740 to 757 kg for cows in the last parity classes (Ledinek and Gruber Citation2014; Gruber and Stegfellner Citation2015).
Effect of lactation stage and genotype × lactation stage
Feed intake parameters, total diet nutrient content, milk production, BCS, and body weight varied across stages of lactation (p < .001; Table ). The interaction between genotype and stage of lactation was significant and is shown in Figure . It does not include the groups FV × RH6.25 and FV × RH12.5, which are similar to FV, to increase readability of the figure.
Figure 2. Interaction between genotype and lactation stage for dry matter intake (DMI, BW0.75: metabolic body weight), neutral detergent fibre (NDF) intake, concentrate proportion, energy corrected milk (ECM) and body condition score (BCS) of Brown Swiss (BS), Fleckvieh (FV), the selected FV groups with increasing Red Holstein (RH) genes FV × RH25 and FV × RH5075 as well as Holstein Friesian (HF).
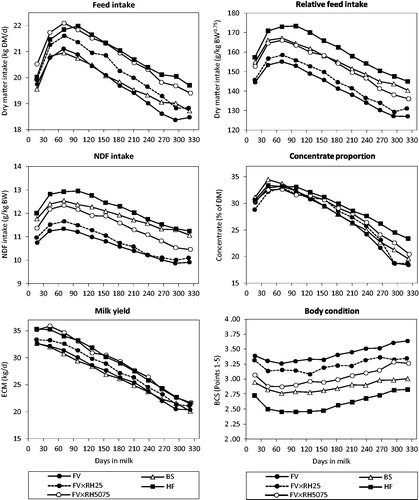
Table 6. Effect of stage of lactation on estimated daily feed and nutrient intake, chemical composition of diet and body weight, body condition score and milk yield (least squares means).
Highest estimated DMI (21.49 kg DM/d; 161.8 g/kg BW0.75) and nutrient intake were reached at lactation day 71 together with highest quality of total diet and highest concentrate proportion of 33.1%. Daily ECM peaked earlier on day 43 with 33.5 kg/d. Forage intake increased until the end of lactation up to 14.99 kg DM/d. Despite higher NDF content in the total diet NDF intake per kilogram of body weight was lower. This was due to increasing body weight and decreasing milk performance (Figure ). Feed intake of low yielding cows was limited by energy requirements (Mertens Citation1994). Milk yield and concentrate levels had been identified as important drivers of DMI before (Gruber et al. Citation1995; Kennedy et al. Citation2003). Yet, the lactation stage effects are based on the maintenance of the physiological state of milk production by homeorhesis (Bauman and Currie Citation1980). Hormones like growth hormone, insulin or insulin like growth factor and the sensitiveness of body tissue regulate the partitioning of nutrients between body tissue and milk production (Hart Citation1983; Vernon and Sasaki Citation1991). Furthermore, the change from reproduction to lactation leads to the observed low DMI close to calving (Ingvartsen and Andersen Citation2000). Therefore, milk is produced (nearly) independently from feed intake in early lactation. This is only possible via genetically driven body energy change (Friggens et al. Citation2007), insulin resistance, and the uncoupling of the somatotropic axis especially in high yielding cows (Lucy et al. Citation2009). Body weight and BCS mirror the milk performance curve and show mobilisation and regaining of body reserves for milk production.
Focusing on the interaction between genotype and lactation stage (Figure ), we found that HF with the highest DMI reached its peak intake later at lactation day 99, while having a nearly constant high concentrate level. In later lactation concentrate supplementations of FV × RH5075, especially of HF, remained at higher levels in contrast to other genotypes. Daily ECM decreased more than that of the FV groups up to an average of 25% RH genes. In a study by Yan et al. (Citation2006), HF cows produced more milk at a constant concentrate level than Norwegian cows. However, HF cows fed high concentrate diet partitioned a higher proportion of the additional energy intake to milk energy, particularly in early lactation, compared to those fed low concentrate diet. But this superiority drastically declined in late lactation. This corresponded with the decrease of growth hormone and non-esterified fatty acids as well as a significant increase of blood glucoses of high producing cows between lactation and dry period (Hart et al. Citation1979). In the current study, BCS loss of HF was highest of all groups. Body condition stagnated at its lowest level until DIM 154, but was regained faster. This led to the same BCS like shortly after calving on DIM 17. Contrary to this, the FV groups lost less body reserves and regenerated earlier. Finally, they had a higher body condition in late lactation than did DIM 17. Cows with high genetic merit in milk production had a higher loss but a faster regeneration of body reserves especially in dry period (Buckley et al. Citation2000). Similarly, differences between breeds are based on nutrient partitioning between milk production and body reserves as reported in several studies (Dillon et al. Citation2003; Yan et al. Citation2006). The specialised dairy type HF used high quality diet in late lactation for regaining depleted body store.
Conclusions
Diet composition showed Austria’s division into agriculturally favourable (maize silage-based) and mountainous regions (permanent grassland-based). Concentrates were fed mostly via feeding station and adapted to individual requirements. Pure forage diets and pasture were used rarely. This confirmed that the project farms belong to the current above-average production level in Austria following the trend of Austrian dairy farms towards intensification.
Daily DMI and ECM increased in relation to RH gene proportion in FV, but were based on higher diet quality and concentrate intake as well as on a more intensive BCS loss and later regeneration during lactation. Average BCS and body weight decreased with higher RH proportion, but 68% RH genes were necessary to affect body weight toward HF. Although BS is mainly bred for dairy performance, potential for milk production seemed to be low to medium. Daily ECM and DMI were similar to the FV groups up to an average of 12.5% RH genes. In conclusion, the study conducted created an expanded view of the continuous spectrum between dual-purpose and dairy breeds regarding varying metabolism characteristics.
Acknowledgements
The authors want to express their gratitude to Ian McDaniel (Agricultural Research and Education Centre Raumberg-Gumpenstein, Irdning) for language editing, Helga Bahar (Agricultural Research and Education Centre Raumberg-Gumpenstein, Irdning) for graphical editing, and Karl Moder (Institute of Applied Statistics and Computing, BOKU, Vienna).
Disclosure statement
No potential conflict of interest was reported by the authors.
Additional information
Funding
Related Research Data
References
- Bauman DE, Currie WB. 1980. Partitioning of nutrients during pregnancy and lactation: a review of mechanisms involving homeostasis and homeorhesis. J Dairy Sci. 63:1514–1529.
- Blöttner S, Heins BJ, Wensch-Dorendorf M, Hansen LB, Swalve HH. 2011. Brown Swiss × Holstein crossbreds compared with pure Holsteins for calving traits, body weight, back fat thickness, fertility and body measurements. J Dairy Sci. 94:1058–1068.
- BMLFUW [Austrian Federal Ministry of Agriculture, Forestry, Environment and Water Management]. 2016. Grüner Bericht: Bericht über die Situation der österreichischen Land- und Forstwirtschaft [Green report: Situation of Austrian agriculture and forestry]. Vienna: BMLFUW.
- Buckley F, Dillon P, Crosse S, Flynn F, Rath M. 2000. The performance of Holstein Friesian dairy cows of high and medium genetic merit for milk production on grass-based feeding systems. Livest Prod Sci. 64:107–119.
- de Haas Y, Pryce JE, Berry DP, Veerkamp RF. 2014. Genetic and genomic solutions to improve feed efficiency and reduce environmental impact of dairy cattle. Proceedings of the 10th Word Congress of Genetics Applied to Livestock Production; Vancouver, Canada. p. 1–5.
- Dillon P, Buckley F, O’Connor P, Hegarty D, Rath M. 2003. A comparison of different dairy cow breeds on a seasonal grass-based system of milk production. 1. Milk production, body weight, body condition score and DM intake. Livest Prod Sci. 83:21–33.
- Dillon P, Crosse S, Stakelum G, Flynn F. 1995. The effect of calving date and stocking rate on the performance of springcalving dairy cows. Grass Forage Sci. 50:286–299.
- [DLG] German Agricultural Society. 1997. DLG-Futterwerttabellen Wiederkäuer [Feed value table ruminants]. Frankfurt am Main: DLG-Verlag.
- Edmonson AJ, Lean IJ, Weaver LD, Farver T, Webster G. 1989. A body condition scoring chart for Holstein dairy cows. J Dairy Sci. 72:68–78.
- Enevoldsen C, Kristensen T. 1997. Estimation of body weight from body size measurements and body condition scores in dairy cows. J Dairy Sci. 80:1988–1995.
- Friggens NC, Berg P, Theilgaard P, Korsgaard IR, Ingvartsen KL, Løvendahl P, Jensen J. 2007. Breed and parity effects on energy balance profiles throughout lactation: evidence of genetically driven body energy change. J Dairy Sci. 90:5291–5305.
- [GfE] Society of Nutrition Physiology. 2001. Energie- und Nährstoffbedarf landwirtschaftlicher Nutztiere, Nr. 8: Empfehlungen zur Energie- und Nährstoffversorgung der Milchkühe und Aufzuchtrinder [Energy and nutrient requirements of livestock, No. 8: Recommendations for energy and nutrient supply of dairy cows and breeding cattle]. Frankfurt am Main: DLG-Verlag.
- Gruber L, Schwarz FJ, Erdin D, Fischer B, Spiekers H, Steingass H, Meyer U, Chassot A, Jilg T, Obermaier A, Guggenberger T. 2004. Vorhersage der Futteraufnahme von Milchkühen – Datenbasis von 10 Forschungs- und Universitätsinstituten Deutschlands, Österreichs und der Schweiz [Feed intake prediction in dairy cows based on the data of ten German, Austrian and Swiss research institutes and universities]. Proceedings of the 116th VDLUFA-Kongress; Sept 13–17; Rostock, Germany. p. 484–504.
- Gruber L, Stegfellner M. 2015. Effizienz bei Milchkühen – Einfluss von Rasse, Laktationszahl und Laktationsstadium [Efficiency of dairy cows – influence of breed, parity and stage of lactation]. Proceedings of the 42nd Viehwirtschaftliche Fachtagung; March 25–26; Irdning-Donnersbachtal, Austria: LFZ Raumberg-Gumpenstein; p. 23–40.
- Gruber L, Steinwender R, Baumgartner W. 1995. Einfluß von Grundfutterqualität und Kraftfutterniveau auf Leistung, Stoffwechsel und Wirtschaftlichkeit von Kühen der Rasse Fleckvieh und Holstein Friesian [Influence of forage quality and concentrate level on performance, metabolism and economy of Fleckvieh and Holstein Friesian dairy cows]. Proceedings of the 22nd Tierzuchttagung; May 9–10; Irdning-Donnersbachtal, Austria: BAL Gumpenstein; p. 1–49.
- Gruber L, Steinwidder A, Guggenberger T, Wiedner G. 1997. Interpolation der Verdauungskoeffizienten von Grundfuttermitteln der DLG-Futterwerttabellen für Wiederkäuer. [Interpolation of digestion coefficients of forage within DLG feed value tables] Aktualisiertes Arbeitspapier der ÖAG-Fachgruppe Fütterung über die Grundlagen zur Berechnung der Verdaulichkeit und des UDP-Gehaltes auf der Basis der DLG-Futterwerttabellen für Wiederkäuer (7. Auflage 1997).
- Haiger A, Knaus W. 2010. Vergleich von Fleckvieh und Holstein Friesian in der Milch- und Fleischleistung. 1. Mitteilung: Milchleistungsvergleich ohne Kraftfutter [Comparison of milk yield and beef performance in Fleckvieh and Holstein Friesian. 1st communication: dairy performance without concentrate supplementation]. Züchtungskunde. 82:131–143.
- Harris BL, Kolver ES. 2001. Review of Holsteinization on intensive pastoral dairy farming in New Zealand. J Dairy Sci. 84:E56–E61.
- Hart IC. 1983. Endocrine control of nutrient partition in lactating ruminants. Proc Nutr Soc. 42:181–194.
- Hart IC, Bines JA, Morant SV. 1979. Endocrine control of energy metabolism in the cow: correlations of hormones and metabolites in high and low yielding cows for stages of lactation. J Dairy Sci. 62:270–277.
- Huhtanen P, Rinne M, Mäntysaari P, Nousiainen J. 2011. Integration of the effects of animal and dietary factors on total dry matter intake of dairy cows fed silage-based diets. Anim. 5:691–702.
- [ICAR] International Committee for Animal Recording. 2017. Section 2 – Guidelines for Dairy Cattle Milk Recording. Rome: ICAR; [accessed 2018 Jan 17]. www.icar.org/Guidelines/02-Overview-Cattle-Milk-Recording.pdf.
- Ingvartsen KL, Andersen JB. 2000. Symposium: dry matter intake of lactating dairy cattle. Integration of metabolism and intake regulation: a review focusing on periparturient animals. J Dairy Sci. 83:1573–1597.
- Jensen LM, Nielsen NI, Nadeau E, Markussen B, Nørgaard P. 2015. Evaluation of five models predicting feed intake by dairy cows fed total mixed rations. Livest Sci. 176:91–103.
- Kennedy J, Dillon P, Delaby L, Faverdin P, Stakelum G, Rath M. 2003. Effect of genetic merit and concentrate supplementation on grass intake and milk production with Holstein Friesian dairy cows. J Dairy Sci. 86:610–621.
- Knaus W. 2009. Dairy cows trapped between performance demands and adaptability. J Sci Food Agr. 89:1107–1114.
- Knaus W. 2016. Perspectives on pasture versus indoor feeding of dairy cows. J Sci Food Agric. 96:9–17.
- Kristensen T, Jensen C, Østergaard S, Weisbjerg MR, Aaes O, Nielsen NI. 2015. Feeding, production, and efficiency of Holstein-Friesian, Jersey, and mixed-breed lactating dairy cows in commercial Danish herds. J Dairy Sci. 98:263–274.
- Ledinek M, Gruber L. 2014. Erhebungen von Körpermaszen und BCS im Laktationsverlauf und ihre Beziehungen zu Lebendmasse und Energiebilanz [Investigation of body measurements and BCS during lactation and their relationships to live weight and energy balance]. Proceedings of the 41st Viehwirtschaftliche Fachtagung; April 9–10; Irdning-Donnersbachtal, Austria: LFZ Raumberg-Gumpenstein; p. 31–44.
- Ledinek M, Gruber L. 2015. Körpermaße und BCS im Laufe der Laktation und ihre Beziehungen zu Lebendmasse und Energiebilanz [Body measurements and BCS during lactation and connection to body weight and energy balance]. Züchtungskunde. 87:181–200.
- Ledinek M, Gruber L, Steininger F, Fürst-Waltl B, Zottl K, Royer M, Krimberger K, Mayerhofer M, Egger-Danner C. 2016. Efficient Cow – Estimation of feed intake for efficiency traits using on-farm recorded data. 24th International Symposium Animal Science Days, Ptuj, Acta Agric Slovenica. Suppl 5:71–75.
- [LfL Grub] Bavarian State Research Center for Agriculture. 2015. Gruber Tabelle zur Fütterung der Milchkühe, Zuchtrinder, Schafe und Ziegen [Gruber feed value tables for dairy cows, breeding cattle, sheep and goats]. 39th ed. Freising Weihenstephan: Bayerische Landesanstalt für Landwirtschaft.
- Lucy MC, Verkerk GA, Whyte BE, Macdonald KA, Burton L, Cursons RT, Roche JR, Holmes CW. 2009. Somatotropic axis and nutrient partitioning in genetically diverse dairy cows managed under different feed allowances in a pasture system. J Dairy Sci. 92:526–539.
- Mertens DR. 1994. Regulation of forage intake. In: Fahey Jr. GC, editor. Forage quality, evaluation, and utilization. National Conference on Forage Quality, Evaluation, and Utilization. Madison (WI). p. 450–493.
- [NRC] National Research Council. 2001. Nutrient requirements of dairy cattle. 7th ed. Washington (DC): National Academy Press.
- Piccand V, Cutullic E, Meier S, Schori F, Kunz RL, Roche JR, Thomet P. 2013. Production and reproduction of Fleckvieh, Brown Swiss, and 2 strains of Holstein-Friesian cows in a pasture-based, seasonal-calving dairy system. J Dairy Sci. 96:5352–5363.
- Pryce JE, Coffey MP, Brotherstone S. 2000. The genetic relationship between calving interval, body condition score and linear type and management traits in registered Holsteins. J Dairy Sci. 83:2664–2671.
- [SAS] Statistical Analysis System. 2015. SAS/STAT 9.4 User’s Guide. Cary (NC): SAS Institute Inc.
- Statistik Austria 2018. Interaktive Landkarten [Interactive maps]. [accessed 2018 Jan 17]. https://www.statistik.at/web_de/klassifikationen/regionale_gliederungen/landwirtschaftliche_haupt_und_kleinproduktionsgebiete/index.html.
- Tiefenthaller F. 2014. Handelsfuttermittel für Rinder 2014. Fertigfutter, Ergänzungsfutter, Mineralfutter [Commercial compound feed for cattle 2014: Compound feed, feed supplements and mineral feed]. Linz: Landwirtschaftskammer Oberösterreich.
- Van Soest PJ, Robertson JP, Lewis BA. 1991. Methods for dietary fiber, neutral detergent fiber, and nonstarch polysaccharides in relation to animal nutrition. J Dairy Sci. 74:3583–3597.
- [VDLUFA] Association of German Agricultural Analytic and Research Institutes. 1976 incl. suppl. 1983, 1988, 1993, 1997, 2004, 2006, 2007, 2012. Methodenbuch Bd. III: Die chemische Untersuchung von Futtermitteln [Manual of agricultural methods of testing and analysis (VDLUFA methods book, Volume III – Feed analysis]. Darmstadt: VDLUFA-Verlag.
- Veerkamp RF. 1998. Selection for economic efficiency of dairy cattle using information on live weight and feed intake: a review. J Dairy Sci. 81:1109–1119.
- Vernon RG, Sasaki S. 1991. Control of responsiveness of tissues to hormones. Physiological aspects of digestion and metabolism in ruminants. In: Tsuda T, Sasaki Y, Kawashima R, editors. Proceedings 7th international symposium on ruminant physiology. London: Academic Press; p. 155–182.
- Volden H, Nielsen NI, Åkerlind M, Larsen M, Havrevoll Ø, Rygh AJ. 2011. Prediction of voluntary feed intake. In: Volden H, editor. The Nordic Feed Evaluation System. EAAP Publication no 130. Wageningen: Wageningen Academic Publishers; p. 113–126.
- Yan T, Mayne CS, Keady TWJ, Agnew RE. 2006. Effects of dairy cow genotype with two planes of nutrition on energy partitioning between milk and body tissue. J Dairy Sci. 89:1031–1041.
- [ZAR] Federal Association of Austrian Cattle Breeders. 2016. Jahresbericht 2015 [Annual report 2015]. Vienna: ZAR.
- Zom RLG, Andre G, Van Vuuren AM. 2012. Development of a model for the prediction of feed intake by dairy cows: 1. Prediction of feed intake. Livest Sci. 143:43–57.
- ZuchtData. 2016. Jahresbericht 2015 [Annual report 2015]. Vienna: ZuchtData-EDV-Dienstleistungen GmbH.