
Abstract
This study evaluated temporal changes in fatty acid (FA) composition of meat from Sarda suckling lambs reared in Sardinia, with emphasis on polyunsaturated fatty acids (PUFA) and conjugated linoleic acid (CLA). From December to April, 25 lambs were randomly chosen in a slaughter house and slaughtered at about 30 days of age (5 lambs/rearing month). From each carcass, the Femoral biceps muscle was used to determine the chemical and FA composition. Intramuscular lipid content ranged from 1.72% to 2.34% and protein content from 19.2% to 20.2%. Concentrations of several FA and FA groups were significantly influenced by rearing month. The greatest variation between months was observed for monounsaturated FA (MUFA), which ranged from 35.3% to 43.5%, and total PUFA, which varied from 18% to 26% of total FA. The content of FA of interest, especially α-linolenic (18:3 n-3) acid, CLA and long chain PUFA n-3, i.e. EPA (20:5 n-3), DPA (22:5 n-3) and DHA (22:6 n-3), did not vary among months. Lamb meat analysed in the study evidenced a constant amount of FA of nutritional interest, especially of the omega-3 family and CLA, in all months.
Composition and fatty acid profile of meat from Sarda suckling lambs were evaluated during different months of production.
Suckling lamb meat evidenced a low fat content and a constant amount of PUFA n-3 in all slaughter months.
PUFA n-3 and CLA did not vary with slaughter months in suckling lambs.
Highlights
Introduction
In many Mediterranean countries, the high consumption of suckling lamb meat generates an important income for dairy sheep farmers. In Sardinia, more than 600,000 suckling lambs of the Sarda dairy breed are slaughtered every year (ISTAT Citation2014) in a special production line with a Protected Geographical Indication named ‘Agnello di Sardegna’ (Commission Regulation (EC) No 138/2001). These lambs, which are born and reared in Sardinia, are normally raised with their dams, fed almost exclusively maternal milk and slaughtered at 25–30 days of age and 9–11 kg of body weight (BW).
The increasing public awareness of the health benefits attributable to conjugated linoleic acid (CLA), polyunsaturated fatty acids (PUFA) n-3 (PUFA n-3) and long-chain fatty acids has stimulated the interest in the natural sources of these fatty acids (FA) for human consumption. Based on studies in humans, there seems to be an association between dietary intake of dairy products naturally enriched with the CLA (18:2 c-9, t-11) and decreased levels of plasma cholesterol (Pintus et al. Citation2013; Derakhshande-Rishehri et al. Citation2015) and inflammatory markers (Sofi et al. Citation2009; Penedo et al., Citation2013) Among PUFA n-3, α-linolenic acid (ALA, 18:3 n-3) is associated with reduced risk of cardiovascular diseases. Among long-chain PUFA n-3, eicosapentaenoic acid (EPA, 20:5 n-3), docosapentaenoic acid (DPA, 22:5 n-3) and docosahexaenoic acid (DHA, 22:6 n-3) are recognised for their beneficial effects on the cardiovascular system, on brain and visual system during foetal development and throughout life (Lauritzen et al. Citation2016). A meat-based diet containing lamb meat caused a major improvement in the health conditions of allergic infants (Cardi et al. Citation1998; Martino et al. Citation1998). The effectiveness of a home-made lamb meat-based formula in babies with food-induced atopic dermatitis was detailed in the review of Cantani (Citation2006). Therefore, the enrichment of lamb meat with PUFA n-3 and CLA could be of great nutritional interest.
The intramuscular FA composition of suckling lambs is partly related to the sheep feeding system during gestation (Nudda et al. Citation2015) or lactation (Nudda et al. Citation2013, Citation2014; Gallardo et al. Citation2015) or both. In Sardinia, as in other Mediterranean countries, during most of the year, dairy ewes feed mainly on pasture and receive a low amount of supplements (concentrate and hay). This happens because weather conditions are favourable (mild temperatures and wet currents) and pasture availability is high. Only in periods of adverse weather conditions (cold and rainy) or limited pasture availability (dry periods), or both, the amount of concentrate and hay is increased. Therefore, sheep milk and, therefore, lamb meat composition are expected to change over time. Because of a lack of description of the monthly composition of FA in Sarda lamb meat in literature, the aim of this study was to survey if there is a monthly variation in FA profile, especially beneficial FA, in the meat of Sarda suckling lambs.
Materials and methods
Animal rearing, slaughter and sampling
To monitor the chemical composition and FA profile of lamb meat intended for sale, meat samples were collected from carcasses of twenty-five Sarda suckling lambs coming from different farms and randomly selected at a commercial slaughter house located in North Sardinia (Italy) from late autumn (end of December 2013) to early spring (end of April 2014). The animals had been slaughtered in full compliance with legislation, according to European Union regulations (EC No 1099/2009). No information was available on the farms and therefore on the specific diet of the mothers of the slaughtered lambs, but it was known that all lambs had been reared according to the traditional farming system used in Sardinia, i.e. lambs are fed maternal milk and follow their mothers on pasture, where they start grazing occasionally. The lambs were slaughtered at 28–32 days of age and a BW of 9.27 ± 0.70 kg (mean ± standard deviation).
Every month, five male lambs were randomly chosen among those intended for retail sale. From each carcass, a portion of about 50 g of the Femoral biceps muscle was taken at 24 h after slaughter. Samples were individually packaged in airtight food grade plastic bags, which were then labelled, transported under refrigeration to the lab and stored at −80 °C until analysis.
Chemical and fatty acid composition analyses
From each sample of the Femoral biceps muscle, the moisture content was determined in approximately 30 g of fresh muscle, from which visible fat had been removed, after 72 h of freeze-drying (−55 °C and 3.0 hPa; LyoLab 3000, Heto-Holten, Allerød, Denmark). The freeze-dried muscle samples were analysed in duplicate for ash, crude protein (CP) and total fat content. Total ash content was determined at 550 °C for 4 h (AOAC Citation2000; method 920.153). The CP content (N × 6.25) was determined by the Kjeldahl method (AOAC Citation2000; method 928.08). Total fat content was determined after extraction using a solution of chloroform:methanol (2:1, v/v) following the method of Folch et al. (Citation1957) with some modifications as follows: a ground sample (1 g) was homogenised in 30 mL of chloroform and methanol (2:1, v/v), using an UltraTurrax T25 homogeniser (Janke and Kunkel, IKA Labortechnik, Staufen, Germany), centrifuged for 10 min (1500 g at room temperature) and filtered through Whatman paper 541 (Whatman Ltd., Maidstone, UK). The residue was re-extracted twice, as described above, and the two filtrates were combined and mixed in a separating funnel. The supernatant was filtered under vacuum, and then centrifuged at 600 g × 10 min, after the addition of 6 mL of NaCl (1%, v/v). The upper methanol–water layer was removed using a water aspirator and discarded; the lower organic phase was poured into a round flat-bottom flask (50 mL), chloroform was removed using a vacuum rotatory evaporator at 40 °C (Büchi 461, BÜCHI Labor AG, Flawil, Switzerland) until dryness. Total lipids were determined by weighing the fatty residue obtained after solvent evaporation.
The lipid extract was re-dissolved in n-hexane:isopropyl alcohol (4:1, v/v) and approximately 20 mg of total lipids were then converted into fatty acid methyl esters (FAME) using a two-step sodium methoxide and methanolic HCl procedure (Kramer et al. Citation1997). Quantification of FAME was based on the internal standard technique, by using 1 mL of internal standard (0.5 mg/mL in n-hexane of nonadecanoic acid, 19:0; Sigma-Aldrich, St. Louis, MO) and converting the relative peak areas into weight percentages of FA, using the corrected conversion factor of each FA (ES ISO 5508 Citation1990).
Separation and quantification of the FAME were carried out using a gas chromatograph (GC Turbo 3400 CX, Varian Inc., Palo Alto, CA) equipped with a flame ionisation detector and an automatic injection system (Varian 8200 CX, Varian Inc.), and fitted with a CP-select CB for Fame capillary column (100 m × 0.32 mm i.d. × 0.25 μm film thickness, Varian Inc.). The column oven temperature was held at 75 °C for 1 min, increased at a rate of 5 °C/min to 148 °C, increased at 8 °C/min to 165 °C and held for 35 min, increased at 5.5 °C/min to 210 °C and held for 1 min, and finally increased at 3 °C/min to a final temperature of 230 °C and held for 15 min. The total run time was 83.25 min. The injector and detector were set at 255 °C. The split ratio was 1:100 with He as the carrier gas at a pressure of 37 psi. Identification of common FA was accomplished by comparing the sample peak retention times with those of FAME standard mixtures (Matreya Inc., Pleasant Gap, PA; Nu-Chek-Prep Inc., Elysian, MN; Supelco Inc., Bellefonte, PA) and by using published chromatograms obtained with similar analytical conditions (Kramer et al. Citation2004, Citation2008). The identification of isomers of 16:0 and 17:0 was done using the chromatographic data in ruminant fats reported by Luna et al. (Citation2009) and Alves et al. (Citation2006), respectively. Fatty acids were expressed as a proportion of total FA (% of total FA) or as gravimetric concentration (mg/100 g of meat edible portion).
Calculation of fat quality ratios and indexes
The energy value (kJ) of meat samples was calculated by multiplying the amount of protein and fat by the Atwater conversion factors of 17.9 kJ/g and 37.7 kJ/g, respectively (FAO Citation2003).
The concentrations of PUFA, monounsaturated fatty acids (MUFA), saturated fatty acids (SFA) and odd- and branched-chain fatty acids (OBCFA) were calculated.
The omega-6 (n-6) to omega-3 (n-3) ratio (n-6/n-3) was calculated as an indicator of healthy FA. In order to better understand the different effects of single meat FA on human health, in terms of the probability of increasing the incidence of atherogenesis and thrombosis, three different indexes were calculated: the atherogenic index (AI), the thrombogenic index (TI) and the hypocholesterolemic/hypercholesterolemic ratio (h/H). The AI and TI were calculated using the equations of Ulbricht and Southgate (Citation1991) as follows: AI = [12:0 + (4 × 14:0) + 16:0]/[Σn-3 + Σn-6 + ΣMUFA], and TI = [14:0 + 16:0]/[(0.5 × ΣMUFA) + (0.5 × n-6) + (3 × n-3) + (n-3/n-6)], without the inclusion of 18:0, which is considered to be neutral on serum cholesterol. The h/H ratio was calculated according to Fernández et al. (Citation2007) with the following equation: h/H = [(18:1 n-9 + 18:1 cis-11 + 18:2 n-6 + 18:3 n-6 + 18:3 n-3 + 20:3 n-6 + 20:4 n-6 + 20:5 n-3 + 22:4 n-6 + 22:5 n-3 + 22:6 n-3)/(14:0 + 16:0)].
Finally, the contents of FA were expressed as mg of each FA per 100 g of meat to give an indication of the effective amount of FA actually introduced with the diet in humans and thus allow us to make some nutritional considerations.
Statistical analysis
The chemical composition and the FA profile of meat samples were analysed with one-way ANOVA (Minitab version 16, Minitab Inc., State College, PA) considering the month of rearing (December, January, February, March and April) as fixed effect. The Tukey's test (p ≤ .05) was used to assess differences between means.
Results and discussion
Chemical composition
The chemical composition and the energy value of the samples of the Femoral biceps of Sarda suckling lambs for the different slaughter months (Table ) were within the range values of other cuts of lean lamb meat reported in food composition databases or surveys carried out in different EU (Berge et al. Citation2003; Addis et al. Citation2013; Lambe et al. Citation2017) and non-EU (USDA Citation2016; Williams Citation2007) countries. Moisture and protein did not differ significantly among slaughter months (p < .05). The ash content in lamb meat decreased over time (p < .0001), from a maximum of 1.31% recorded in December to a minimum of 1.15% in April. Meat fat content ranged from 1.72% in March to 2.34% in January (p = .057). Therefore, on the basis of the evaluation criteria of the Food and Drug Administration (FDA Citation2013), the meat of Sarda suckling lambs analysed in our study can be defined as ‘extra-lean’, because its fat percentage was lower than 5%.
Table 1. Chemical composition and energy value in Femoral biceps of Sarda suckling lambs in different slaughter months.
Fatty acid composition
The FA profile and partial sums of FA in the Femoral biceps muscle of Sarda suckling lambs at different slaughtering months are presented in Tables and , respectively. Several FA were significantly influenced by the month of slaughter (p < .05; Table ). The values of FA determined in Sarda lamb meat in our study are in agreement with previous research conducted on suckling lambs of the same breed (Addis et al. Citation2013; Nudda et al. Citation2013) and other breeds, i.e. in Longissimus lumborum from Appenine lambs (Mazzone et al. Citation2010), and in Longissimus thoracis and Quadriceps femoris in Talaverana lambs (Velasco et al. Citation2001).
Table 2. Fatty acid profile (g/100 g of FA) of intramuscular fat in Femoral biceps muscle of Sarda suckling-lambs in different slaughter months.
Table 3. Partial sums of fatty acids (% of total FA) of intramuscular fat of Femoral biceps of Sarda suckling-lambs in different slaughter months.
Saturated fatty acids
Saturated fatty acids ranged from 37.2 to 41.8 g/100 g FA (Table ). For all slaughtering months, among the SFA, those present in greater proportion were palmitic acid (16:0; from 15.2% to 19.7%), stearic acid (18:0; from 10.8% to 13.0%) and myristic acid (14:0; from 3.3% to 5.1%) (Tables and ). Most SFA were significantly influenced by the month of slaughter. Significant differences (p < .05) were observed in the concentrations of 10:0, 14:0 and 16:0, which reached the maximum concentrations in the muscle of animals slaughtered in February (Table ). The FA patterns of lamb-muscle fat reflect most of those observed in the suckled milk, with 14:0, 16:0 and 18:0 being the main SFA found also in sheep milk during the suckling period (Nudda et al. Citation2015). The content of the SFA reported in this study is in line with previous observations in suckling lambs (Rassu et al. Citation2015) but lower than values reported for heavier animals (Hajji et al. Citation2016). This is probably because higher slaughter weight is usually associated with higher intramuscular fat and therefore with higher triglyceride lipid fraction (Indurain et al. Citation2010).
The influence of the month of slaughter was also significant (p < .05) for OBCFA (Table ), with an increased concentration of 15:0, 17:0 and their correspondent isomers with a branched structure (iso and anteiso isomers) in the muscle of lambs reared in February (Table ). Relatively high levels of OBCFA are produced by rumen microbial fermentation and microbial de-novo lipogenesis (Vlaeminck et al. Citation2005) and are then transferred into the host animal. Therefore, an increase in OBCFA suggests that, in addition to their transfer from milk to meat, lambs start eating feeds other than milk, thus stimulating the morphological and metabolic development of the rumen before weaning (Lane and Jesse Citation1997). From a nutritional point of view, the 15:0 and 17:0, which are ruminant-specific FA, have been used as objective plasma biomarkers of ruminant fat intake by humans (Albani et al. Citation2017), and the correspondent isomers with a branched structure (iso and anteiso isomers) have potential healthy properties (Ran-Ressler et al. Citation2011).
Monounsaturated fatty acids
The prevailing MUFA were oleic acid (18:1 n-9; from 26.4% to 35.0%), vaccenic acid (18:1 t-11; from 1.2% to 2.2%) and palmitoleic acid (16:1 n-7; from 1.0% to 1.6%) (Table ). The level of MUFA was significantly (p = .052) higher in January (43.5%) compared to February, March and April (36.0%, 35.3% and 36.4%, respectively) (Table ).
The content of 18:1 n-9 was significantly influenced by month (p < .05), with a higher level in January compared to March and April (35.0% vs. 26.4% and 27.4%), and an intermediate level in the remaining months. This observation may be due, at least in part, to different parity of the mothers, being the December–January lambs from pluriparous ewes and the February–April lambs from primiparous ones: the pluriparous commonly lose weight during the first month of lactation causing a noticeable increase of 18:1 n-9 in milk whereas the primiparous ewes do not because they are still in growing phase (Nudda et al., Citation2004). The content of 18:1 t-11 varied significantly (p < .05) among months, almost halving the concentration from January to February (2.2% vs. 1.2%) (Table ). Even if there is a negative perception of trans FA in human nutrition, there is increasing experimental evidence supporting the beneficial health effects of trans FA of ruminant origin, especially for 18:1 t-11 (Wang et al. Citation2008; Field et al. Citation2009; Krogager et al. Citation2015).
Polyunsaturated fatty acids
The predominant PUFA of the n-6 series (PUFA n-6) were linoleic acid (LA; 18:2 n-6, from 5.7% to 10.7%) and arachidonic acid (20:4 n-6, from 2.5% to 4.3%), whereas the main PUFA n-3 was 18:3 n-3 which varied from 1.5% in December to 2.5% in February without reaching the level of significance (Table ). Although several studies have reported a low conversion of 18:3 n-3 into 22:6 n-3 in tissues, dietary 18:3 n-3 is critical for maintaining the levels of long chain n-3 in tissues (Barceló-Coblijn and Murphy Citation2009). The slaughter months was not a source of variation of PUFA n-3 in Sarda suckling lambs, as others factors, e.g. rearing system and sex, previously investigated in the same breed (Nudda et al., Citation2013).
The proportion of total PUFA had a different trend to that of MUFA. In fact, PUFA concentration was the lowest in January (18.0%) and the highest in March (25.9%) and April (24.6%). Similar patterns were also found for PUFA n-6, which varied with month of slaughter (p < .05) (Table ). The content of 18:2 n-6 varied with month (p = .009). In January, the concentration of 18:2 n-6 was the lowest (5.7%), being approximately half of those found in March and April (10.7% and 9.9%, respectively). A similar pattern was observed for the other PUFA n-6 considered, namely 20:4 n-6 and 20:3 n-6. Because these long-chain PUFA are incorporated preferentially into membrane phospholipids rather than into the neutral lipid fraction (Jerónimo et al. Citation2009), the variation in their concentration is mainly related to the variation in the fat content of the carcass.
The very long chain fatty acids (≥20:0) accounted for about 65% of the FA of the PUFA n-3 series. In particular, 20:5 n-3, 22:5 n-3 and 22:6 n-3 had average values of 1.2%, 1.4% and 0.9% of FA, respectively, and maximum values, although not statistically significant, in February, reaching 1.7%, 1.7% and 1.0%, respectively (Table ). The 22:6 n-3 values observed in the present study and in other studies with suckling lambs (Addis et al. Citation2013; Nudda et al. Citation2015) are higher than those found in meat from lambs fed concentrate (Terré et al. Citation2011) and from heavier animals suckling milk (Gallardo et al. Citation2015) or fed a grass-based diet (Demirel et al. Citation2006; Hajji et al. Citation2016). This could be due to differences in the anatomical localisation of fat (Juárez et al. Citation2008), the weight of slaughter (Serra et al. Citation2009) and the phospholipid to triglyceride ratio between the samples analysed. Because long-chain PUFA are higher in the membrane phospholipids than in the triglycerides fraction (Jerónimo et al. Citation2009), their higher content in the meat of young animals compared to fatter animals could be related to a higher phospholipid to triglyceride fraction in young animals.
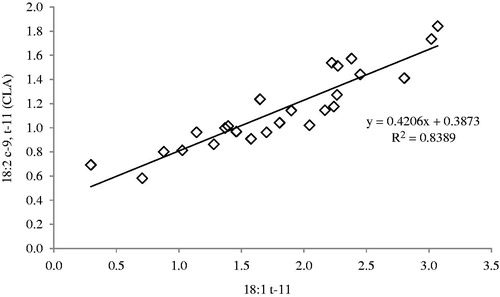
The 18:2 c-9, t-11 content ranged from 0.9% in February to 1.4% in January. The values of 18:2 c-9, t-11 are in line with those reported in other studies on suckling lambs (Serra et al. Citation2009) and non-suckling lambs (Jerónimo et al. Citation2009). The content of CLA in lamb meat is related partly to the content of CLA in the ewe’s milk and mostly to the endogenous synthesis by 18:1 t-11 through the action of the Δ9-desaturase enzyme in the tissues (Palmquist et al. Citation2005). A strong correlation between 18:2 c-9, t-11 and 18:1 t-11 was found in the muscle (Figure ), likely due to the existing product:precursor relationship between these two FA, confirming that foods rich in CLA are generally rich in 18:1 t-11 as well. From a nutritional point of view, this is important because the conversion of 18:1 t-11 into 18:2 c-9, t-11 has been reported in humans (Turpeinen et al. Citation2002).
Figure 1. Correlation between 18:2 c-9,t-11 (CLA) and 18:1 t-11 in Femoral biceps muscle of Sarda suckling lambs reared in different months (from December to April) in Sardinia (Italy).
Nutritional indexes and ratio
Nutritional indexes and ratios calculated for intramuscular fat of Femoral biceps muscle are presented in Table . The n-6/n-3 ratio ranged from 1.53 in February to 3.21 in December, whereas that of PUFA/SFA varied from 0.48 in January to 0.70 in March. The observed range of PUFA/SFA was below the range of 1–1.5, which reduced cardiovascular risk in laboratory animals (Kang et al. Citation2005).
The AI was the greatest in February (0.77), in coincidence with the highest concentration of SFA (41.77%), whereas it was on average 0.53 in the remaining months, corresponding to the observed decrease in the proportion of SFA (on average 37.48%). The highest value of AI in February was mainly determined by the highest content of 14:0 in this month (Tables and ). Among the SFA, 14:0 is considered to have a hypercholesterolemic effect four times that of 16:0 (Ulbricht and Southgate Citation1991). However, its high atherogenic effect needs to be reappraised, as moderate intake (1.2% of total calories) of 14:0 was shown to have beneficial health effects (Dabadie et al. Citation2005). In addition, recently it has been found that 14:0 enhances diacylglycerol kinase, which is thought to improve glucose homoeostasis in type 2 diabetes (Wada et al. Citation2016), and might affect the mechanism involved in neurodegenerative diseases (Ciesielski et al. Citation2016). The h/H ratio varied with month (p < .05), with the lowest value of 1.95 in February and the highest value of 2.65 in March.
Fatty acid content
The content of the major classes of FA and of beneficial FA, expressed in mg per 100 g of lean meat of Sarda suckling lambs, are shown in Table . Considering that the European Food Safety Authority (EFSA Citation2010) recommends a daily 20:5 n-3 and 22:6 n-3 intake of 250 mg to prevent cardio-vascular diseases in healthy subjects, 100 g of this type of lamb meat, which contains on average 25 mg of 20:5 n-3 + 22:6 n-3 per 100 g of meat, provides 10% of the recommended daily dose for adults. In children aged between 6 and 12 months, the Institute of Medicine (IOM Citation2002) reports that a dietary intake of 500 mg of PUFA n-3 per day is adequate. Based on our study, a portion of 100 g of Sarda suckling lamb meat contains about 70 mg of PUFA n-3 (Table ) and could satisfy about 14% of the recommended intake. This is of particular interest considering that lamb is the first meat usually recommended by Italian paediatricians at weaning, because of its effectiveness in babies with food-induced atopic dermatitis (Cantani Citation2006). It is important to highlight that in our study the nutritional parameters were assessed in a portion of raw meat, and that, as stated by Nudda et al. (Citation2013), during cooking the concentration of almost all FA, especially PUFA n-3, in the meat of Sarda suckling lamb increases significantly by approximately 40% compared to the raw meat.
Table 4. Content of fatty acid groups and nutritionally important fatty acids (mg/100 g of meat) in Femoral biceps muscle of Sarda suckling-lambs in different slaughter months.
Conclusions
The results obtained in this study evidenced that the meat of Sarda suckling lambs maintained a high amount of beneficial FA, especially of the omega-3 family and CLA, over time, whereas several other fatty acids varied from December to April. Because Sardinia suckling lambs are fed almost exclusively milk from their mothers, variations in meat FA profile can be attributed mainly to changes in the diet of their dams. This study evidenced a considerable amount of 20:5 n-3 and 22:6 n-3 in the meat of suckling lamb, which can be nutritionally favourable considering that lamb meat in Italy is commonly included in the infant diet at weaning.
Acknowledgements
The authors thank Roberto Rubattu for rendering technical assistance and the Forma Centro Carni Srl (Macomer, Sardinia, Italy) for providing the meat samples. This research did not receive any specific grant from funding agencies in the public, commercial, or not-for-profit sectors.
Disclosure statement
No potential conflict of interest was reported by the authors.
Related Research Data
References
- Addis M, Fiori M, Manca C, Riu G, Scintu MF. 2013. Muscle colour and chemical and fatty acid composition of “Agnello di Sardegna” PGI suckling lamb. Small Rumin Res. 115:51–55.
- Albani V, Celis-Morales C, O'Donovan CB, Walsh MC, Woolhead C, Forster H, Fallaize R, Macready AL, Marsaux CFM, Navas-Carretero S. et al. 2017. Within-person reproducibility and sensitivity to dietary change of C15:0 and C17:0 levels in dried blood spots: data from the European Food4Me Study. Mol Nutr Food Res. 61:1–9.
- Alves SP, Marcelino C, Portugal PV, Bessa RJB. 2006. Short communication: The nature of heptadecenoic acid in ruminant fats. J Dairy Sci. 89:170–173.
- AOAC. 2000. Official methods of analysis. 17th ed. Arlington (VA): Association of Official Analytical Chemists.
- Barceló-Coblijn G, Murphy EJ. 2009. Alpha-linolenic acid and its conversion to longer chain n–3 fatty acids: benefits for human health and a role in maintaining tissue n–3 fatty acid levels. Prog Lipid Res. 48:355–374.
- Berge P, Sañudo C, Sanchez A, Alfonso M, Stamataris C, Thorkelsson C, Piasentier E, Fisher AV. 2003. Comparison of muscle composition and meat quality traits in diverse commercial lamb types. J Muscle Foods. 14:281–300.
- Cantani A. 2006. A home-made meat-based formula for feeding atopic babies: a study in 51 children. Eur Rev Med Pharmacol Sci. 10:61–68.
- Cardi E, Corrado G, Cavaliere M, Frandina G, Pacchiarotti C, Rea P, Mazza ML, Nardelli F, Agazie E. 1998. Rezza-Cardi’s diet as dietary treatment of short bowel syndrome. Gastroenterology. 114:A869.
- Ciesielski J, Su T-P, Tsai S-Y. 2016. Myristic acid hitchhiking on sigma-1 receptor to fend off neurodegeneration. Receptors Clin Investig. 3:e1114.
- Commission Regulation (EC) No 138/2001 of 24 January 2011 supplementing the Annex to Regulation (EC) No 2400/96 on the entry of certain names in the ‘Register of protected designation of origin and protected geographical indications’ provided for in Council Regulation (EEC) No 2081/92 on the protection of geographical indications and designations of origin for agricultural products and foodstuffs. Off J Eur Commun, L 23, 25 January 2001. [accessed 2016 March 9] http://eur-lex.europa.eu/legal-content/EN/TXT/PDF/?uri=CELEX:32001R0138&from=EN
- Dabadie H, Peuchant E, Bernard M, LeRuyet P, Mendy F. 2005. Moderate intake of myristic acid in sn-2 position has beneficial lipidic effects and enhances DHA of cholesteryl esters in an interventional study. J Nutr Biochem. 16:375–382.
- Derakhshande-Rishehri SM, Mansourian M, Kelishadi R, Heidari-Beni M. 2015. Association of foods enriched in conjugated linoleic acid (CLA) and CLA supplements with lipid profile in human studies: a systematic review and meta-analysis. Public Health Nutr. 18:2041–2054. p
- Demirel G, Ozpinar H, Nazli B, Keser O. 2006. Fatty acids of lamb meat from two breeds fed different forage: concentrate ratio. Meat Sci. 72:229–235.
- EFSA. 2010. Scientific opinion on dietary reference values for fats, including saturated fatty acids, polyunsaturated fatty acids, monounsaturated fatty acids, trans fatty acids, and cholesterol. EFSA J. 8:1461–1568.
- ES ISO 5508. 1990. Animal and vegetable fats and oils – analysis by gas chromatography of methyl esters of fatty acids. European Standard ISO 5508. Brussels: European Committee for Standardization.
- FAO. Food and Agriculture Organization of the United Nations. 2003. Food energy – methods of analysis and conversion factors. In: FAO Food and Nutrition Paper No. 77. Report of a Technical Workshop, Rome, 3-6 December 2002. Rome: FAO; p. 23–26.
- Fernández M, Ordóñez JA, Cambero I, Santos C, Pin C, de la Hoz L. 2007. Fatty acid compositions of selected varieties of Spanish dry ham related to their nutritional implications. Food Chem. 101:107–112.
- Field CJ, Blewett HH, Proctor S, Vine D. 2009. Human health benefits of vaccenic acid. Appl Physiol Nutr Metab. 34:979–991.
- Folch J, Lees M, Sloane Stanley GH. 1957. A simple method for the isolation and purification of total lipides from animal tissues. J Biol Chem. 226:497–509.
- FDA. U.S. Food and Drug Administration. 2013. Guidance for Industry: A Food Labeling Guide (10. Appendix B: Additional Requirements for Nutrient Content Claims). [accessed 2016 March 9] http://www.fda.gov/Food/GuidanceRegulation/GuidanceDocumentsRegulatoryInformation/LabelingNutrition /ucm064916.htm
- Gallardo B, Manca MG, Mantecón AR, Nudda A, Manso T. 2015. Effects of linseed oil and natural or synthetic vitamin E supplementation in lactating ewes' diets on meat fatty acid profile and lipid oxidation from their milk fed lambs. Meat Sci. 102:79–89.
- Hajji H, Joy M, Ripoll G, Smeti S, Mekki I, Molino Gahete F, Mahouachi M, Atti N. 2016. Meat physicochemical properties, fatty acid profile, lipid oxidation and sensory characteristics from three North African lamb breeds, as influenced by concentrate or pasture finishing diets. J Food Compos Anal. 48:102–110.
- Indurain G, Beriain MJ, Sarries MV, Insausti K. 2010. Effect of weight at slaughter and breed on beef intramuscular lipid classes and fatty acid profile. Animal. 4:1771–1780.
- IOM. Institute of Medicine of the National Academies. 2002. Dietary fats: total fat and fatty acids. In: Dietary reference intakes for energy, carbohydrate, fiber, fat, fatty acids, cholesterol, protein, and amino acids macronutrients. Washington (DC): The National Academies Press. p. 422–541.
- ISTAT. 2014. Tavola A09 Macellazione di ovini e caprini, per categoria di animali abbattuti (peso in quintali). Dettaglio per regione – Anno 2014. Rome: Istituto Nazionale di Statistica; [accessed 2016 Mar 9] http://agri.istat.it/sag_is_pdwout/jsp/dawinci.jsp?q=plA090000010000012000&an=2014&ig=1&ct=295&id=9A|8A|10A|49A
- Jerónimo E, Alves SP, Prates JAM, Santos-Silva J, Bessa RJB. 2009. Effect of dietary replacement of sunflower oil with linseed oil on intramuscular fatty acids of lamb meat. Meat Sci. 83:499–505.
- Juárez M, Horcada A, Alcalde MJ, Valera M, Mullen AM, Molina A. 2008. Estimation of factors influencing fatty acid profiles in light lambs. Meat Sci. 79:203–210.
- Kang MJ, Shin MS, Park JN, Lee SS. 2005. The effects of polyunsaturated:saturated fatty acids ratios and peroxidisability index values of dietary fats on serum lipid profiles and hepatic enzyme activities in rats. Br J Nutr. 94:526–532.
- Kramer JKG, Cruz-Hernandez C, Deng Z, Zhou J, Jahreis G, Dugan MER. 2004. Analysis of conjugated linoleic acid and trans 18:1 isomers in synthetic and animal products. Am J Clin Nutr. 79:1137S–1145S.
- Kramer JKG, Fellner V, Dugan MER, Sauer FD, Mossoba MM, Yurawecz MP. 1997. Evaluating acid and base catalysts in the methylation of milk and rumen fatty acids with special emphasis on conjugated dienes and total trans fatty acids. Lipids. 32:1219–1228.
- Kramer JKG, Hernandez M, Cruz-Hernandez C, Kraft J, Dugan MER. 2008. Combining results of two GC separations partly achieves determination of all cis and trans 16:1, 18:1, 18:2 and 18:3 except CLA isomers of milk fat as demonstrated using Ag-ion SPE fractionation. Lipids. 43:259–273.
- Krogager TP, Nielsen LV, Kahveci D, Dyrlund TF, Scavenius C, Sanggaard KW, Enghild JJ. 2015. Hepatocytes respond differently to major dietary trans fatty acid isomers, elaidic acid and trans-vaccenic acid. Proteome Sci. 13:31.
- Lambe NR, McLean KA, Gordon J, Evans D, Clelland N, Bunger L. 2017. Prediction of intramuscular fat content using CT scanning of packaged lamb cuts and relationships with meat eating quality. Meat Sci. 123:112–119.
- Lane MA, Jesse BW. 1997. Effect of volatile fatty acid infusion on development of the rumen epithelium in neonatal sheep. J Dairy Sci. 80:740–746.
- Lauritzen L, Brambilla P, Mazzocchi A, Harsløf LB, Ciappolino V, Agostoni C. 2016. DHA effects in brain development and function. Nutrients. 8:1–17.
- Luna P, Rodríguez-Pino V, de la Fuente MA. 2009. Occurrence of C16:1 isomers in milk fats from ewes fed with different dietary lipid supplements. Food Chem. 117:248–253.
- Martino F, Bruno G, Aprigliano D, Agolini D, Guido F, Giardini O, Businco L. 1998. Effectiveness of a home-made meat based formula (the Rezza-Cardi diet) as a diagnostic tool in children with food-induced atopic dermatitis. Pediatr Allergy Immunol. 9:192–196.
- Mazzone G, Giammarco M, Vignola G, Sardi L, Lambertini L. 2010. Effects of the rearing season on carcass and meat quality of suckling Apennine light lambs. Meat Sci. 86:474–478.
- Nudda A, Battacone G, Bee G, Boe R, Castanares N, Lovicu M, Pulina G. 2015. Effect of linseed supplementation of the gestation and lactation diets of dairy ewes on the growth performance and the intramuscular fatty acid composition of their lambs. Animal. 9:800–809.
- Nudda A, Battacone G, Bencini R, Pulina G. 2004. Nutrition and milk quality. In: Pulina G, editor. Dairy sheep nutrition. Wallingford: CABI Publishing, ISBN: 0-85199-681-7; p. 129–149.
- Nudda A, Battacone G, Boaventura Neto O, Cannas A, Francesconi AHD, Atzori AS, Pulina G. 2014. Feeding strategies to design the fatty acid profile of sheep milk and cheese. R Bras Zootec. 43:445–456.
- Nudda A, Battacone G, Boe R, Manca MG, Rassu SPG, Pulina G. 2013. Influence of outdoor and indoor rearing system of suckling lambs on fatty acid profile and lipid oxidation of raw and cooked meat. Ital J Anim Sci. 12:459–467.
- Palmquist DL, Lock AL, Shingfield KJ, Bauman DE. 2005. Biosynthesis of conjugated linoleic acid in ruminants and humans. Adv Food Nutr Res. 50:179–217.
- Penedo LA, Nunes JC, Gama MA, Leite PE, Quirico-Santos TF, Torres AG. 2013. Intake of butter naturally enriched with cis9,trans11 conjugated linoleic acid reduces systemic inflammatory mediators in healthy young adults. J Nutr Biochem. 24:2144–2151.
- Pintus S, Murru E, Carta G, Cordeddu L, Batetta B, Accossu S, Pistis D, Uda S, Ghiani ME, Mele M, et al. 2013. Sheep cheese naturally enriched in α-linolenic, conjugated linoleic and vaccenic acids improves the lipid profile and reduces anandamide in the plasma of hypercholesterolaemic subjects. Br J Nutr. 109:1453–1462.
- Ran-Ressler RR, Khailova L, Arganbright KM, Adkins-Rieck CK, Jouni ZE, Koren O, Ley RE, Brenna JT, Dvorak B. 2011. Branched chain fatty acids reduce the incidence of necrotizing enterocolitis and alter gastrointestinal microbial ecology in a neonatal rat model. PLoS One. 6: e29032.
- Rassu SPG, Nudda A, Carzedda C, Battacone G, Bencini R, Pulina G. 2015. A partial suckling regime increases milk production in Sarda dairy sheep without affecting meat quality of lambs. Small Rumin Res. 125:15–20.
- Serra A, Mele M, La Comba F, Conte G, Buccioni A, Secchiari P. 2009. Conjugated Linoleic Acid (CLA) content of meat from three muscles of Massese suckling lambs slaughtered at different weights. Meat Sci. 81:396–404.
- Sofi F, Buccioni A, Cesari F, Gori AM, Minieri S, Mannini L, Casini A, Gensini GF, Abbate R, Antongiovanni M. 2009. Effects of a dairy product (pecorino cheese) naturally rich in cis-9, trans-11 conjugated linoleic acid on lipid, inflammatory and haemorheological variables: a dietary intervention study. NMCD. 20:117–124.
- Terré M, Nudda A, Casado P, Bach A. 2011. The use of glycerine in rations for light lamb during the fattening period. Anim Feed Sci Technol. 164:262–267.
- Turpeinen AM, Mutanen M, Aro A, Salminen I, Basu S, Palmquist DL, Griinari JM. 2002. Bioconversion of vaccenic acid to conjugated linoleic acid in humans. Am J Clin Nutr. 76:504–510.
- Ulbricht TLV, Southgate DAT. 1991. Coronary heart disease: seven dietary factors. Lancet. 338:985–992.
- USDA. 2016. United States Department of Agriculture, Agricultural Research Service, National Nutrient Database for Standard Reference Release 28; [accessed 2016 May 20] https://ndb.nal.usda.gov/ndb/search
- Velasco S, Cañeque V, Pérez C, Lauzurica S, Dı́az MT, Huidobro F, Manzanares C, González J. 2001. Fatty acid composition of adipose depots of suckling lambs raised under different production systems. Meat Sci. 59:325–333.
- Vlaeminck B, Dufour C, van Vuuren AM, Cabrita ARJ, Dewhurst RJ, Demeyer D, Fievez V. 2005. Use of odd and branched-chain fatty acids in rumen contents and milk as a potential microbial marker. J. Dairy Sci. 88:1031–1041.
- Wada Y, Sakiyama S, Sakai H, Sakane F. 2016. Myristic acid enhances diacylglycerol kinase δ-dependent glucose uptake in myotubes. Lipids. 51:897–903.
- Wang Y, Lu J, Ruth MR, Goruk SD, Reaney MJ, Glimm DR, Vine DF, Field CJ, Proctor SD. 2008. Trans-11 vaccenic acid dietary supplementation induces hypolipidemic effects in JCR:LA-cp rats. J Nutr. 138:2117–2122.
- Williams PG. 2007. Nutritional composition of red meat. Nutr Diet. 64: S113–S119.