
 ?Mathematical formulae have been encoded as MathML and are displayed in this HTML version using MathJax in order to improve their display. Uncheck the box to turn MathJax off. This feature requires Javascript. Click on a formula to zoom.
Abstract
This study evaluated the predicted glycemic index (pGI) in former food products (FFPs), and in two pig compound feeds formulated with or without the inclusion of FFPs. Six samples of FFPs and two pig compound feeds were used. FFPs were based on bakery and confectionary ex-food, while the pig compound feed was formulated by substituting 30% of cereals with FFPs (Feed FFP30%). All samples were analysed using an in vitro Englyst assay that simulates gastric and small intestinal digestion, and which has been proposed to determine the hydrolysis index (HI) and predict the glycemic index (pGI) of cereal-based foods introduced into pig diets. Corn meal, heat processed wheat and a conventional pig compound feed (Feed CTR) were included as control feed ingredients. In the assay, white bread was used as reference material. The results differentiated between two main groups of samples, namely: low HI samples with an HI lower than 100 including corn meal, Feed CTR, Feed FFP30%, flaked wheat and FFP4; and high HI samples including all the other FFPs tested. The same classification can be adopted for pGI. Thus combining HI and pGI results suggests that most of the FFPs tested in the present study were characterised by a high glycemic index potential which seems to be linked to the starch/sugars HI. The inclusion of FFPs in a commercial compound feed, and its effect on HI and pGI, merit further investigations.
Ex-Food are food waste biomasses upgraded to feed ingredients; they are characterised by quick carbohydrates digestion and high glycemic index.
Highlights
Introduction
Insects, algae, ex-food (also termed former food products) as well as duckweed are looked as an interesting alternative protein/energy sources for feed and are expected to be increasingly used around the globe as replacers for conventional nutrients sources (Pinotti et al. Citation2019). The use of non-human-edible by/co-products, like former food products (FFPs) or ex-food, by the feed industry is evidence of the potential of this sector in making the best of the nutritional and economic added value of by-co-products applying circular economy principles. Former Foodstuffs Products (FFPs) are circularly economy animal feed ingredients composed by processed and ready-to-eat food products, no longer suitable for human consumption due to logistical, manufacturing or packaging defects. They represent a way in which these high-quality unintentional food losses return to the food chain. Rejected bread, different cookie products, high-quality baked goods and confectionary from industrial cookie and biscuit bakeries are dried and consecutively sorted, unpacked, ground and sieved to create suitable ingredients, which replace some of the existing raw materials in various animal compound feed.
Previous studies have characterised nutrient composition, energy value, digestibility (Giromini et al. Citation2017; Liu et al. Citation2018) and safety features (Tretola, Di Rosa, et al. Citation2017; Tretola, Ottoboni, et al. Citation2017) of FFPs. These studies have highlighted that FFPs are a valuable energy source, characterised by a valuable sugar/starch content (Giromini et al. Citation2017), although certain low digestible nutrients may be also present (Liu et al. Citation2018). This characteristic has designated them as an excellent energy source for pig diets.
Carbohydrates, above all starch, represent the major energy source in diets designed for pigs (Stevnebø et al. Citation2006). Characterising the digestion potential of carbohydrates and improving their use is very important. To investigate the kinetics of the carbohydrate/starch digestion of cereal-based feeds, several authors (Menoyo et al. Citation2011; Drew et al. Citation2012) have adopted an approach to pig nutrition based on the glycemic index (GI) classification. However, considering the complexity and cost of in vivo GI determinations, an in vitro GI prediction (pGI) could be a valuable alternative (Giuberti, Gallo, Masoero Citation2012). Predicted GI can thus be adopted both for human (Capriles et al. Citation2008) and animal (Solà-Oriol et al. Citation2010) nutrition purposes, for expressing the kinetics of carbohydrate digestion by ranking cereal-based materials with respect to their enzymatic hydrolysis raising potential (expressed as a hydrolysis index; HI).
Various responses in productive performance are possible in pigs fed diets based on different cereal-based sources, which also differ in starch digestibility (Giuberti, Gallo, Cerioli, et al. Citation2012). Specifically, diets with increased GI (which is considered a positive element in animal nutrition), can result in an increased feed intake, due to a faster clearance of glucose in the blood and thus a more rapid return to a state of hunger (Menoyo et al. Citation2011; Giuberti, Gallo, Cerioli, et al. Citation2012; Doti et al. Citation2014). Consequently, it is important to determine the GI not only in conventional feedstuffs (Prandini et al. Citation2016), but also in FFPs and pig compound feed formulated with FFPs, which have never been investigated before.
The aim of this study was thus to evaluate the in vitro carbohydrate digestion and related pGI values in former foodstuff products and in pig compound feed formulated with FFPs. As omnivores, pigs are ideally suited to convert these FFPs as well as other non-human-edible by/co-products, into high-quality animal protein food.
Materials and methods
Samples
In this study, six FFP samples, (collected within the framework of the IZS PLV 06/14 RC project funded by the Italian Ministry of Health), and two pig compound feeds formulated without (Feed CTR) or with the inclusion of FFPs (Feed FFP30%) were analysed. FFPs were produced using different ex-food materials, as described in Giromini et al. (Citation2017), which also reports the nutritional features. The pig compound feed without the inclusion of FFPs (Feed CTR) was represented by a commercial complete pig feed, while in Feed FFP30%, 30% (on an as-is basis) of FFP2 was included as a substitute for conventional feed ingredients (wheat, barley, corn and whey permeate). The FFP2 was produced starting from leftover of the food industry (bakery products, pasta, of pastry products industry, confectionery products), and wheat products and by-products. The diets were iso-energetic (16.0 MJ/kg DM) and iso-nitrogenous (20.5% DM), and met NRC (Citation2012). Details of the two pig compound feed are reported in Tretola et al. (Citation2018a). In all the experiments performed, heat processed wheat and unprocessed maize samples were included as control feed ingredients. Heat-processed wheat was selected as the experimental control because the FFPs considered in this study were obtained from ex-food materials in which the starch was previously exposed to food-technology processes (e.g. heat treatments, steam flaking, pelleting). All samples were milled through a 1-mm screen (Model 160-D, Jacobsen Machine Works, Minneapolis, MN) and stored at 4 °C until analysis.
Chemical analyses
All samples were analysed in terms of moisture, crude protein (CP), ether extract (EE), neutral detergent fibre (NDF), sugars, starch and ash, as proposed by the AOAC (Citation2005) and the European Commission (Citation2009) regulation. Specifically, the moisture of samples was determined by an oven-drying method (130 °C for 2 h). All data were presented on a dry matter (DM) basis. Crude protein content was measured according to the Kjeldahl method (AOAC Citation2005). Ether extract content was determined by the Soxhlet method, with prior hydrolysis, as proposed by the European Commission (Citation2009). Neutral detergent fibre analyses were performed according to the AOAC (Citation2005) methods 2002.04, using an Ankom 220 fibre analyser (ANKOM™ Technology, Fairport, NY). Neutral detergent fibre was measured using heat-stable amylase and expressed without including residual ash (aNDFom). Sugar was determined according to the official method of the European Commission (Citation2009). Starch content was determined using a polarimetric method (European Commission Citation2009). Ash was measured using a muffle furnace at 550 °C (AOAC Citation2005).
In vitro digestion procedure
An in vitro technique was conducted to fully characterise the in vitro carbohydrate digestion potential of the samples. FFPs were characterised in terms of their time-course carbohydrate digestion potential according to the protocol detailed by Englyst et al. (Citation1992) and Giuberti, Gallo A, Masoero (2012) with minor adaptations. The in vitro digestion was serially performed on each FFP sample twice (two analytical replicates). In each digestion series, FFPs, control and blank (digestion enzymes alone) samples were included in duplicate (two technical replicates). The protocol does not include mouth digestion since it is known that in vivo food is quickly swallowed and passed along the oesophagus to the stomach, where the pH is unfavourable for salivary alpha-amylase activity (McDonald et al. Citation2012).
Briefly, the method consists of a two-step enzymatic hydrolysis that simulates the gastric and pancreatic phases. Ground samples (about 800 mg) were placed in 100 mL screw cap bottles containing glass beads and a 0.05 M HCl solution (5 mL). Samples were incubated with a fresh pepsin solution (5 mg/mL; P-7000, Sigma-Aldrich) for 30 min at 39 °C in a shaking water bath under horizontal agitation. Subsequently, 10 mL of an 0.25 M sodium acetate buffer was added to adjust the pH to 5.2. In addition, 4.5 mL of a fresh amylase-activity enzyme mixture was prepared by mixing 0.7 g pancreatin (P7545, Sigma-Aldrich), 0.05 mL amyloglucosidase (A-7095, Sigma-Aldrich) and 3 mg invertase (I-4504, Sigma-Aldrich), as described by van Kempen et al. (Citation2010). Each bottle was placed in a shaking water bath at 39 °C under horizontal agitation (simulation of the small intestinal phase) and incubated for up to 180 min. To fully characterise the carbohydrate digestion rate, seven incubation time points were investigated. In particular, aliquots (0.5 mL) were collected from each tube at 0, 15, 30, 60, 90, 120, and 180 min, then 2 mL of absolute ethanol was added and the amount of released glucose was determined by a colorimetric analysis with a glucose oxidase activity assay kit (Megazyme).
Model used
Using the data obtained from the in vitro method, the proportion of digested carbohydrates for each time point (DCt) was calculated by the following equation:
As suggested by Mahasukhonthachat et al. (Citation2010) for in vitro techniques with pepsin pre-treatment, the C0 time point was included in the model. The first-order equation [EquationEq. (1)(1)
(1) ] has the form:
(1)
(1)
where Ct is the amount of carbohydrates digested at time t (g/100 g total dry carbohydrates), C0 is the amount of carbohydrates digested at 0 min (g/100 g dry carbohydrates), C∞ is the potential digestibility of total carbohydrates (g/100 g total carbohydrates), k is the digestion rate (/min), and t is the incubation time (min). The only modification applied to the original model was the inclusion of C0, which is utilised for in vitro techniques with pepsin pre-treatment (Mahasukhonthachat et al. Citation2010). For data fitting, C0, C∞ and k values were obtained by the Marquardt method using the PROC NLIN procedure of SAS, Cary, NC (2003).
Areas under the digestion curves (AUC) were then calculated up to 180 min of incubation. The HI was derived from the ratio between the AUC for each sample and the corresponding area for a reference product. Thus, white bread = 100, with a total carbohydrates content of 750 g·kg−1 DM was selected. From the HI obtained in vitro, a pGI was calculated for each sample using the equation reported by Giuberti, Gallo, Masoero (Citation2012). The equation [EquationEq. (2)(2)
(2) ] has the form:
(2)
(2)
Considering HI of white bread = 100 by definition.
Statistical analysis
Data were analysed using IBM SPSS Statistics v. 25, Armonk, NY. Carbohydrate digestion parameters for FFP samples were analysed using one-way analysis of variance (ANOVA) in order to compare means. The analysis was performed using the following model:
where yij is the observations (values); μj is the mean of the observations for the jth group (sample); and ɛij represents the within-sample random variability. The minimum significant difference (MSD) was generated from Tukey’s test which was used as the basis of the multiple comparisons among means. Differences with p < .05 were considered significant.
Principal component (PC) analysis was performed on all data recorded for all samples, namely: unprocessed maize and heat processed wheat, FFPs 1–6, and feed formulated without (Feed CTR) or with the inclusion of FFPs (Feed FFP30%). The loading plots of PC1 and PC2, the first two eigenvalues, were used to verify relations among compositional values and digestion variables, namely: HI, pGI and carbohydrates digested at 0 min (C0), potential digestibility of carbohydrates (C∞) and rate of carbohydrate digestion (k). The relationships among variables were quantified with Spearman’s correlation coefficient rho (ρ). Based on these results, before proceeding further with the PCA, the data set was refined. In order to use a final functional dataset in multivariate analyses, most redundancy should be avoided. Thus, based on the correlation matrix, if two variables scored an R-value higher than 0.9, one was excluded. If both variables are included in a dataset, then essentially one character/feature is included with a double weighting factor. This was the case with HI and C∞ with pGI. As expected, HI and pGI were highly correlated (ρ = 1.00; p < .001), as were pGI and C∞, (ρ = 0.97; p < .001), thus both variables were excluded from the multivariate analyses. The same approach was adopted for sugars and ash.
Results
The composition of both the heat-processed wheat and unprocessed maize, and the mean value of six FFPs, and two pig compound feeds are reported in Table .
Table 1. Chemical composition of control feed ingredients, and mean value of the six former food products, and feed formulated without (Feed CTR) or with the inclusion of FFP (Feed FFP30%).
The model parameters, HI and pGI values of FFPs, and control samples (unprocessed maize and heat processed wheat) are presented in Table . In addition, Figures and show the time course of average cumulative in vitro carbohydrate digestion (as a fraction of total dry carbohydrates) of cereal grains, namely heat processed wheat and unprocessed maize, together with six FFP samples. The HI and the pGI for white bread, used as reference material, were by definition 100 and 101.3, respectively.
Table 2. Hydrolysis index, predicted glycaemic index, and model parameters of unprocessed maize and heat processed wheat, former food products (FFP) 1–6, and feed formulated without (Feed CTR) or with the inclusion of FFP (Feed FFP30%) and relative standard deviation (SD) (n replicates = 2).
As reported in Table , unprocessed maize showed the lowest HI and pGI values compared to both white bread and the other samples tested. Unprocessed maize HI and pGI were in fact 20% lower than white bread, while for the same variables, wheat showed values around 90, i.e. higher than unprocessed maize. With regard to FFPs, the overall means for HI and pGI were 104.5 and 105.9, respectively. Specifically, five of the six FFPs analysed were characterised by higher values in both HI and pGI, compared to unprocessed maize, heat processed wheat, and white bread. By contrast, one sample showed HI and pGI below the control and reference materials considered (i.e. unprocessed maize, heat processed wheat, and white bread). The FFP4 showed similar HI and pGI values to unprocessed maize (p > .05) and lower than heat processed wheat (p < .05). Considering the two experimental pig compound feeds, no difference was observed between Feed CTR and Feed FFP30% in terms of both HI and GI. In addition, compared to the control and reference materials considered (i.e. unprocessed maize, heat processed wheat, and white bread), both diets were also characterised by a comparable HI and pGI.
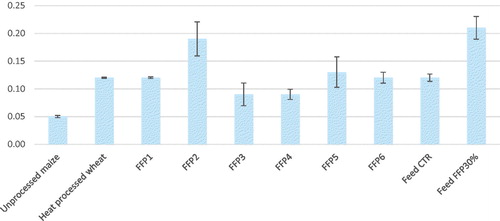
With regard to the digestion kinetic parameters, in the control feed ingredients (i.e. unprocessed maize and heat processed wheat), and FFPs and pig compound feeds, C0 values ranged from 0.92 for FFP4 to 13.7 for Feed CTR, while unprocessed maize and heat processed wheat scored 1.04 and 1.72, respectively. Most of the FFPs showed intermediate values compared to the previous two types of samples (i.e. diets and common cereal grains). Considering the potential digestibility of total carbohydrates (C∞, g/100 g total carbohydrates), C∞ ranged from 62.32 to 99.75/100 g total carbohydrates, while k values ranged from 0.05 to 0.21/min, with the lowest and highest values recorded for unprocessed maize and Feed FFP30%, respectively (Figure ).
Figure 1. Rate of carbohydrate digestion (/min), k, of cereal grains (unprocessed maize and heat processed wheat) and former food products (FFPs) 1–6, and feed formulated without (Feed CTR) or with the inclusion of FFP (Feed FFP30%) and relative standard deviation (n replicates = 2). FFP -- former food product.
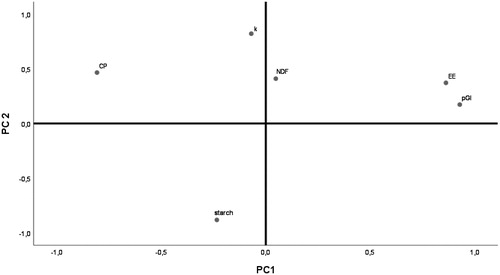
In order to obtain a more comprehensive picture of the results, both compositional and carbohydrate digestion variables were tested in a PCA (Figure ). The PCA showed that PC1 and PC2 explained 72.0% of the total variability among the chemical composition and carbohydrate digestion variables of all the samples tested (Figure ). In the loading plot, pGI and EE, which were highly correlated (R = 0.812; p < .001), showed a large positive loading on component 1 (PC1). By contrast, the rate of carbohydrate digestion (k) showed the largest positive loadings on component 2 (PC2).
Figure 2. Loading plots from principal component analysis describing the relationship between the predicted glycaemic index (pGI), rate of carbohydrate digestion (k), and selected chemical compounds (CP: crude protein; EE: ether extract; FFP: former food product; NDF: neutral detergent fibre, and starch) in maize and heat processed wheat, FFPs 1–6, and compound feed formulated without or with the inclusion of FFPs.
Considering the average cumulative (Figure ) and absolute curves (Figure ) of the time course carbohydrate digestion release (given as a fraction of total carbohydrates digested during seven different incubation times), considerable differences were observed. The graphical representation reflects the evidence observed among samples in relation to HI and pGI. Specifically, unprocessed maize carbohydrates were digested slowly and showed the lowest digestion curve at all time intervals, whereas all FFPs, and both Feed CTR and Feed FFP30%, and heat-processed wheat were digested faster and to a higher extent for almost the entire incubation period. As in the case of HI and pGI, the rate of carbohydrate digestion in FFP4, and both the Feed CTR and Feed FFP30% samples was intermediate between unprocessed maize and heat processed wheat, while in all the other FFP samples (FFP1, FFP1, FFP3, FFP5 and FFP6), the rate of total carbohydrate digestion was faster.
Figure 3. Time course of average cumulative in vitro carbohydrate digestion (as a fraction of total carbohydrates) of cereal grains (unprocessed maize and heat processed wheat) and former food products (FFPs) 1–6, and feed formulated without (Feed CTR) or with the inclusion of FFPs (Feed FFP30%) (n replicates = 2). FFP – former food product.
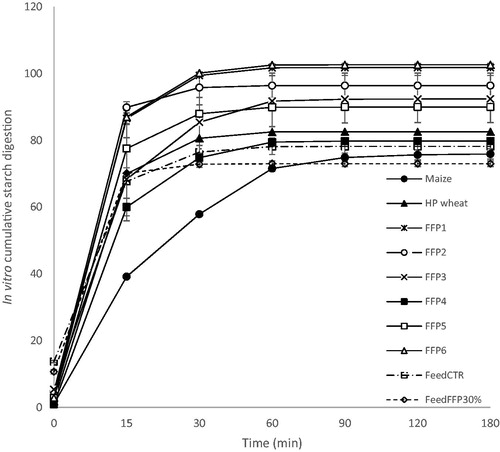
Figure 4. Time course of average absolute in vitro total carbohydrate digestion (as a fraction of total carbohydrates/min) of cereal grains (unprocessed maize and heat processed wheat) and former food products (FFPs) 1–6, and feed formulated without (Feed CTR) or with the inclusion of FFPs (Feed FFP30%) (n replicates = 2). FFP – former food product.
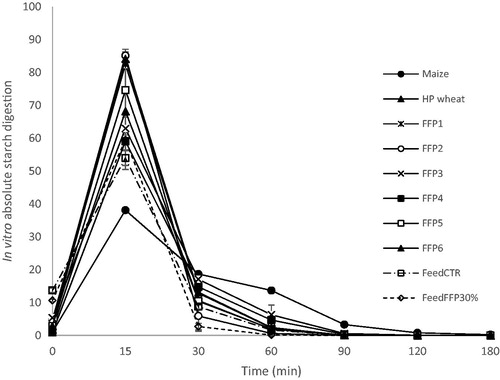
For all samples, the in vitro absolute carbohydrate digestion curves peaked at 15 min after the start of incubation (Figure ), when the fraction of total carbohydrates digested ranged from 42% to 86% for unprocessed maize and FFP2, respectively. Subsequent time points did not show substantial differences among samples.
In terms of in vitro cumulative carbohydrates digestion, the main differences among samples were reported after 15 min of incubation. At this point, the unprocessed maize sample exhibited the main difference in terms of cumulative in vitro glucose release, showing the lowest value of glucose release among the tested samples. Considering the subsequent incubation time points, all FFP samples showed a higher cumulative in vitro glucose release compared to both unprocessed maize and heat processed wheat samples. The only exception was FFP4, which showed a higher cumulative in vitro glucose release than unprocessed maize, but lower than heat processed wheat for the same incubation times (from 30 to 180 min). However, FFP4 had the slowest in vitro absolute carbohydrate digestion values recorded in all the FFPs.
Discussion
As reported elsewhere (Giuberti, Gallo, Masoero Citation2012), from a compositional point of view, the control materials (i.e. unprocessed maize and heat processed wheat) were in line with published data. The FFPs were characterised by a satisfactory starch and high simple sugar concentrations, which were also combined with an adequate fat content, as already reported in Giromini et al. (Citation2017). In general, the tested FFPs were excellent carbohydrate sources, combining simple and complex sugars in the same food matrix, which was also fat enriched. These data seem to be in line with various recent works (Pinotti et al. Citation2019; Tretola, Di Rosa, et al. Citation2017; Tretola, Ottoboni, et al. Citation2017) which reported FFPs as being a ‘fortified version of cereals’, with a valuable energy content thanks to their sugar and high digestible starch content. An adequate fat content can also contribute to defying the energy density of these materials. Dietary starch is one of the major energy sources for monogastrics, and effective starch digestion has a great impact on animal energy status.
However, one of the main concerns regarding these materials and their potential as alternative feed ingredients is the fact that their composition and some nutritional features can vary (i.e. free sugars and fat content), which should be evaluated with caution in order to ensure an appropriate animal diet inclusion. Although the present study did not cover all types of potentially produced FFPs, we believe that it provides the first comprehensive investigation of the most common types of these materials.
With regard to carbohydrate digestion, Hi and pGI of the tested samples, as expected, all these values were lower in unprocessed maize than in heat-treated wheat. These results are in line with other authors (Giuberti, Gallo, Masoero Citation2012), who use the same assay, observed great differences between cereals species/varieties, and also within the same species/varieties. Key distinguishing factors in defining HI and pGI values in different grains were the amylose content and technological treatment (Svihus et al. Citation2005; Wiseman Citation2006). In the present study, however, amylose and amylopectin contents were not measured.
Both HI and pGI, as well as the time trend in carbohydrate digestion, were higher in FFPs compared to conventional cereal feed ingredients such as maize. These nutritional and functional features are probably linked to the raw materials used in the preparation of FFPs. In fact, as previously reported, typical FFPs are characterised not only by a valuable sugar/starch content (Giromini et al. Citation2017), but also by several technological (milling etc.) and heat treatments (cooking, extrusion, etc.) (Svihus et al. Citation2005). For human consumption, cereals are usually milled and fractioned to separate the fibre rich-bran (e.g. in wheat flour) and the hulls (e.g. in rice and oats) from the starchy endosperm (Knudsen and Laerke Citation2018). The cooking of grains also generally increases the digestibility of nutrients, and studies on both animal models and humans have demonstrated that processed grains are often nutritionally superior to unprocessed grains, probably due to the enhanced nutrient bioavailability in processed grains (Slavin et al. Citation2000). The cooking, processing and fat content of food, all affect the glycemic response. Postprandial blood glucose profiles have also been found to be higher in subjects that consumed bread made with milled flour compared to bread made with a high proportion of whole cereal grains. In addition, processes that disrupt the physical or botanical structure of food ingredients have led to an increased plasma glucose and insulin responses (Slavin et al. Citation2000).
This explains why today, more bakery and snack foods include some whole grain ingredients/flour (Liu et al. Citation2018). The effects of these kinds of ingredients on feed composition and digestibility have been addressed by Liu et al. (Citation2018). The chemical composition of bakery meal indicates that although the majority of the ingredients probably originate from flours and possibly whole grain cereal foods, high-fibre ingredients are also probably included in the product mix used to produce bakery meal. This explains why in Liu et al’s (Citation2018) study, bakery meal contained more than 40% starch, but concentrations of ADF, NDF and phytate-bound phosphorus were greater than in cereal grains.
FFP samples had higher HI and pGI values compared to maize and heat processed wheat samples. Compared with common cereal grains, FFPs are characterised by a comparable starch content (Giromini et al. Citation2017) and also by a higher content of simple sugars (more than 200 g·kg−1). These sugars have been linked with a higher digestibility potential measured in vitro, which probably affected the results obtained in the present study. The only exception was FFP4 which was composed of puffed cereals (rice and maize crispbreads), with a limited simple sugar content (124 g·kg−1). The values for the same variables (simple sugars, HI and pGI) in the two complete diets were close to those measured in conventional cereals, apart from the content of simple sugars which was over 30% higher in the Feed FFP30% than in Feed CTR.
The HI and pGI values observed are in line with the digestion kinetic parameters. In both control feed ingredients (i.e. maize and wheat), C0 (i.e. carbohydrates digested at 0 min), C∞ (i.e. potential digestibility of carbohydrates), k (i.e. rate of carbohydrate digestion) were generally lower than in almost all the FFPs tested. These values indicate that the quantity of glucose released (over the time) by maize and wheat was quite limited, as in the case of FFP4 which showed the lowest value compared to the other tested samples. This digestion pattern observed for FFP4 seems to be linked to the material used in its preparation, which was extruded and puffed rice and maize cakes involving whole grain processing. As reported by Giuberti, Gallo, Masoero (Citation2012), the technological treatment probably induced a gelatinisation of the starch (not measured in the present work), which affects the glucose release. A different pattern, especially for the potential digestibility of carbohydrates, was recorded for the FFP3, FFP5, FFP2 samples in which the C∞ ranged from 87 to 91. Both values were higher than observed for the control feed ingredients and FFP4, but lower than the remaining FFPs. Specifically, the potential digestibility of carbohydrates reached almost 100% in FFP1 and FFP6, which were characterised by the highest simple sugar content, in line with the confectionary origin of the raw material used for their production.
Regarding the two experimental pig compound feeds, no difference was observed between Feed CTR and Feed FFP30% in terms of both C0 (i.e. carbohydrates digested at 0 min) and C∞ (i.e. potential digestibility of carbohydrates). In comparison with the other samples however, some differences were observed. C0 values ranged from 0.92 for FFP4 to 13.7 for Feed CTR, while maize and processed wheat scored 1.04 and 1.72, respectively. These values showed that both the complete diets (Feed CRT and Feed FFP30%) were probably characterised by high soluble sugars, present in limited amounts in common cereals. Most of the FFPs, with the exception of FFP4, showed intermediate values compared to the diets and common cereals. When the potential digestibility of total carbohydrates (C∞, g/100 g total carbohydrates), was considered, C∞ ranged from 62.32 to 99.75/100 g total carbohydrates, which was in line with the other indexes addressed below.
Considering the digestion rate, according to the classification proposed by Giuberti, Gallo, Masoero (Citation2012), maize meal used as a control feed ingredient, was digested relatively slowly (0.021 ≤ k ≤ 0.070/min), while heat processed wheat and all the six FFPs were digested rapidly (k > 0.071/min). Among ex-food, FFP2 and FFP4 showed the highest and lowest values, respectively. Thus, FFP2 was the fastest to be digested in vitro, followed by the other FFPs which all scored k > 0.071/min, while FFP3 and FFP4 were the most resistant with k > 0.09/min. The main reason for this pattern seems related to the fact that all FFPs were produced starting with cooked ex-food, in which the starch and other carbohydrates had been heat-treated. The exceptions of FFP3 and FFP4 needs to be further investigated, although the food matrix may be involved (Abdulrhman et al. Citation2011). This latter hypothesis seems to be supported by the multivariate analysis. The PCA showed that PC1 and PC2 explained 72.0% of total variability among the chemical composition and carbohydrate digestion variables of all the tested samples (Figure ). In the present loading plot, pGI and EE, have large positive loadings on component 1. Thus, this component (PC1) primarily measures the sample post ingestion glucose response/delivery which was highly correlated to the lipid content. The rate of carbohydrate digestion (k) showed the largest positive loadings on component 2 (PC2), thus variable (k) primarily measured how quick carbohydrates were digested.
Taken together, the present results thus suggest that the kinetics of carbohydrates digestion, as well as HI and pGI, differed greatly among the cereal sources and FFPs, although the proposed assay was able to measure the digestion profiles (Giuberti, Gallo, Cerioli, et al. Citation2012; Svihus et al. Citation2005). Weurding et al. (Citation2001) observed that high starch digestion rates resulted in a more complete starch digestion for broiler chickens. In pigs, higher starch digestion rates minimised the amount of undigested feed material that reached the distal part of the small intestine or in the proximal of colon (Al-Rabadi et al. Citation2011), thus influencing the feed intake by avoiding the ‘ileal brake’ (Black et al. Citation2009). In addition, higher starch digestion rates reduced starch fermentation in the small intestine with an increase in the apparent faecal digestibility of protein, due to a minor excretion of microbial biomass (Sun et al. Citation2006).
Most of the literature has focussed on starch, while limited information is available on simple sugars which actually seem to be a valuable proportion of the carbohydrates present in FFPs. In fact, FFPs contain notable amounts of free sugars (up to ten times those recorded in maize), so they thus have a high pGI. However, while the potential influence on the glycemic index (Giuberti, Gallo, Masoero Citation2012) might be effective in terms of feed intake, practical experience suggests that in pigs, soft faeces are produced in any high-sugar diet (Mavromichalis Citation2012). This means that these types of alternative feed ingredients need to be investigated in terms of their effects on nutritional and health status.
Guo et al. (Citation2015) demonstrated that ‘candy coproducts can be used to replace up to 45% of dietary lactose for nursery pigs without negative effects on growth performance or health status’. In addition, several studies (Mavromichalis et al. Citation2001; Kim and Allee Citation2001; Naranjo et al. Citation2010a; Naranjo et al. Citation2010b) have reported that the performance of nursery pigs was not reduced when less than 50% of dietary lactose was replaced by other carbohydrates from cane sucrose (100% sucrose), carbohydrate products (40–75% sucrose), molasses (47% glucose and fructose), or a milk chocolate products (20% lactose and 60% sugar). Similar results have also been observed in newly-weaned piglets, where the dietary inclusion of sweeteners such as sucrose, lactose, dextrose or artificial high-intensity sweeteners have increased the feed intake and body weight gain (Schlegel and Hall Citation2006).
It has been hypothesised (Sterk et al. Citation2008) that pigs offered sweetened feeds start eating sooner after weaning and also reduce the number of visits to the feeder. In fact, taste modifiers are now regularly used in feed to improve palatability and feed intake in post-weaning piglets. In the present study, however, no in vivo trials were performed. For this reason, two post-weaning piglet complete diets (a cereal-based vs. a FFPs diet) were compared. Data obtained on these materials clearly indicated that the inclusion of 30% FFPs as a substitute for conventional cereals (wheat, barley, corn) has a big impact on the carbohydrate digestion rate (k), which indicates rapid digestion of the carbohydrate fraction (Giuberti, Gallo Masoero 2012). On the other hand, results obtained for HI and pGI in complete diet samples indicate that these indexes are more suitable for single ingredients that complete diets.
Another important aspect of needing to be addressed is related to the gut health of pigs receiving a FFP based diet. Indeed, due to the characteristics and properties of FFP products, such as the high digestibility, a diet containing 30% FFP could differently affect the bacterial population in the large intestine, compared to conventional diets. This aspect has been investigated in an in vivo trial (Tretola et al. Citation2018b) in which FFPs partially replaced common cereal grains in post-weaning piglet’s diets. Results showed that FFPs can be used up to a level of 30% in post-weaning diets with no diarrhoea events. While minor effects on taxa composition of gut microbiota were observed.
Conclusions
This study has evaluated, for what believe is the first time, HI and pGI in former foodstuff products and pig compound feed formulated to include such FFPs. The determination of the pGI, as well as other carbohydrate digestion kinetic parameters, represents a useful approach for an extensive nutritional evaluation of cereal-based feeds rich in starch/sugars, such as FFPs. These variables are sensitive to the carbohydrate digestion potential and speed, which in the present study enabled two main groups of samples to be identified, namely: low HI sample, with HI lower than 100 including corn meal, Feed CTR, Feed FFP30%, flaked wheat and FFP4; and High HI samples including all the other FFPs tested. The same classification can be adopted for pGI.
The inclusion of FFPs in a commercial compound feed, and its effect on HI and pGI have not been so well defined. The results obtained in the present study can thus be divided into two main areas, one regarding the individual ingredients and the other regarding complete diets (tested compound feed). Specifically:
The FFPs assessed in this study showed a higher pGI than common cereal grains and heat processed cereals for feed use. However, the carbohydrate digestion potential as well as its kinetics (measured by C0 – carbohydrates digested at 0 min, C∞ – potential digestibility of carbohydrates and k – rate of carbohydrate digestion) varied considerably among different FFPs, in relation to their original composition.
Both compound feeds formulated without (Feed CTR) or with the inclusion of FFP (Feed FFP30%) showed no differences in term of pGI, HI and other carbohydrate digestion indexes, with the exception of the rate of carbohydrate digestion (k) which increased by 75% in the FFP diet, indicating a quick digestion potential of the carbohydrate fraction.
Although the results are case sensitive (i.e. they represent the situation of a specific set of samples) and are based on in vitro assays, they provide some clear nutritional information, namely: (i) FFPs provide an excellent source of ‘ready-to-use’ carbohydrates, which in turn define their high nutritional/energy value; (ii) their high inclusion in complete diets might affect the rate of carbohydrate digestion, which can be a valuable dietary feature for specific phases and young farm animals.
Disclosure statement
No potential conflict of interest was reported by the authors.
Related Research Data
References
- Abdulrhman M, El-Hefnawy M, Hussein R, El-Goud AA. 2011. The glycemic and peak incremental indices of honey, sucrose and glucose in patients with type 1 diabetes mellitus: effects on C-peptide level-a pilot study. Acta Diabetol. 48:89–94.
- Al-Rabadi GJ, Torley PJ, Williams BA, Bryden WL, Gidley MJ. 2011. Effect of extrusion temperature and pre-extrusion particle size on starch digestion kinetics in barley and sorghum grain extrudates. Anim. Feed Sci Technol. 168:267–279.
- AOAC. 2005. Official methods of analysis. 18th ed. Gaithersburg (MD): Association of Official Analytical Chemists Int.
- Black J, Williams B, Gidley M. 2009. Metabolic regulation of feed intake in monogastric mammals. In: Torrallardona, D., Roura, E, editors. Voluntary feed intake in pigs. Wagenigen, Netherlands: Wageningen Academic Publishers; p 189–214.
- Capriles VD, Coehlo KD, Guerra Matias AC, Arêas J. 2008. Effect of processing methods on amaranth starch digestibility and predicted glycemic index. J Food Sci. 73:160–164.
- Doti S, Suárez-Belloch J, Latorre MA, Guada JA, Fondevila M. 2014. Effect of dietary starch source on growth performances, digestibility and quality traits of growing pigs. Livest Sci. 164:119–127.
- Drew MD, Schafer TC, Zijlstra RT. 2012. Glycemic index of starch affects nitrogen retention in grower pigs. J Anim Sci. 90:1233–1241.
- Englyst HN, Kingman SM, Cummings JH. 1992. Classification and measurement of nutritionally important starch fractions. Eur J Clin Nutr. 46:33–50.
- European Commission. 2009. Commission Regulation (EC) No 152/2009 of 27 January 2009 laying down the methods of sampling and analysis for the official control of feed establishes the sampling method and the methods of analysis of feed for control purposes. Off J L. 54:177.
- European Commission. 2013. Commission Regulation (EC) No 68/2013 of 16 January 2013 on the Catalogue of feed materials. Off J L. 29:1–64.
- Featherstone P. 2014. Keeping food losses in the food chain through animal feed. In: Jovanka L, editor. XVI International Symposium “Feed Technology”. Novi Sad: University of Novi Sad, Institute of Food Technology, 66. 2014. ISBN 978-86-7994-042-1.
- Giromini C, Ottoboni M, Tretola M, Marchis D, Gottardo D, Caprarulo V, Baldi A, Pinotti L. 2017. Nutritional evaluation of former food products (ex-food) intended for pig nutrition. Food Addit Contam: Part A. 34:1436–1445.
- Giuberti G, Gallo A, Masoero F. 2012. Plasma glucose response and glycemic indices in pigs fed diets differing in in vitro hydrolysis indices. Animal. 6:1068–1076.
- Giuberti G, Gallo A, Cerioli C, Masoero F. 2012. In vitro starch digestion and predicted glycemic index of cereal grains commonly utilized in pig nutrition. Anim Feed Sci Technol. 174:163–173.
- Guo JY, Phillips CE, Coffey MT, Kim SW. 2015. Efficacy of a supplemental candy coproduct as an alternative carbohydrate source to lactose on growth performance of newly weaned pigs in a commercial farm condition. J Anim Sci. 93:5304–5312.
- Kim IB, Allee GL. 2001. Effect of carbohydrate sources in phase I and phase II pig starter diets. Asian-Australas J Anim Sci. 14:1419–1424.
- Knudsen KEB, Laerke HN. 2018. Carbohydrates and lignin in the feed-from sugars to complex composed carbohydrates. In Feed evaluation science. Wagenigen, Netherlands: Wageningen Academic Publishers; p. 113–144.
- Liu Y, Jha R, Stein HH. 2018. Nutritional composition, gross energy concentration, and in vitro digestibility of dry matter in 46 sources of bakery meals. J Anim Sci. 96:4685–4692.
- Mahasukhonthachat K, Sopade PA, Gidley MJ. 2010. Kinetics of starch digestion in sorghum as affected by particle size. J Food Eng. 96:18–28.
- Mavromichalis I, Hancock JD, Hines RH, Senne BW, Cao H. 2001. Lactose, sucrose, and molasses in simple and complex diets for nursery pigs. Anim Feed Sci Technol. 93:127–135.
- Mavromichalis I. 2012. Molasses as a feed ingredient in low-cost piglet diets [cited 2018 Nov 1]. Available from: http://www.wattagnet.com/articles/12260-molasses-as-a-feed-ingredient-in-low-cost-piglet-diets
- McDonald P, Edwards RA, Greenhalgh JFD, Morgan CA, Sinclair LA, Wilkinson RG. 2012. Animal nutrition. 7th ed. Essex (England): Pearson Education Ltd.
- Menoyo D, Serrano MP, Barrios V, Valencia DG, Lázaro R, Argente J, Mateos GG. 2011. Cereal type and heat processing of the cereal affect nutrient digestibility and dynamics of serum insulin and ghrelin in weanling pigs. J Anim Sci. 89:2793–2800.
- Naranjo VD, Bidner TD, Southern LL. 2010a. Comparison of dried whey permeate and a carbohydrate product in diets for nursery pigs. J Anim Sci. 88:1868–1879.
- Naranjo VD, Bidner TD, Southern LL. 2010b. Effect of milk chocolate product on week-1 feed intake and growth performance of weanling pigs. J Anim Sci. 88:2779–2788.
- National Research Council (NRC). 2012. Nutrient requirements of swine. Washington, DC: National Academy Press.
- Pinotti L, Giromini C, Ottoboni M, Tretola M, Marchis D. 2019. Review: insects and former foodstuffs for upgrading food waste biomasses/streams to feed ingredients for farm animals. Animal 1–11.
- Prandini A, Sigolo S, Moschini M, Giuberti G, Morlacchini M. 2016. Effect of the inclusion of dry pasta by-products at different levels in the diet of typical Italian finishing heavy pigs: performance, carcass characteristics, and ham quality. Meat Sci. 114:38–45.
- Schlegel P, Hall R. 2006. Effects of diet type and an artificial high intensity sweetener (SUCRAM®) on weaned piglet performances. J Anim Sci. 84:45–46.
- Slavin JL, Jacobs D, Marquart L. 2000. Grain processing and nutrition. Crit Rev Food Sci Nutr. 40:309–326.
- Solà-Oriol D, van Kempen T, Torrallardona D. 2010. Relationship between glycaemic index and digesta passage of cereal-based diets in pigs. Livestock Sci. 134:41–43.
- Sterk A, Schlegel P, Mul AJ, Ubbink-Blanksma M, Bruininx E. 2008. Effects of sweeteners on individual feed intake characteristics and performance in group-housed weanling pigs. J Anim Sci. 86:2990–2997.
- Stevnebø A, Sahlström S, Svihus B. 2006. Starch structure and degree of starch hydrolysis of small and large starch granules from barley varieties with varying amylose content. Anim Feed Sci Technol. 130:23–38.
- Sun T, Laerke HN, Jørgensen H, Bach Knudsen KE. 2006. The effect of extrusion cooking of different starch sources on the in vitro and in vivo digestibility in growing pigs. Anim Feed Sci Technol. 131:6685.
- Svihus B, Uhlen AK, Harstad OM. 2005. Effect of starch granule structure, associated components and processing on nutritive value of cereal starch: a review. Anim Feed Sci Technol. 122:303–320.
- Tretola M, Ottoboni M, Luciano A, Rossi L, Baldi A, Pinotti L. 2018a. Effects of former food products as cereal substitute on growth performance in post-weaning pig. Book of Abstracts of the 69th Annual Meeting of the European Federation of Animal Science; Aug 27–31; Dubrovnik (HR): Scientific Committee.
- Tretola M, Ottoboni M, Luciano A, Rossi L, Baldi A, Pinotti L. 2018b. Effects of bakery/confectionary former food products as cereal substitute on growth performance and gut microbiota in post-weaning piglets. Proceedings of the 6th International Feed Conference: Present and Future Challenges; Oct 25–26; Bergen (NO): The Research Council of Norway.
- Tretola M, Di Rosa AR, Tirloni E, Ottoboni M, Giromini C, Leone F, Bernardi CEM, Dell’Orto V, Chiofalo V, Pinotti L. 2017. Former food products safety: microbiological quality and computer vision evaluation of packaging remnants contamination. Food Addit Contam: Part A. 34:1427–1435.
- Tretola M, Ottoboni M, Di Rosa AR, Giromini C, Fusi E, Rebucci R, Leone F, Dell’Orto V, Chiofalo V, Pinotti L. 2017. Former food products safety evaluation: computer vision as an innovative approach for the packaging remnants detection. J Food Quality. 2017:1.
- van Kempen T, Regmi PR, Matte JJ, Zijlstra RT. 2010. In vitro starch digestion kinetics, corrected for estimated gastric emptying, predicts the kinetics of portal glucose appearance in swine. J Nutr. 140:1227–1233.
- Weurding RE, Veldman A, Veen WAG, van der Aar PJ, Verstegen MWA. 2001. In vitro starch digestion correlates well with rate and extent of starch digestion in broiler chickens. J Nutr. 131:2336–2342.
- Wiseman J. 2006. Variations in starch digestibility in non-ruminants. Anim Feed Sci Technol. 130:66–77.