
 ?Mathematical formulae have been encoded as MathML and are displayed in this HTML version using MathJax in order to improve their display. Uncheck the box to turn MathJax off. This feature requires Javascript. Click on a formula to zoom.
Abstract
The fatness and conformation scores characterise the payment of cattle carcasses in the EUROP system. The management of these carcass traits is important for stakeholders of the meat chain. The aim of this study was to identify rearing factors, applied during the fattening period, influencing the fatness and conformation scores of the carcasses, in two categories of animals (cull cows and young bulls). A data set of individual cattle data (233 cull cows and 565 young bulls) from different experiments was used. It included eleven rearing factors characterising the fattening period. From carcass data, clusters of fatness and conformation scores were defined. To identify the rearing factors with a leverage on carcass traits according to the category of animal, four robust prediction models were developed using logistic regression to predict these clusters. According to the results of the models established, to achieve the fatness score rehearsed by stakeholders, cull cows should ingest less dry matter (DM) and have a shorter fattening period, whereas young bulls should be more efficient, ingest more DM and be slaughtered heavier. To improve the carcass conformation score, the cull cows should ingest more net energy and begin their fattening heavier. For the young bulls, the three rearing factors identified for the fatness score allowed to improve the conformation score. This study showed also that the jointly management of these both carcass traits is possible, nevertheless it is necessary to adapt the applied fattening practices according to the category of animal.
Used rearing factors to predict the fat score and conformation of bovine carcasses.
Logistic regression is well adapted to predict fat score and conformation of bovine carcasses.
The prediction models of the fat score and conformation are robust.
Highlights
Introduction
According to the country, cattle carcass traits are evaluated by different parameters: e.g. the weight, the conformation, fatness and marbling scores (Polkinghorne and Thompson Citation2010). In Europe, economic value of cattle carcasses is currently determined by their weight, fatness and conformation scores in the EUROP system (European Commission Citation2006) although several additional indicators are proposed to better characterise beef carcasses (Monteils et al. Citation2017). All meat sector stakeholders have an interest in achieving the targeted fatness and conformation scores to reach a maximal valuation of the carcass. In consequence, the management of the carcass traits is a common major goal in the meat chain. The fattening of cull cows and young bulls represented, 50% and 32% respectively of the fattening cattle production in France and 37% and 34% of the fattening cattle production in the European Union, respectively (FranceAgriMer Citation2015). The rearing factors applied during the fattening period could impact carcass traits for both categories (Soulat et al. Citation2016) and allow to adapt their properties to the market expectations.
Many studies reported that fatness and conformation scores of cattle carcasses are impacted by different rearing factors, especially during the fattening period: the slaughter age (Sawyer et al. Citation2004; Marti et al. Citation2013); the fattening period duration (Dumont et al. Citation1997; Franco et al. Citation2009); the fattening diet composition (French et al. Citation2001; Aviles et al. Citation2015) and the type of fattening system, i.e. housing vs. pasture (Keane and Allen Citation1998). The breed (Corazzin et al. Citation2012; Pesonen and Huuskonen Citation2015) and the category of animal (e.g. cull cows and young bulls) (Fiems et al. Citation2003) impact also these two carcass traits. These results show that many rearing factors have individual impacts on the carcass traits, but their effects might also be the results of interactions between them. The effect of some interactions between rearing factors: fattening diet composition × fattening period duration (Sami et al. Citation2004); fattening diet composition × breed (Pesonen et al. Citation2013) and fattening diet composition × slaughter age (Costa et al. Citation2013) on fatness and conformation scores has also been studied.
However, the effects of the rearing practices (i.e. combination of many rearing factors) applied during the fattening period (without single or couple approaches) on the fatness and conformation scores remain difficult to apprehend.
The aim of this study was to identify the rearing factors that could be used to manage fatness and conformation scores of carcasses during the fattening period, in two animal categories (cull cows and young bulls).
Materials and methods
Animal
This study considered the individual data from 798 cattle (233 cull cows and 565 young bulls). The cull cows were represented by four pure breeds (Aubrac, Charolais, Limousin and Salers) and the young bulls by five pure breeds (Aubrac, Blond d’Aquitaine, Charolais, Limousin and Salers). Charolais (37.1%), Limousin (27.2%) and Blond d’Aquitaine (12.2%) breeds are the three first beef breed in France. The Charolais breed is the first European beef breed with 25% of the cows in Europe. The two others are also well represented in Europe and in the world. The two French hardy breeds, Salers (5.3%) and Aubrac (4.9%), are also well represented in Europe and in the world, especially in extensive breeding areas (France Génétique Elevage Citation2019; Interbev Citation2019; Institut de l’élevage and Confédération Nationale de l’Elevage Citation2017).
These data came from several published experiments concerning the fattening period of the cattle (Table ). The Institut National de la Recherche Agronomique (INRA) managed these different experiments in a single experimental farm. In all experiments the fattening was done in stall, i.e. without pasture nor diet modifications according to the season.
Table 1. Description of the data set used: the sources of all of the data with the experiments used (Exp), the number of animals (n), the breed, and the variation factors studied for the cull cows and the young bulls.
Rearing factors characterising the fattening period
The cattle’s fattening period was characterised by 11 rearing factors similar to those used by Soulat et al. (Citation2016). These rearing factors include: slaughter age (months), live weight at the beginning of the fattening period (initial weight, kg), live weight at the end of the fattening period and before the transport to the slaughterhouse (final weight, kg), fattening period duration (days), dry matter intake (DMI, kg DM/day), quantity of forages and concentrates intake (forage intake and concentrate intake, kg DM/day), percentage of concentrates in the diet (%), net energy intake (NEI, Mcal/day), average daily gain (ADG, kg/day) and feed conversion efficiency (FCE, ADG:DMI ratio, kg/kg DM). As in the study of Soulat et al. (Citation2016), different forages (hay, straw, grass silage, corn silage and beet pulp silage) and concentrates (soybean, urea, corn and barley grain) were included in the forage and concentrate variables, respectively.
Slaughtering and carcass traits
All animals were slaughtered at the experimental slaughterhouse of INRA at the Auvergne/Rhône-Alpes research Centre (Theix, France). The animals were slaughtered in the same conditions in compliance with the ethical guidelines for animal care. Cattle were slaughtered by stun using a captive bolt pistol follow by exsanguination. The Achilles method was used to suspend vertically carcasses. The electrical stimulation was not used in this slaughterhouse.
In this study, only the fatness and the conformation scores were considered. These both carcass traits in the EUROP system were graded visually by trained staff (European Commission Citation2006). In the EUROP grid, the carcass fatness score is divided into 5 fatness score classes (1 = lean and 5 = very fat). In this system, the carcass conformation score is divided into five classes defined by a letter: E (very high muscle development), U, R, O, P (very low muscle development). Each conformation class was divided into three subclasses of ‘+’, ‘=’, and ‘-’. Finally, there are 15 conformation subclasses in the EUROP system to characterise this trait (European Commission Citation2006).
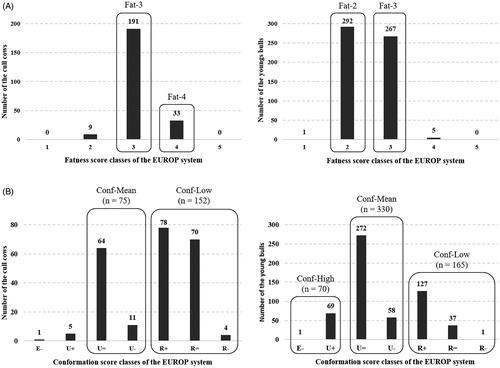
The distribution of the fatness and conformation scores are presented in Figure , according to the category of animals.
Figure 1. (A) Distribution of the carcass fatness score of the EUROP system and the fatness clusters (Fat-2, Fat-3 and Fat-4) used in the prediction models, according to the categories of animal (cull cows and young bulls). (B) Distribution of the carcass conformation score of the EUROP system and the conformation clusters (Conf-High, Conf-Mean and Conf-Low) used in the prediction models, according to the categories of animal (cull cows and young bulls).
Characterisation of fatness and conformation score clusters
In our data set, some EUROP classes of fatness and conformation scores were few or not represented, in both animal categories (Figure ). As the category of animal have an effect on these two carcass traits, the cull cow and young bull data were analysed separately. To establish valid prediction models, it was important to have at least 30 individuals per class for each carcass trait (Saporta Citation2011). Otherwise, the class was not considered. According to the distribution of the carcasses in fatness score of EUROP system, only some fatness score could be considered in our study (Figure ). For cull cows, the fatness clusters considered were numbers 3 and 4 (respectively, Fat-3 and Fat-4). For young bulls, the fatness clusters considered were 2 and 3 (respectively, Fat-2 and Fat-3). On the other hand, for the conformation score, a new classification was determined to increase the number of cattle per class. This new conformation classification was defined by grouping some conformation score subclasses of EUROP system (Figure ). According to the number of individuals, only the clusters Conf-Low and Conf-Mean could be considered in our study for the cull cows. For the young bulls, the three clusters of the new conformation score classification were considered.
Establishment of the calibration and validation sets
All statistical analyses were performed using R 3.2.3 software (R core Team Citation2016). For each category of animal, there was one data set per carcass trait (fatness and conformation scores). In total, four independent data sets were used. Each data set was divided into two sub-data sets (calibration and validation) using a random selection. The calibration and validation data sets were obtained using the ‘sampling’ package in R (Tille and Matei Citation2015). Each calibration and validation data set represented 75% and 25% of the initial data set respectively. During the random selections to establish each couple calibration and validation data sets, we took into account the distributions of the different breeds and experiments in the initial data set. The aim was to conserve the same distribution of the breeds and experiments in the calibration and validation data sets established. The different calibration and validation data sets couples obtained were presented in Table for the fatness score and in Table for the conformation score. Moreover, t-tests for each rearing factor and each category of animal were performed to verify the non-significant differences (p > .05) between each calibration and validation data set couple.
Table 2. Initial rearing factors in the calibration and validation data sets used to establish the carcass fatness score for the cull cows and the young bulls.
Table 3. Initial rearing factors in the calibration and validation data sets used to establish the carcass conformation for the cull cows and the young bulls.
Multicollinearity test between the independent variables
The independent variables used were the rearing factors measured during the fattening period, in the prediction models established in our study. To have a robust model, the first step was to test the multicollinearity between the rearing factors, before the establishment of the prediction models.
For each calibration data set obtained, a linear discriminant analysis (LDA) was realised to select among the 11 rearing factors presented previously, those discriminating the most the fatness and conformation scores clusters, for each category of animal. The rearing factors which had a sufficient discriminant power on the LDA’s axes (coordinates > |0.2|) were retained. After this first selection, the multicollinearity between the rearing factors was evaluated from the variance inflation factors (VIF) values (Tufféry Citation2012). The rearing factors were selected when their VIF value was <10. At the end of the multicollinearity test, the rearing factors selected in each situation were presented in Table . The LDA and the VIF evaluation were realised using the ‘MASS’ (Venables and Ripley Citation2002) and ‘car’ (Fox and Weisberg Citation2011) packages in R, respectively.
Table 4. Rearing factors retained (X) after the multicollinearity test and used to establish each complete prediction model of fatness and conformation (FAT and CONF, respectively) for the cull cows (CC) and the young bulls (YB).
Establishment and interpretation of the prediction models
For each category of animal (cull cows, CC and young bulls, YB), prediction models were developed to predict the fatness and conformation clusters (FAT and CONF) from the rearing factors selected (Table ). Finally, four prediction models were developed: FAT-CC, FAT-YB, CONF-CC and CONF-YB, using the different calibration data sets.
As the fatness and the conformation clusters were qualitative variables, the linear regression could not be used, therefore the logistic regression was used. In logistic regression, the model predicted the probability of the cattle carcass to move from a reference cluster (Clust-Ref) to a superior cluster of the predicted variable (e.g. fatness or conformation). For each prediction model, a Clust-Ref was determined and allowed to explain how to increase carcass fatness and conformation scores.
For the logistic regression, the logit model was used (Rakotomalala, Citation2014) and was written as follows:
in which, α and βi are fixed effects of the model, Xi are the rearing factors i, ε is the model error, p is the probability that Y (the predicted variable) is equal to 1.
According to the number of clusters of the predicted variable, two logistic regressions were used:
The binomial logistic regression is used when the predicted variable has two clusters. In our study, three prediction models were established with this statistical method: FAT-CC, FAT-YB and CONF-CC and their Clust-Ref was: Fat-3, Fat-2 and Conf-Mean, respectively. The binomial logistic regression was realised from the ‘lmerTest’ package in R (Kuznetsova et al. Citation2016).
The multinomial logistic regression is used when the predicted variable has three or more clusters. When the clusters of the predicted variable are ordered, the cumulative multinomial logistic regression is used. In our study, the CONF-YB model was established with this statistical method. In this condition, two comparisons were realised between the conformation clusters by the model: Conf-Low vs. Conf-Mean and Conf-Mean vs. Conf-High. The cumulative logistic regression was realised from the ‘ordinal’ package in R (Christensen Citation2015).
For the four prediction models, the same approach was followed. In each complete prediction model (i.e. initially, all rearing factors selected (Table ) were present in the model), the ‘breed’ and ‘experiment’ factors were placed as random effects on the intercept. Indeed, many studies report a breed effect on the carcass fatness and conformation scores in cattle (Corazzin et al. Citation2012; Pesonen and Huuskonen Citation2015). This argues for the consideration of the breed as a random effect to obtain a prediction model available for the different breeds. Considering ‘experiment’ factor as a random effect allowed to remove the variability from the different experiments used (Table ). Then, to obtain the simplest prediction model, the non-significant rearing factors were individually removed one after the other. After each withdrawal, the new model was compared with the precedent by a probability ratio test. If p > .05 between both models, the rearing factor and the random effects could be permanently removed from the model.
Interpretation of logistic model was realised from the odd ratios (OR) values (Nakache and Confais Citation2003; Rakotomalala Citation2014). The OR evaluate the chance that have carcasses to move to superior fatness or conformation cluster, when a single considered rearing factor in the model increases of one unit, while the other considered rearing factors are fixed at the means values. According to the unit of the variables, for the OR interpretation of the impact of rearing factors in established prediction models, an increase of 1 was not adapted (e.g. an increase by 1 day of the fattening period did not have biological meaning). Therefore, for each rearing factor, a variation range (Δ) was defined to consider a biological explanation for the variation. Calculating the chance to change classes was as follows: ORΔ (Soulat et al. Citation2018b).
Evaluation criteria of prediction model
Each established prediction model was validated with the validation data set. Post hoc analyses of the prediction models were realised to evaluate the prediction quality of each model. These different parameters were calculated from the confusion matrix. For the four models obtained, the considered parameters were as follows: the success rate, the sensitivity and the accuracy. The success rate was defined as the percentage of animals correctly classified. The sensitivity was defined as the ability of the model to find the right values. The sensitivity calculation was the number of carcasses from the cluster i predicted in the same cluster divided by the number of carcasses from the cluster i. The accuracy was defined as the ability of the model to predict the right values. The accuracy calculation was the number of carcasses from cluster i predicted in the cluster i divided by the number of carcasses predicted in the cluster i. For the models realised with the binomial logistic regression, the area under the receiver operating characteristic curve (AUC) was measured with the ‘ROCR’ package (Sing et al. Citation2005) in R. The AUC indicated the discrimination quality of the model being close to 1 (Nakache and Confais Citation2003; Rakotomalala Citation2014).
Results
The low difference between the AUC in the calibration data set (AUCcal) and the AUC in the validation data set (AUCval) highlighted the robustness of the both prediction models of fatness and conformation scores in cull cows (Table ).
Table 5. Goodness of fit measures for the prediction models established with the binomial logistic regression.
Fatness prediction model for the cull cows (FAT-CC model): quality and interpretation
In the prediction model established to discriminate the fatness clusters for cull cows (FAT-CC model), four rearing factors were considered: DMI, NEI, fattening period duration and forage intake. The coefficients of this model were presented in Table . This prediction model had a high prediction quality with a high AUCval, success rate, sensitivity of the Fat-3 cluster and accuracy of both fat score clusters. However, this model had difficulty in correctly classifying the cull cow carcasses from the Fat-4 cluster (sensitivity = 55.5%), whereas all carcasses from the Fat-3 cluster were correctly classified (sensitivity = 100%). Furthermore, some of the cull cow carcasses from the Fat-4 cluster were underestimated. According to the OR values of the rearing factors present in FAT-CC model, only an increase of the DMI and the fattening period (OR > 1) increased the chance that the carcass was fattier (Table ). If the DMI of the cull cows increase of 2 kg DM/d, the carcasses were 20.472 = 419 times more likely to be fattier. During the fattening period, if the duration was increased 10 days, the carcasses were 1.0510 = 1.63 times more likely to be fattier. However, an increase of the NEI and the forage intake did not seem to have any effect on the carcass fatness score (OR < 1). In fact, when the NEI and forage intake increase were 2.5 Mcal/d and 2 kg DM/d, respectively, the chances that the carcasses moved to the superior fatness cluster were weak (0.312.5 = 0.05 for NEI and 0.192 = 0.04 for forage intake).
Table 6. Description of the coefficients and the odd ratios (OR) of the fatness score (FAT) and the conformation (CONF) prediction models from the calibration data sets for the cull cows (CC) and the young bulls (YB).
Fatness prediction model for the young bull (FAT-YB model): quality and interpretation
In the FAT-YB model, the rearing factors considered to discriminate the fatness clusters were: FCE, DMI and final weight (Table ). The success rate of this model was 72.7% (Table ). However, this model better classified the young bull carcasses in the Fat-2 cluster (sensitivity = 83.8%) than those in the Fat-3 cluster (sensitivity = 60.9%). Moreover, this model had a higher accuracy to predict the young bull carcasses in the Fat-3 cluster (accuracy = 77.8%) than those in the Fat-2 cluster (accuracy = 69.7%). The quality of the prediction of the fat score clusters was better for the cull cows than for the young bulls with a better success rate and accuracy. According to the OR values of this model, an increase of the FCE and the DMI (OR > 1) increased the chance that the young bull carcasses were fattier (Table ). The FCE had the highest OR value in this model. If the FCE of the young bulls increase was 0.05 kg/kg DM, the chance of carcasses to be fattier was (3.73 × 10⁴)0.05 = 1.69. The most efficient animals had the highest fat scores. According to this model, when the DMI increase was 2 kg DM/d, the young bulls were 1.212 = 1.46 times more likely to have a fattier carcass. However, if the young bulls were slaughtered heavier, the carcass fatness will be weakly impacted.
Conformation prediction model for the cows (CONF-CC model): quality and interpretation
In the final CONF-CC model, only two rearing factors were considered to discriminate conformation clusters: NEI and initial weight (Table ). The CONF-CC model, with a success rate of 79.7%, classifies relatively well the cull cows’ carcasses in the conformation clusters defined (Table ). Moreover, this model has also high AUCval, sensitivity and accuracy values. The OR values of the both rearing factors present in the CONF-CC model showed that an increase of these rearing factors allowed to improve the conformation of the cull cows’ carcasses (Table ). If the NEI of cull cows increase by 2.5 Mcal/d, their carcasses had 1.212.5 = 1.61 chance to have a higher conformation. Moreover, if the cull cows were heavier at the beginning of the fattening, their carcasses had luckier to have a higher conformation. In fact, with an increase of the initial weight by 50 kg, the cull cows’ carcasses had 1.0250 = 2.69 chance to move to a superior conformation cluster.
Conformation prediction model for the young bulls (CONF-YB model): quality and interpretation
In the CONF-YB model, three rearing factors are present to discriminate the conformation clusters: FCE, DMI and final weight (Table ). As this model was established using the cumulative logistic regression method, two comparisons were realised between the conformation clusters: Conf-Low vs. Conf-Mean and Conf-Mean vs. Conf-High. The success rate obtained from the calibration and the validation data sets were very similar (Table ). This similarity indicates that this prediction model was robust. Moreover, the calculated means of sensitivity and accuracy for the calibration and validation data sets were also similar. Nevertheless, the sensitivity of each conformation cluster, obtained from the validation data set, was very different. The carcasses from the Conf-Mean cluster were the best correctly classified by the CONF-YB model (sensitivity = 83.3%). However, this model has more difficulty to classify correctly the carcasses from Conf-Low and Conf-High clusters, with sensitivity values of 39.5% and 15.8%, respectively. The CONF-YB model overestimates carcasses with a conformation scored R in the EUROP system and underestimates those with the best conformation score (E- and U+). In this model, the accuracy varies weakly between the three conformation clusters (Table ). The CONF-YB model was the most accurate to predict the carcasses from the Conf-Mean cluster. The accuracy for the Conf-Low cluster was close to that of the Conf-Mean cluster. However, this model had more difficulty to predict correctly the best carcass conformation (accuracy of Conf-High = 50%). The conformation model for the cull cows allowed a better discrimination of the conformation clusters than for the young bulls with a success rate in the validation data set of 79.7% in the cull cows and 61.6% in the young bulls. According to the OR values, a variation of each rearing factor considered in the CONF-YB model allowed to improve the carcass conformation score (Table ). If the FCE of the young bulls increased by 0.05 kg kg−1 DM, the carcasses had (3.4 × 10⁶)0.05 = 2.12 chance that their conformations scores were improved. If their DMI increased by 2 kg DM/d or their final weight by 50 kg, their carcasses would be, respectively, 1.212 = 1.5 or 1.0150 = 1.6 times more likely to have a higher conformation score.
Table 7. Goodness of fit measures for the conformation prediction model established with the cumulative logistic regression, for the young bulls.
Discussion
All these data highlighted the impacts of rearing factors on carcass fatness and conformation scores in cull cows and young bulls. This allowed to discriminate the most influencing factors for each trait and both animal categories.
Rearing factors influencing the carcass fatness score during the fattening period
The both prediction models developed in our study allowed to identify the rearing factors the most influential on the carcass fatness score (FAT-CC and FAT-YB). These rearing factors are different according to the category of animal. In cull cows, an increase of the DMI and/or the fattening period duration increases the chance that their carcasses have a higher fatness score. In young bulls, the rearing factors identified to increase the chance that their carcasses have higher fatness score are DMI, FCE and final weight.
In accordance with our results, many studies showed that the carcasses are fattier when the DMI of steers and young bulls are increased (Cerdeño et al. Citation2006; Keane et al. Citation2006; Keady et al. Citation2013). As observed in the FAT-CC model, studies of the literature observed also an increase of carcass fatness score when the fattening period is extended, in the cull cows and the steers (Keane et al. Citation2006; Vestergaard et al. Citation2007). However, Franco et al. (Citation2009) did not display a significant effect on the carcass fatness score when the fattening period of the cull cows was extended by 1 month. Moreover, according to the market price for feed and carcasses it will be more or less interesting to increase fattening period duration or DMI. According to our results in the FAT-YB model, the young bulls are more likely to produce fattier carcass with a higher FCE. This result is in accordance with Barton et al. (Citation2007) and Keogh et al. (Citation2015) who observed a significant increase of the carcass fatness score when the young bulls’ FCE increased. However, if the young bulls had a feed restriction during their fattening period, Keogh et al. (Citation2015) observed an opposite effect for the FCE on the fatness score. In accordance with the weak impact of the final weight observed in our FAT-YB model, Steen and Kilpatrick (Citation1995) showed also a weak increase of the carcass fatness score when the slaughter weight increased by 100 kg, in young bulls. Moreover, Ellies-Oury et al. (Citation2012) in steers did not observed a significant increase of the fatness score when the steers were slaughtered heavier (increasing of average 80 kg).
Our results show that it is necessary to manage the rearing practices applied during the fattening period according to category of animal as except the DMI, the rearing factors impacting the carcass fatness score are different in the cull cows and the young bulls. Our study showed that it could be possible to modify these both carcass traits acting on many rearing factors during the fattening period. Soulat et al. (Citation2016) already observed that for the dressing percentage, the fat tissue and the muscle percentages in the carcass. In the EUROP system, the carcass fatness score generally researched by the beef sector stakeholders is a fatness score of 3 (Fat-3 cluster in our study). To attain this fatness score, the young bulls must be more efficient and ingest more DM. For cull cows, it appears necessary to act the amount of ingested DMI and on the fattening period duration. However, the initial status of the animal must be considered simultaneously that the previous factors. For example in an operational way at the beginning of the fattening, if the cull cows are light with a low body score (<2.5), it would be interesting for farmers to increase the quantity of DMI and/or the fattening duration in order to improve the fatness score. However, if the cull cows have a satisfactory body score (between 2.5 and 3) at the beginning of the fattening period, to limit the risk of producing too fat carcasses (Fat-4 cluster in our study), farmers could do a short or no fattening period to limit the DMI. So, farmers must adapt the fattening period based on the body’s score of the cattle at the beginning of the fattening period.
Rearing factors influencing the carcass conformation score during the fattening period
From the both CONF-CC and CONF-YB models, rearing factors are identified to improve carcass conformation according to the category of animal. As the fatness score, the rearing factors improving the conformation during the fattening period, are different according to the category of animal. There are no rearing factors in common in the cull cows and the young bulls. The rearing factors identified are the NEI and the initial weight, in cull cows and the FCE, the DMI and the final weight, in the young bulls.
According to published data, the effect of the NEI and the initial weight on the carcass conformation did not have been studied, in cull cows. Contrary to our results, Aviles et al. (Citation2015) and Keady et al. (Citation2007) did not observed an improvement of the conformation when the NEI of the young bulls and steers, respectively, was increased.
In our study, the observed effect of the young bulls’ FCE on the carcass conformation disagrees with those of Barton et al. (Citation2007) and Juniper et al. (Citation2007). These both studies did not showed a significant impact of the FCE on the conformation, in the young bulls. These differences could be explained by the fact that, in these both studies, the FCE was not the only rearing factor which varies. Interactions between the FCE and other rearing factors could explain these differences. According to the results of the CONF-YB model, an increase of the DMI’s quantity by the young bulls allows to improve their carcass conformation. In accordance with our results, Pesonen et al. (Citation2013) and Sami et al. (Citation2004) showed an improvement of the conformation score when the young bulls ingested more DM during their fattening. In accordance with the results of Steen and Kilpatrick (Citation1995) and do Prado et al. (Citation2015), the CONF-YB model shows that the young bulls slaughtered heavier are more likely to produce carcasses with higher conformation score.
Our study showed that it is important to consider many rearing factors to predict the carcass conformation. We showed that it was the combination of many rearing factors which impacts the carcass conformation score. That is in accordance with the results of recent studies observing the effect of rearing practices on carcass traits (Soulat et al. Citation2018a; Monteils and Sibra Citation2019). Moreover, the prediction model developed showed that it could be possible to improve the carcass conformation score from different rearing factors during the fattening period. These models could allow predicting a potential of carcass conformation score during the fattening period of the cattle life. From our models, we displayed rearing factors on which farmers could act during the fattening period to improve this carcass trait. However, the levers to improve the conformation score are different according to the category of fattened animals. Consequently, the rearing practices applied during the fattening period must be adapted.
Management of the fatness and conformation scores during the fattening period of cattle
According to our results, the NEI was the only rearing factor in common in the FAT-CC and CONF-CC models for the cull cows. According to our results, if the cull cows fed a diet with higher energy level, their carcasses were more likely to have a higher conformation score, whereas that seem to have a low on the fatness score. In CONF-CC, the NEI variable had the highest OR, whereas it was not the case in the FAT-CC model. In the FAT-CC model, it was the DMI variable which had the highest OR. The main increases of the conformation and fatness scores will not be induced by an increase of the same rearing factor. Therefore, a caution must be taken to limit the increase of the DMI associated with the NEI increase, if not the risk will be to produce fattier carcasses accompanied by a decrease of their price. For the young bulls, the three same rearing factors namely FCE, final weight and DMI were considered in the both models developed in this study. An increase of these rearing factors allowed to improve the fatness and the conformation scores of the carcasses, in particular FCE which had the stronger impact for both traits. However, it is necessary to find the best balance between the percentage of muscle and fat in the carcass to meet market expectations.
Our models showed that it could be possible to manage simultaneously the fatness and conformation scores of the carcass during the fattening period of the cattle. These models allow to identify different action levers on which to act to modify these both carcass traits. Among these action levers (i.e. the rearing factors identify in our models), some have a greater operational feasibility to be modified as animal weights or the fattening duration compared to the DMI or the FCE of the cattle. During the fattening period of the cattle, compromises could be realised between these action levers to optimise the quality of the carcasses limiting the production cost.
Conclusions
The aim of our study was to identify rearing factors influencing the fatness and conformation scores of the carcass, in two categories of animals (cull cows and young bulls). The development of four prediction models allowed identifying rearing factors influencing both carcass traits. According to our results, acting on these rearing factors during the fattening period allowed to manage the fatness and conformation scores. An adaptation of the rearing practices applied during the fattening period is necessary because the identified rearing factors were different according to the category of animal considered. Moreover, our results showed that it is possible to manage simultaneously the fatness and conformation scores of the carcass during the fattening period, to optimise the potential quality of the carcasses. To improve our prediction models, in particular the prediction of some clusters, it will be interesting to increase the number of animals, to consider greater diversity of rearing practices and cattle breeds. Then, it will also be interesting to study broader life period to identify rearing factors of other life periods able to improve the quality of the prediction models of the fatness and conformation scores. The development of a prediction model including simultaneously conformation and fat scores could be very interesting and will be require a data set with a sufficient number of data for each conformation x fatness combination. The rearing factors and the importance of their effects identified from the models could allow an operational use by meat stakeholders to manage the potential quality of the carcasses.
Acknowledgements
The authors thank the researchers who coordinated the experiments used in this study and allowed us to use their data for this study and the INRA experimental Units where conducted (Bourges, Le Pin aux Haras, Herbipôle). They thank also the database managers of the INRA Auvergne-Rhône-Alpes Centre.
Disclosure statement
No potential conflict of interest was reported by the authors.
Additional information
Funding
Related Research Data
References
- Aviles C, Martinez AL, Domenech V, Pena F. 2015. Effect of feeding system and breed on growth performance, and carcass and meat quality traits in two continental beef breeds. Meat Sci. 107:94–103.
- Aviles C, Vinet A, Saintilan R, Picard B, Oury MP, Dumont R, Krauss D, Maupetit D, Renand G. 2014. Genetic correlations between beef traits of adult cows and similar traits of young bulls in Charolais beef cattle. Proceedings of 15th Journées Sciences du Muscle et Technologies Des Viandes. Clermont-Ferrand, France. p. 133–134. [Accessed 2014 November 4 and 5].
- Barton L, Kudrna V, Bures D, Zahradkova R, Teslik V. 2007. Performance and carcass quality of Czech Fleckvieh, Charolais and Charolais x Czech Fleckvieh bulls fed diets based on different types of silages. Czech J Anim Sci. 52:269–276.
- Cerdeño A, Vieira C, Serrano E, Lavín P, Mantecón AR. 2006. Effects of feeding strategy during a short finishing period on performance, carcass and meat quality in previously-grazed young bulls. Meat Sci. 72:719–726.
- Christensen RHB. 2015. Package version 2015.6-28: Ordinal - regression models for ordinal data. [2018-02-09]. http://www.cran.r-project.org/package=ordinal/
- Corazzin M, Bovolenta S, Sepulcri A, Piasentier E. 2012. Effect of whole linseed addition on meat production and quality of Italian Simmental and Holstein young bulls. Meat Sci. 90:99–105.
- Costa ASH, Costa P, Bessa RJB, Lemos JPC, Simoes JA, Santos-Silva J, Fontes C, Prates J. 2013. Carcass fat partitioning and meat quality of Alentejana and Barrosã young bulls fed high or low maize silage diets. Meat Sci. 93:405–412.
- De La Torre A, Gruffat D, Durand D, Micol D, Peyron A, Scislowski V, Bauchart D. 2006. Factors influencing proportion and composition of CLA in beef. Meat Sci. 73:258–268.
- do Prado IN, Eiras CE, Fugita CA, Cortez Passetti RA, Ornaghi MG, Rivaroli DC, Pinto AA, Moletta JL. 2015. Animal performance and carcass characteristics of bulls (1/2 Puruna vs 1/2 Canchim) slaughtered at 16 and 22 months old, and three different weights. Asian-Australas J Anim Sci. 28:612–619.
- Dozias D, Agabriel J, Peccatte JR, Petit M. 2006. Influence of the growth profile of suckling breeds' heifers on their later performances. Proceedings of Journées Nationales Groupements Techniques Vétérinaires. Dijon, France. p. 145–154. [Accessed 2014 May 17 and 19].
- Dransfield E, Martin JF, Bauchart D, Abouelkaram S, Lepetit J, Culioli J, Jurie C, Picard B. 2003. Meat quality and composition of three muscles from French cull cows and young bulls. Anim Sci. 76:387–399.
- Dumont R, Roux M, Touraille C, Agabriel J, Micol D. 1997. The fattening of cull Charolais cows: effect of linseed meal on fattening performance and meat quality. INRA Prod Anim. 10:163–174.
- European Commission. 2006. Concil Regulation (EC) No 1183/2006 of 24 July 2006 concerning the Community scale for the classification of carcasses of adult bovine animals. Off J Eur Union. 214:1–6.
- Ellies-Oury MP, Renand G, Perrier G, Krauss D, Dozias D, Jailler R, Dumont R. 2012. Influence of selection for muscle growth capacity on meat quality traits and properties of the rectus abdominis muscle of Charolais steers. Livest Sci. 150:220–228.
- Fiems LO, De Campeneere S, Van Caelenbergh W, De Boever JL, Vanacker JM. 2003. Carcass and meat quality in double-muscled Belgian Blue bulls and cows. Meat Sci. 63:345–352.
- Fox J, Weisberg S. 2011. An R companion to applied regression. Thousand Oaks (CA): Sage.
- France Génétique Elevage. 2019. French genetics for cattle, sheep and goat industries. Beef breeds. [Accessed 2019 April 29]. http://en.france-genetique-elevage.org/-Beef-breeds-.html
- FranceAgriMer. 2015. Meat, poultry and dairy products. Statistical data 2014 France/European Union/World. FranceAgriMer data and statements. [2017-02-09]. http://www.franceagrimer.fr/content/download/39669/367775/file/STA-VIA-LAIT-Donn%C3%A9es%20statistiques%202014.pdf
- Franco D, Bispo E, González L, Vázquez JA, Moreno T. 2009. Effect of finishing and ageing time on quality attributes of loin from the meat of Holstein-Fresian cull cows. Meat Sci. 83:484–491.
- French P, O'Riordan EG, Monahan FJ, Caffrey PJ, Mooney MT, Troy DJ, Moloney AP. 2001. The eating duality of meat of steers fed grass and/or concentrates. Meat Sci. 57:379–386.
- Institut de l’élevage, Confédération Nationale de l’Elevage. 2017. Les chiffres clés du GEB. Bovins 2017. Productions lait et viande. [2019-04-29]. http://idele.fr/domaines-techniques/economie/economie-des-filieres/publication/idelesolr/recommends/chiffres-cles-bovins-lait-et-viande-2017.html
- Interbev. Les Races à Viande. 2019. [Paris (Fr)]: Interbev; [accessed 2019 April 29]. https://www.la-viande.fr/animal-elevage/boeuf/races-viande
- Juniper DT, Bryant MJ, Beever DE, Fisher AV. 2007. Effect of breed, gender, housing system and dietary crude protein content on performance of finishing beef cattle fed maize-silage-based diets. Animal. 1:771–779.
- Jurie C, Martin JF, Listrat A, Jailler R, Culioli J, Picard B. 2005. Effects of age and breed of beef bulls on growth parameters, carcass and muscle characteristics. Anim Sci. 80:257–263.
- Keady TWJ, Gordon AW, Moss BW. 2013. Effects of replacing grass silage with maize silages differing in inclusion level and maturity on the performance, meat quality and concentrate-sparing effect of beef cattle. Animal. 7:768–777.
- Keady TWJ, Lively FO, Kilpatrick DJ, Moss BW. 2007. Effects of replacing grass silage with either maize or whole-crop wheat silages on the performance and meat quality of beef cattle offered two levels of concentrates. Animal. 1:613–623.
- Keane MG, Allen P. 1998. Effects of production system intensity on performance, carcass composition and meat quality of beef cattle. Livest Prod Sci. 56:203–214.
- Keane MG, Drennan MJ, Moloney AP. 2006. Comparison of supplementary concentrate levels with grass silage, separate or total mixed ration feeding, and duration of finishing in beef steers. Livest Sci. 103:169–180.
- Keogh K, Waters SM, Kelly AK, Kenny DA. 2015. Feed restriction and subsequent realimentation in Holstein Friesian bulls: I. Effect on animal performance; muscle, fat, and linear body measurements; and slaughter characteristics. J Anim Sci. 93:3578–3589.
- Kuznetsova A, Brockhoff PB, Christensen RHB. 2016. lmerTest: tests in linear mixed effects models. R Package. J Stat Software. 82:20–32.
- Leveziel H, Amarger V, Delourme D, Julien R, Renand G, Jailler R, Hocquette JF. 2002. Genes bovins et qualite des viandes-Presentation of the GemQual European program. Viandes Prod Carnés. 22:151–152.
- Marti S, Realini CE, Bach A, Perez-Juan M, Devant M. 2013. Effect of castration and slaughter age on performance, carcass, and meat quality traits of Holstein calves fed a high-concentrate diet. J Anim Sci. 91:1129–1140.
- Micol D, Bauchart D, Jurie C, Jailler R, Picard B, Agabriel J. 2008. Effect of contrasted food intakes on muscle traits of Blond d'Aquitaine young bulls. Proceedings of 12th Journée Des Sciences du Muscle et Technologies de la Viande. Tours, France. p. 181–182. [Accessed 2008 October 8 and 9].
- Micol D, Berge P, Dozias D, Lepetit J, Lienard G, Picard B, Renerre M, Robelin J, Touraille C, Geay Y. 1992. Effect of pregnancy and calving on muscle characteristics in cattle. Proceedings of 38th International Congress of Meat Science and Technology. Clermont-Ferrand, France. p. 93–96. [Accessed 1992 August 23–28].
- Monteils V, Sibra C. 2019. Rearing practices in each life period of beef heifers can be used to influence the carcass characteristics. Ital J Anim Sci. 18:734–745.
- Monteils V, Sibra C, Ellies-Oury MP, Botreau R, de la Torre A, Laurent C. 2017. A set of indicators to better characterize beef carcasses at the slaughterhouse level in addition to the EUROP system. Livest Sci. 202:44–51.
- Nakache JP, Confais J. 2003. Statistique Eplicative Appliquée. Paris (Fr): Technip.
- Pesonen M, Honkavaara M, Kamarainen H, Tolonen T, Jaakkola M, Virtanen V, Huuskonen A. 2013. Effects of concentrate level and rapeseed meal supplementation on performance, carcass characteristics, meat quality and valuable cuts of Hereford and Charolais bulls offered grass silage-barley-based rations. Agric Food Sci. 22:151–167.
- Pesonen M, Huuskonen A. 2015. Production, carcass characteristics and valuable cuts of beef breed bulls and heifers in Finnish beef cattle population. Agric Food Sci. 24:164–172.
- Picard B, Gagaoua M, Micol D, Cassar-Malek I, Hocquette JF, Terlouw C. 2014. Inverse relationships between biomarkers and beef tenderness according to contractile and metabolic properties of the muscle. J Agric Food Chem. 62:9808–9818.
- Picard B, Jurie C, Duris MP, Renand G. 2006. Consequences of selection for higher growth rate on muscle fibre development in cattle. Livest Sci. 102:107–120.
- Polkinghorne RJ, Thompson JM. 2010. Meat standards and grading: a world view. Meat Sci. 86:227–235.
- R core Team. 2016. R. A language and environment for statistical computing. R Foundation for Statistical Computing, [2017-02-09]. http://www.R-project.org/
- Rakotomalala R. 2014. Pratique de la Régression Logistique. Régression Logistique Binaire et Polytomique. [2018-04-07]. http://eric.univ-lyon2.fr/∼ricco/cours/cours/pratique_regression_logistique.pdf
- Sami AS, Augustini C, Schwarz FJ. 2004. Effects of feeding intensity and time on feed on performance, carcass characteristics and meat quality of Simmental bulls. Meat Sci. 67:195–201.
- Saporta G. 2011. Probabilités, analyse des données et statistique. Paris (Fr): Technip.
- Sawyer JE, Mathis CP, Davis B. 2004. Effects of feeding strategy and age on live animal performance, carcass characteristics, and economics of short-term feeding programs for culled beef cows. J Anim Sci. 82:3646–3653.
- Sepchat B, Lherm M, Agabriel J, Micol D, Cirie C, Egal D, Garcia-Launay F. 2011. In production of Salers bulls, complementation of unweaned calves penalizes animal performance and economic results, milk supplementation improves them. Proceedings of the 18th Rencontres Recherches Ruminants. Paris, France. p. 221–224. [Accessed 2011 December 7 and 8].
- Sing T, Sander O, Beerenwinkel N, Lengauer T. 2005. ROCR: visualizing classifier performance in R. Bioinformatics. 21:3940–3941.
- Soulat J, Picard B, Léger S, Ellies-Oury MP, Monteils V. 2018a. Preliminary study to determinate the effect of the rearing managements applied during heifers’ whole life on carcass and flank steak quality. Foods. 7:160.
- Soulat J, Picard B, Léger S, Monteils V. 2016. Prediction of beef carcass and meat traits from rearing factors in young bulls and cull cows. J Anim Sci. 94:1712–1726.
- Soulat J, Picard B, Léger S, Monteils V. 2018b. Prediction of beef carcass and meat quality traits from factors characterising the rearing management system applied during the whole life of heifers. Meat Sci. 140:88–100.
- Steen R, Kilpatrick D. 1995. Effects of plane of nutrition and slaughter weight on the carcass composition of serially slaughtered bulls, steers and heifers of 3 breed crosses. Livest Prod Sci. 43:205–213.
- Tille Y, Matei A. 2015. R package sampling version 2.7.: Survey sampling. [2017-02-09]. https://CRAN.R-project.org/package=sampling
- Tufféry S. 2012. Data mining et statistique décisionnelle. L’intelligence des données. Paris (Fr): Technip.
- Venables WN, Ripley BD. 2002. Modern applied statistics with S. New York (NY): Springer.
- Vestergaard M, Madsen NT, Bligaard HB, Bredahl L, Rasmussen PT, Andersen HR. 2007. Consequences of two or four months of finishing feeding of culled dry dairy cows on carcass characteristics and technological and sensory meat quality. Meat Sci. 76:635–643.
- Vinet A, Krauss D, Andre C, Renand G. 2008. Genetic relationship between feed intake in young bulls, steers, heifers and cows. Proceedings of the 15th Rencontres Recherches Ruminants, Paris, France. p. 267–270. [Accessed 2008 December 3 and 4].