
 ?Mathematical formulae have been encoded as MathML and are displayed in this HTML version using MathJax in order to improve their display. Uncheck the box to turn MathJax off. This feature requires Javascript. Click on a formula to zoom.
Abstract
Most suckling kids are raised on farms oriented toward cheese production, and many goat farmers’ rear kids with milk replacers. The aim of the current study was to investigate the consumer preferences for the visual appearance of meat from suckling kids reared with milk replacers or natural milk. Meat colour was the major criterion used to select meat. The meat of Cabra del Guadarrama reared with milk replacers was preferred by 72% of consumers and had a preferred lightness and hue angle. The rearing system did not influence preference through the time of display. Web-based surveys provided similar information to information recorded with live surveys using actual products instead of pictures. Meat colour appears to be a recurring intrinsic cue to assess consumer preference. In general, consumers preferred meat of light suckling kids reared on milk replacers because this meat had a high lightness and hue angle as well as a low chroma.
Meat colour was the major criterion used to choose meat.
Rearing system did not influence consumer’s preference through time of display.
Consumers preferred meat with high lightness and hue angle, and low chroma.
Highlights
Introduction
Consumer behaviour is complex and is determined by psychological, marketing and sensory factors, and visual appearance is one type of sensory factor (Font-i-Furnols and Guerrero Citation2014). The choice of meat at the point of purchase is determined by visual appearance characteristics, such as colour and marbling, because these intrinsic quality cues are highly related to expectations of meat quality (Banović et al. Citation2012). From these cues, the appearance of freshness and colour has been reported to be the most important (Bernués et al. Citation2012; Gracia and de Magistris Citation2013; Ripoll et al. Citation2018b). Meat colour is defined by the concentration and chemical state of the muscle pigment, which can be measured using the hue angle (hab) and chroma () parameters of CIE L*a*b* (Renerre Citation1982). There are some studies relating CIE L*a*b* colour to consumer preferences, but most are focussed on beef or heavy lambs (Khliji et al. Citation2010; Holman et al. Citation2016). However, consumer colour preferences are different when assessing red meat and light meat and consequently use different colour cues. Thus, consumers of heavy lambs preferred the reddest meat (Khliji et al. Citation2010), while consumers of light lambs preferred pale meat (Bernués et al. Citation2012; Ripoll et al. Citation2018b). In beef, a* provides the best prediction of the consumer acceptance of colour (Holman et al. Citation2016), while
is an important indication of colour (Ripoll et al. Citation2012). Albertí et al. (Citation2002) used an artificial intelligence algorithm to find a function yield a score beef from 1 (light pink meat) to 5 (dark red meat). The function found selected L* and hab as the most explanatory variables. Also, Liu et al. (Citation1996) recommend the use of hab because it is precise and easily understandable. The relationship between consumers visual appraisal and instrumental colour remains unclear. However, in order to gain greater knowledge on the subject, a study should be carried out with a greater variety of types of meat. Hence, L* is the most important CIE L*a*b parameter used for the consumer judgement of light suckling kid meat (Ripoll et al. Citation2018a). This meat is characterised by high L* and hab and low
(Morales-De la Nuez et al. Citation2011; De Palo et al. Citation2015).
Spain is a great producer of kid meat, and 80% of this kid meat originates from the light suckling kid category (MAPAMA Citation2016). Most of the suckling kids are raised on milk farms oriented toward cheese production. When goats are suckling their kids, the milk protein and fat quantity and quality decrease (Caravaca et al. Citation2004). As a result, some goat farmers remove the kids from their dams at a very young age and rear them with milk replacers. However, some farmers still rear kids with their dams because they believe that the meat from suckled kids is more tender than the meat from kids reared on artificial suckling systems (Argüello et al. Citation2005). The proximate composition of milk could modify kid meat colour, and, consequently, this could affect the consumer preference (Ripoll et al. Citation2018a). Some studies have shown that the leg chops of kids reared with milk replacers were preferred by consumers because the meat was paler and dull, with a greater hue angle and a lower redness and chroma (Ripoll et al. Citation2018a).
Most of the studies examining consumer visual appraisal are carried out with real product; nevertheless, this technique is expensive and time-consuming, and, because of this, other techniques have been developed in recent years. Web-based surveys using pictures have been demonstrated as a valid method to relate the instrumental colour of meat to consumer visual appraisal (Holman et al. Citation2016). At the same time, the lack of representativeness of the studied population, which was the principal weakness of web surveys, is quickly disappearing each year as more people around the world gain internet access (Evans and Mathur Citation2005, Citation2018).
Consequently, the aim of the current study was to study consumer preference for the visual appearance of meat from suckling kids reared with milk replacers or natural milk as well as to determine the choice criteria used during the process.
Materials and methods
Carcase sampling
All procedures were conducted according to the guidelines of Directive 2010/63/EU on the protection of animals used for experimental and other scientific purposes (E.U. Citation2010).
Suckling male kids of the Cabra del Guadarrama, Majorera, Palmera, and Tinerfeña breeds reared with milk replacers (MR) or natural milk from their dams (NM) were selected from two farms for each breed. Sixteen kids per breed were fed NM; and 15 kids were fed MR for Guadarrama and Palmera while, and 16 kids were fed MR for Majorera and Tinerfeña. The kids were slaughtered following standard commercial procedures according to the European norms for the protection of animals at the time of killing (E.U. Citation2009). The kids had a live weight of 8.2 ± 0.1 kg and an age of 40–45 days old. A head-only electrical stunning (1.00 A) was applied to the kids, and they were then exsanguinated and dressed. The kids had an average hot carcase weight of 4.5 ± 0.1 kg. The carcases were hung by the Achilles tendon and chilled for 24 h at 4 °C in total darkness. The right hind leg was separated from the carcase, vacuum packed and stored at –20 °C until sampling.
Instrumental colour measurement of the chops
The shelf life of the meat of suckling lambs and kids is approximately one week (Alcalde et al. Citation2017). Because of the very small size of the kid legs, only four of the leg chops were sufficiently large enough to measure the colour of the different muscles. With these boundaries, we used a reversed storage design (Giménez et al. Citation2012). Hence, the 126 frozen legs were sliced into four 2-cm thick chops and assigned to 8, 6, 3, and 1 days before taking a picture (day 0). On the assigned day, the chops were thawed and placed in expanded polystyrene trays covered with retractile oxygen-permeable plastic film (water vapour permeability: 10 g m−2 ⋅ 24−1 h, oxygen transmission rate: 200 cm3 m−2 ⋅ 24−1 h, CO2 transmission rate: 650 cm3 m−2 ⋅ 24−1 h; LINPAC Packaging Limited, Featherstone, UK). Then, the chops were stored for 24 h at 4 °C in total darkness until the day of picture capture.
Muscle colours were measured at 0% UV with an observer angle of 10° and zero and white calibration using a Minolta CM-2006d spectrophotometer (Konica Minolta Holdings, Inc., Osaka, Japan) in CIE L*a*b* 1986 space with the specular component included. The measurement area (diameter of 8 mm) was covered with a CM-A149 dust cover (Konica Minolta Holdings, Inc., Osaka, Japan). The illuminant used was D65. The lightness (L*), redness (a*) and yellowness (b*) indexes were recorded using the software SpectraMagic NX (Minolta Co. Ltd., Osaka, Japan), and the hue angle and chroma
were calculated. The colour of the semimembranosus, semitendinosus and biceps femoris leg muscles were measured because they represent most of the chop area. Colour measurements were repeated three times, and the spectrophotometer was rotated on the horizontal plane before each measurement. The mean of the three readings was used for statistical analysis.
Capture of the images of the chops
Following each measurement, the chops were individually positioned in a Cubelite Lastolite portable studio (Vitec Imaging Distribution UK, Leicestershire, UK) above a black background. The studio was placed beneath two lightbulbs with five Cromalite bulbs (Cromalite S.L, Barcelona, Spain). Each lightbulb contained 28 W, 5.200 K, and 1.600 lm, delivering 1.200 average lx to the sample surface. An Olympus Pen E-PL1 12.3 Mpx camera with a M. Zuiko digital 14–42 mm 1:3.5–5.6 L lens (Olympus Imaging Corp., Shinjuku-ku, Tokyo) was placed overhead the sample with a tripod. The camera's exposure settings were manually adjusted to an ISO of 400, a lens aperture of F5.6 and a shutter speed of 1:125. All images were downloaded in raw format, and no flash, filters or other lenses were applied. Additionally, no other image editing or processing of manipulation was applied other than the cropping of the image.
When the chop colour was measured and all chops were photographed, an assortment of pictures was selected for the surveys. The chops with L*, hab and values representative of their breed and rearing systems were selected for visual appraisal by consumers. L*, hab and
were chosen because these parameters are similar to the colour perception of human beings (Ripoll et al. Citation2012).
Survey design and dissemination
Two surveys were designed for this study. The geographical scope of the surveys was restricted to Spain, ruling out the responses of consumers from other countries. This study was conducted using an online survey service (www.encuestafacil.com), and the survey data were converted to an MS Excel sheet. The questionnaires were tested by researchers who may or may not have been involved in the study and adapted until the final version was approved. Moreover, a compromise had to be reached between thoroughness, simplicity, and shortness.
The questionnaires were distributed using social media websites, university mailing lists and survey mailing lists. A divulgation message was included that asked receivers to further broadcast the web link to other persons in their respective electronic mailing lists. For those receivers willing to participate in the survey, the survey welcome page was immediately accessible after they clicked on the web link. The questionnaire was anonymous to guarantee a higher level of participation and honesty. Personal data, such as identification or electronic mail address, were not required, and there was no financial compensation. Participants were clearly informed of the aim of the study and gave implicit consent for the use of their supplied information in the research according to European regulations (U.E. Citation2010). This study was conducted according to the Declaration of Helsinki for studies on human subjects.
The surveys comprised several sets of pictures of chops from different rearing systems and times of display but of similar breeds, and the respondent had to choose the picture with their preferred chop. The effects of the rearing system and time of display were tested with the first survey (Survey RS + TD). This survey only used pictures of Cabra del Guadarrama, and eight sets of four pictures each were shown to respondents. The time of display was compared in four sets of pictures, and the rearing system within each time of display was compared in the other four sets of pictures. A second survey (Survey RS) was conducted to study the effect of the rearing system involving the four breeds at 1 days of display. Therefore, four sets of two pictures were shown, and consumers were asked to choose between the rearing systems within each breed. The chop shape and size were balanced within and between the picture sets. Questionnaire and pictures are shown in Supplementary Apppendix A. Both surveys had a common sociodemographic section. The information gathered in this section included gender (woman, man), age (<25 years, between 26 and 40 years, between 41 and 55 years, and >55 years), living environment, ‘Have you ever tasted meat from light suckling kids?’ (yes/no), and ‘If the response is yes, do you like it?’ (yes/no). A last question common for both surveys asked about the choice criteria used to select the picture of the preferred chop. The options were (a) meat colour, (b) fat colour, (c) meat brightness, (d) chop size, and (e) chop shape.
Statistical analysis
For both surveys, the χ2 test was used to analyse the frequencies of consumer answers (gender, age, the criteria used to choose the pictures, the frequency of consumers who had previously tasted meat from light suckling kids, and the frequency of people who liked the meat from light suckling kids). Picture selection according the rearing system, time of display and breed were also tested using the χ2 test, as were the criterion used for picture selection according to breed. The level of significance was 0.05. When one of the cells had a frequency of less than five, which makes the use of the χ2 statistic unadvisable, the likelihood ratio statistic was used at the same probability level. To interpret the patterns of association between the studied variables, the corrected standardised residual between the observed and expected cases within each cell greater than |1.96| was considered.
Instrumental colour variables were analysed with an analysis of variance with rearing system, muscle and breed as fixed effects. The Duncan test was used to compare means, and the level of significance was p < .05.
Results
Sample characterisation and the choice criteria used by consumers
The survey RS + TD, which investigated the effects of the rearing system and time of display, was completed by 186 consumers, and the survey RS, which investigated the effects of the rearing system, was completed by 399 consumers. The gender distributions in the RS + TD and RS surveys were similar (χ2 = 0.02; p < .9), with 59% and 60% women, respectively. Similarly, both surveys had the same distribution of ages (χ2 = 3.2; p = .3). There were 14% and 19% of people between 18 and 25 years, 30% and 29% of people between 26 and 40 years, 40% and 34% of people between 41 and 55 years and 17% and 18% of people older than 55 years in the RS + TD and RS surveys, respectively. Population of Spain were 51% woman, and there were 10% of people between 18 and 25 years, 27% of people between 26 and 40 years, 30% of people between 41 and 55 years and 25% of people older than 55 years (INE Citation2016). Therefore, younger people and older people were under- and over represented although both intermediate segments were well represented. Eighty-eight percent of the respondents had tasted meat from light suckling kids, and there was no difference in this number between the surveys (χ2 = 1.26; p = .3). From these respondents, 94% confirmed that they liked this meat, also without differences between the surveys (χ2 = 1.9; p = .2).
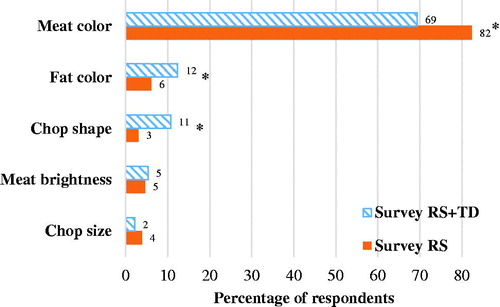
The criteria used by the respondents to choose their preferred chops are shown in . The choice criteria were different for each survey (χ2 = 23.5; p < .001), but meat colour was the major criterion for both surveys. A significantly higher percentage of respondents in survey RS (82%) used meat colour as a criterion than that in survey RS + TD (60%). However, more respondents of survey RS + TD used fat colour (12%) and chop shape (11%) as criterion than did the respondents of survey RS (6% and 3%, respectively). Meat brightness and chop size were less frequently used and did not show differences (p > .05) between the surveys, with 5% and 3% of respondents, respectively. The choice criterion was not conditioned by gender, age or the living environment of the consumer on both surveys (p > .2).
Figure 1. Choice criteria used by the respondents within each survey. Survey RS + TD compared the rearing systems and time of display, and survey RS compared the rearing systems. The distribution of frequencies of each survey was independent (χ2 = 23.5; p<.001). The observed frequencies with asterisks are significantly different (p < .05) between surveys.
Consumer preference and the instrumental colour of the chops displayed for 8 days
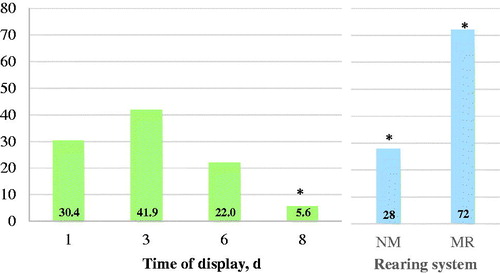
The percentage of the chops preferred by the survey RS + TD respondents according to the rearing system and time of display are shown in . The respondents similarly chose both rearing systems through the time of display (p > .05), but the rearing system and the time of display affected the percentage of preferred chops (p < .0001). The chops at 7 days of display were significantly less preferred (p < .05) than the chops at other display times. The chops displayed for 3 days were the most preferred, although this preference was not statistically relevant (p > .05). The chops from the kids fed MR were preferred in 72% of consumers, while 28% preferred the chops from the kids fed NM (p < .0001). The rearing system preference was not affected (p > .4) by age, gender, or the living environment of consumers at any time of display.
Figure 2. Percentage of the Cabra del Guadarrama chops preferred by consumers according to the time of display (χ2 = 208.4; p < .0001) and rearing system (χ2 = 144.6; p < .0001). NM, natural milk; MR, milk replacer. The observed frequencies with asterisks are significantly different (p<.05) from the expected frequencies.
The instrumental colour of the chops shown to the consumers in survey RS + TD is shown in . There were no significant interactions between the studied effects (p > .05) for any variable. The rearing system affected all variables (p < .05). The meat from the kids fed MR had a greater L*, b* hab and a lower a* and Therefore, the difference in colour between MR and NM was
=4. The time of display also affected all colour variables (p < .05). Lightness increased slightly from 1 to 8 days (p < .05). Conversely, redness decreased steadily over the time of display, with significant differences from 1 to 8 days (p < .05). Yellowness and hue angle showed similar patterns, with a slight decrease from 1 to 6 days (p > .05) and an increase from 6 to 8 days (p < .05). The chroma decreased from 3 to 6 days (p < .05) and increased from 6 to 8 days (p < .05). The three muscles had similar L* and a* (p > .05). The BF and SM muscles had similar b*, hab and
(p > .05), while the ST muscle was different from both the BF and SM muscles (p < .05).
Table 1. Instrumental colour of the leg chops from the Cabra del Guadarrama kids reared with milk replacer (MR) or natural milk from their dams (NM).
Consumer preference and the instrumental colour of the chops from the four breeds
The percentage of the chops preferred by the survey RS respondents according the rearing system and choice criteria are shown in . The total percentage of the selection of NM was higher (52.3%) than that of MR (χ2 = 6.7; p = .009). However, the preference for the rearing system was not the same for each breed (χ2 = 84.1; p < .0001). As a result, consumers preferred the chops from the Cabra del Guadarrama fed NM and the chops from the Palmera and Tinerfeña fed MR (p < .05). There was no preference for the rearing system of Majorera (p > .05). The preference for the rearing system was not affected (p > .5) by age, gender, or the living environment of consumers at any time of display. However, the choice criteria also affected the percentage of preferred chops. Therefore, the consumer preference, using meat colour as a criterion, was different according to the breed (χ2 = 80.4; p < .0001). Consumers also preferred the chops from the Cabra del Guadarrama fed NM and the chops from the Palmera and Tinerfeña fed MR (p < .05), but with different proportions than the total consumer sample. However, when considering fat colour (χ2 = 13.0; p = .005), consumers also preferred the Palmera and Tinerfeña fed MR (p < .05) but preferred the Majorera fed NM (p < .05). Additionally, the consumers did not show a preference for any rearing systems when choosing the chops of Cabra del Guadarrama (p > .05). Finally, when considering meat brightness (χ2 = 4.2; p = .2), chop shape (χ2 = 1.7; p = .6) and chop size (χ2 = 1.1; p = .8), consumers did not prefer one rearing system more than another.
Table 2. Percentages of the preference for the rearing systems in the general sample (χ2 = 84.1; p < .0001) and the consumers that used meat colour (χ2 = 80.4; p < .0001) and fat colour (χ2 = 13.0; p = .005) as decision criteria.
The instrumental colour at 1 day of display of the chops shown to the consumers in survey RS is shown in . There were no significant interactions between the studied effects (p > .05) for any variable. The rearing system affected all variables (p < .05) except b* (p = .4). The meat from the kids fed MR had a greater L*, b*, hab, and a lower a* and Therefore, the difference in the colour between MR and NM was
=2.4. In general, these results are consistent with those of survey RS + TD. The breed affected all variables (p < .05). Cabra del Guadarrama was clearly different compared with the other breeds because they had a lower L, b*, and hab, and a higher a and
(P < 0.05). Majorera, Tinerfeña and Palmera had similar b* and hab (P > 0.05). Majorera and Palmera had different L*, a*, and
(p < .05), while Tinerfeña had intermediate values among the breeds (p > .05). There were differences in L*, b*, and
(p < .05) between the muscles. As in the results noted when chops were shown to consumers in survey RS + TD, the differences between the SM and BF muscles were higher than the differences between the BF and SM. Hence, ST had a higher L*, a*, and
(p < .05) than SM, while BF had intermediate values of
(p > .05) and similar values of L* and b* to SM (p > .05).
Table 3. Instrumental colour of the leg chops from the kids of the four breeds reared with milk replacer (MR) or natural milk from their dams (NM) at 1 days of display.
Discussion
There is a well-founded consensus in the literature that the principal criterion used in meat choice is colour due to its relationship with freshness (Kubberød et al. Citation2002; Bernués et al. Citation2012; Gracia and de Magistris Citation2013; Ripoll et al. Citation2018b). However, visible fat content is also a main cue used to assess meat quality (Kubberød et al. Citation2002; Banović et al. Citation2016). Nevertheless, meat from light suckling kids has no apparent fat. Consequently, in both surveys, colour was the most important cue. Meat from light suckling kids has high L* and low a* and b* values. Therefore, this meat is lighter, paler and duller (Morales-De la Nuez et al. Citation2011; De Palo et al. Citation2015) than the meat of heavy suckling kids (Ozcan et al. Citation2014; Yakan et al. Citation2016) and of concentrate-fed kids (Emami et al. Citation2015). Because of this paleness, it could be expected that ‘meat brightness’ was used as a criterion by more consumers, as L* (lightness) has been reported as the main colour variable used by consumers to assess suckling kid meat (Ripoll et al. Citation2018a). In addition to L*, consumers assessed the appearance of the whole chop rather than the individual muscles and focussed on hab (Ripoll et al. Citation2018a). The relationship between the visual appraisal of meat colour and L* has been reported previously (Eikelenboom et al. Citation1992; Denoyelle and Berny Citation1999; Hulsegge et al. Citation2001). In contrast, b* is not naturally associated with meat colour (Mancini et al. Citation2005; Ripoll et al. Citation2012), and its use by human beings is unclear (O'Sullivan et al. Citation2003). Khliji et al. (Citation2010) only used L* and a* to score lamb meat. Holman et al. (Citation2017) reported a* as the best predictor of consumer acceptance of beef, but hab and increased the prediction precision.
The results of survey RS + TD showed a clear preference of consumers for MR meat, demonstrating that the kid meat with greater L* and hab and low is preferred. However, survey RS was not so clear because the difference in colour (
) between the rearing systems was considerably higher for survey RS + TD (
=4.0) than that for survey RS (
=2.4). This latter colour difference is close to the concept of the ‘just noticeable difference’ between two stimuli reported by some authors (Stokes et al. Citation1992; ISO Citation2004). However, defining a visually detectable threshold is difficult because it depends largely on where the two compared colours are located in the colour space (Lee Citation2005). Abril et al. (Citation2001) reported that
for beef >0.9 were visually detectible. However, theoretically, when
is below 2.2, the stimuli are not discriminable different from each other (Stokes et al. Citation1992). Other authors reported that
below 1 is imperceptible and differences between 1 and 4 may or may not be perceptible (Ebner Citation2007). Also is important the physical and temporal distance between the stimuli (Wyszecki and Stiles Citation1982). In fact, Babiker et al. (Citation1990) reported that goat and lamb meat with
=1.97 was not detected by consumers when not are showed together. Carrasco et al. (Citation2009) reported that trained evaluators were not able to differentiate fat colours with
=5.2 because colour stimuli were not evaluated next to each other. In addition, the rearing systems compared on survey RS had values of L* above 40.77, which has been reported as the first threshold to assess suckling kid meat (Ripoll et al. Citation2018a). Therefore, according to these latter authors, both rearing systems would achieve similar visual appraisal.
Diet strongly affects the meat colour of preruminants, such as suckling lambs and kids (Joy et al. Citation2012; Ozcan et al. Citation2014). Meat lightness is influenced by pH and protein structures (MacDougall Citation1982) more than diet (Renerre Citation1982). Hence, some authors reported that milk replacers do not affect the L* of fresh kid meat, independent of the measured muscle (Bañón et al. Citation2006; Zurita-Herrera et al. Citation2013; De Palo et al. Citation2015). However, in agreement with Ripoll et al. (Citation2018a), frozen/thawed meat could show a different behaviour due to the denaturalisation of sarcoplasmic proteins. In agreement with our results, De Palo et al. (Citation2015) found that the meat of kids fed with natural milk had lower b* and hab than that of those fed with milk replacers. Additionally, the authors also did not find differences in Compared with the use of natural goat milk, the use of milk replacers affects the colour of the semimembranosus muscle by decreasing b* (Zurita-Herrera et al. Citation2013). However, the composition of goat milk is dependent on the feeding/management system of the goats (Raynal-Ljutovac et al. Citation2008), and this influences the colour of meat, especially a*. Some authors explained that the meat from kids reared with natural milk has lower a* and greater hab because natural goat milk of is poor in Fe (Sañudo et al. Citation2012). However, a higher level of Fe was found in the kids fed with milk replacer (Wittek Citation2002). In contrast with the Fe insufficiency, Bañón et al. (Citation2006) and Argüello et al. (Citation2005) reported that the meat from kids reared with MR had greater hab and the same L* as those reared with NM, but the results disagree concerning
Zurita-Herrera et al. (Citation2013) reported the same L*, a*, and b* in both rearing systems.
To our current knowledge, there are no studies in the literature examining the visual appraisal or purchase intentions of kid meat through times of display. However, some authors have reported that consumers significantly reject the meat of light (Panea et al. Citation2005; Joy et al. Citation2012) or heavy lambs after 5 days (Kennedy et al. Citation2004). Meat discolouration is important because discoloured meat cannot be easily sold (Liu et al. Citation1995). Meat discolouration is produced during storage as deoxymyoglobin is converted to metmyoglobin. A stronger relationship between visual assessment and hab, and the a* to b* ratio has been reported, rather than with the standalone trichromatic coordinates (Lee et al. Citation2005; Morrissey et al. 2008; Ripoll et al. Citation2012). Therefore, increases in hab and decreases in
have been used as indicators of red meat discolouration (MacDougall Citation1982; Albertí et al. Citation2005; Lee et al. Citation2005; Ripoll et al. Citation2011, Citation2012; De Palo et al. Citation2015; Holman et al. Citation2017). The browning of beef has been related to the decrease of chroma (Renerre and Mazuel Citation1985). This finding is in agreement with the results of our study, as the discolouration of the kid meat and the rejection from consumers were related to a decrease of
rather than hab due to the paleness of this type of meat. However, Ozcan et al. (Citation2014) studied the meat colour of Gokceada suckling kids and concluded that while a* and b* seemed to not change from 1 to 5 days, L* decreased slightly. Morales-De la Nuez et al. (Citation2011) did not report changes in L* and a* of the meat from Majorera kids stored for 7 days; however, b* and
increased while
decreased. The changes in hab and
observed with storage time can be a result of myoglobin oxidation to metmyoglobin and the loss of heminic pigments due to the freeze/thaw process.
Conclusions
The just noticeable difference in the consumer colour detection was similar when the consumer assessed pictures of meat instead of actual meat samples. Consequently, web-based surveys provided similar information compared with surveys using actual product instead of pictures. Meat colour appears as a recurring cue to assess consumer preference, and this cue is used consistently across the sociodemographic characteristics of the consumer. However, a minority of consumers choose other kinds of meat because they use other cues, such as fat colour and chop shape/size.
In general, consumers preferred the meat of light suckling kids reared on milk replacers because this meat has an increased lightness, hue angle and low chroma. However, when the meat of both rearing systems has lightness levels above 40.77 and small differences in colour, the consumer preference for a rearing system is dependent on the breed. Finally, the relationship between instrumental colour of meat and consumer visual appraisal remains unclear, especially in suckling light goat kids because the literature focussed on this topic is scarce.
Supplemental Material
Download MS Word (7.6 MB)Disclosure statement
The authors declare that they have no conflict of interest.
Additional information
Funding
Related Research Data
References
- Abril M, Campo MM, Onenc A, Sañudo C, Albertí P, Negueruela AI. 2001. Beef colour evolution as a function of ultimate pH. Meat Sci. 58:69–78.
- Albertí P, Ripoll G, Casasús I, Blanco M, Chapullé JLG, Santamaría S. 2005. Effect of the addition of antioxidants to finishing diets of young bulls on meat quality. ITEA-Inform Téc Económ Agraria. 101:91–100.
- Albertí P, Ripoll G, Casasús I, Blanco M, Chapullé JLG, Santamaría S. Spectrophotometric characterisation of colour classification system of beef meat. 48th International Congress of Meat Science and Technology; 25–30 August 2002; Rome, Italy.
- Alcalde MJ, Suárez MD, Rodero E, Álvarez R, Sáez MI, Martínez TF. 2017. Effects of farm management practices and transport duration on stress response and meat quality traits of suckling goat kids. Animal. 11:1626–1635.
- Argüello A, Castro N, Capote J, Solomon M. 2005. Effects of diet and live weight at slaughter on kid meat quality. Meat Sci. 70:173–179.
- Babiker S, El Khider I, Shafie S. 1990. Chemical composition and quality attributes of goat meat and lamb. Meat Sci. 28:273–277.
- Banović M, Chrysochou P, Grunert KG, Rosa PJ, Gamito P. 2016. The effect of fat content on visual attention and choice of red meat and differences across gender. Food Qual Prefer. 52:42–51.
- Banović M, Fontes MA, Barreira MM, Grunert KG. 2012. Impact of product familiarity on beef quality perception. Agribusiness. 28:157–172.
- Bañón S, Vila R, Price A, Ferrandini E, Garrido MD. 2006. Effects of goat milk or milk replacer diet on meat quality and fat composition of suckling goat kids. Meat Sci. 72:216–221.
- Bernués A, Ripoll G, Panea B. 2012. Consumer segmentation based on convenience orientation and attitudes towards quality attributes of lamb meat. Food Qual Prefer. 26:211–220.
- Caravaca FP, Guzmán JL, Delgado-Pertiñez M, Baena JA, López R, Romero L, Alcalde MJ, Gonzalez-Redondo P. 2004. Influencia del tipo de lactancia sobre la composición quimica de la leche de cabra de las razas Payoya y Florida Sevillana. XXIX Jornadas científicas y VIII internacionales de la SEOC; 22–25 de septiembre de 2004; Lérida, España.
- Carrasco S, Panea B, Ripoll G, Sanz A, Joy M. 2009. Influence of feeding systems on cortisol levels, fat colour and instrumental meat quality in light lambs. Meat Sci. 83:50–56.
- De Palo P, Maggiolino A, Centoducati N, Tateo A. 2015. Effects of different milk replacers on carcass traits, meat quality, meat color and fatty acids profile of dairy goat kids. Small Rumin Res. 131:6–11.
- Denoyelle C, Berny F. 1999. Objective measurement of veal color for classification purposes. Meat Sci. 53:203–209.
- E.U. 2009. Council Regulation (EC) No 1099/2009 of 24 September 2009 on the protection of animals at the time of killing. Off J Eur Union. 303; 301–330. L303/301–L303/330.
- E.U. 2010. Directive 2010/63/EU of the European Parliament and of the Council of 22 September 2010 on the protection of animals used for scientific purposes. Off J Eur Union. 276; 233–279. L276/233–L276/279.
- Ebner M. 2007. Color constancy. Vol. 6. Chichester, England: John Wiley & Sons.
- Eikelenboom G, Hoving-Bolink AH, Hulsegge B. 1992. Evaluation of invasive instruments for assessment of veal colour at time of classification. Meat Sci. 31:343–349.
- Emami A, Nasri MH, Ganjkhanlou M, Zali A, Rashidi L. 2015. Effects of dietary pomegranate seed pulp on oxidative stability of kid meat. Meat Sci. 104:14–19.
- Evans JR, Mathur A. 2005. The value of online surveys. Internet Res. 15:195–219.
- Evans JR, Mathur A. 2018. The value of online surveys: a look back and a look ahead. Internet Res. 28:854.
- Font-i-Furnols M, Guerrero L. 2014. Consumer preference, behavior and perception about meat and meat products: an overview. Meat Sci. 98:361–371.
- Giménez A, Ares F, Ares G. 2012. Sensory shelf-life estimation: a review of current methodological approaches. Food Res Int. 49:311–325.
- Gracia A, de Magistris T. 2013. Preferences for lamb meat: a choice experiment for Spanish consumers [Research Support, Non-U.S. Gov't]. Meat Sci. 95:396–402.
- Holman BWB, Mao Y, Coombs CEO, van de Ven RJ, Hopkins DL. 2016. Relationship between colorimetric (instrumental) evaluation and consumer-defined beef colour acceptability. Meat Sci. 121:104–106.
- Holman BWB, van de Ven RJ, Mao Y, Coombs CE, Hopkins DL. 2017. Using instrumental (CIE and reflectance) measures to predict consumers' acceptance of beef colour. Meat Sci. 127:57–62.
- Hulsegge B, Engel B, Buist W, Merkus GSM, Klont RE. 2001. Instrumental colour classification of veal carcasses. Meat Sci. 57:191–195.
- INE. 2016. INEbase. Cifras de población y censos demográficos. Cifras de población. Cifras detalladas desde 2002. Madrid: Instituto Nacional de Estadística; [accessed 2019 May 20]. http://www.ine.es/jaxiT3/Tabla.htm?t=9663&L=0.
- ISO. 2004. ISO 12647. Graphic technology. Process control for the production of half-tone colour separations, proof and production prints. Geneva: International Standard Organization.
- Joy M, Sanz A, Ripoll G, Panea B, Ripoll-Bosch R, Blasco I, Alvarez-Rodriguez J. 2012. Does forage type (grazing vs. hay) fed to ewes before and after lambing affect suckling lambs performance, meat quality and consumer purchase intention? Small Rumin Res. 104:1–9.
- Kennedy C, Buckley DJ, Kerry JP. 2004. Display life of sheep meats retail packaged under atmospheres of various volumes and compositions. Meat Sci. 68:649–658.
- Khliji S, van de Ven R, Lamb TA, Lanza M, Hopkins DL. 2010. Relationship between consumer ranking of lamb colour and objective measures of colour. Meat Sci. 85:224–229.
- Kubberød E, Ueland Ø, Tronstad Å, Risvik E. 2002. Attitudes towards meat and meat-eating among adolescents in Norway: a qualitative study. Appetite. 38:53–62.
- Lee H-C. 2005. Introduction to color imaging science. New York, NY: Cambridge University Press.
- Lee S, Decker E, Faustman C, Mancini R. 2005. The effects of antioxidant combinations on color and lipid oxidation in n-3 oil fortified ground beef patties. Meat Sci. 70:683–689.
- Liu Q, Lanari MC, Schaefer DM. 1995. A review of dietary vitamin E supplementation for improvement of beef quality. J Anim Sci. 73:3131–3140.
- Liu Q, Scheller KK, Arp SC, Schaefer DM, Frigg M. 1996. Color coordinates for assessment of dietary vitamin E effects on beef color stability. J Anim Sci. 74:106–116.
- MacDougall DB. 1982. Changes in the colour and opacity of meat. Food Chem. 9:74–88.
- Mancini RA, Hunt MC, Hachmeister KA, Seyfert MA, Kropf DH, Johnson DE, Cusick S, Morrow C. 2005. The utility of lactate and rosemary in beef enhancement solutions: Effects on longissimus color changes during display. J Muscle Foods. 16:27–36.
- MAPAMA. 2016. Encuesta de sacrificio de ganado del Ministerio de Agricultura y Pesca, Alimentación y Medio Ambiente. [accessed 2016 Nov 18] www.mapama.gob.es/es/estadistica/temas/estadisticas-agrarias/ganaderia/encuestas-sacrificio-ganado/
- Morales-De la Nuez AJ, Falcón A, Castro N, Briggs H, Hernández-Castellano LE, Capote J, Argüello A. 2011. The effects of modified atmosphere packaging on goat kid meat quality. J Appl Anim Res. 39:353–358.
- Morrissey ER, Jacob RH, Pluske JM. 2008. Perception of red brown colour by consumers. In: Webb E, Hoffman L, Strydom P et al., editors. 54th International Congress of Meat Science and Technology.
- O'Sullivan MG, Byrne DV, Martens H, Gidskehaug LH, Andersen HJ, Martens M. 2003. Evaluation of pork colour: prediction of visual sensory quality of meat from instrumental and computer vision methods of colour analysis. Meat Sci. 65:909–918.
- Ozcan M, Yalcintan H, Tölü C, Ekiz B, Yilmaz A, Savaş T. 2014. Carcass and meat quality of Gokceada Goat kids reared under extensive and semi-intensive production systems. Meat Sci. 96:496–502.
- Panea B, Sañudo C, Juarez M, Casado P, Ramas E. 2005. Efecto de la adición de vitamina E en la dieta sobre la valoración visual de carne de corderos de la I.G.P. Ternasco Aragón Eurocarne. 142:103–106.
- Raynal-Ljutovac K, Lagriffoul G, Paccard P, Guillet I, Chilliard Y. 2008. Composition of goat and sheep milk products: an update. Small Rumin Res. 79:57–72.
- Renerre M. 1982. La couleur de la viande et sa mesure. Bull Tech CRZV. 47:47–54.
- Renerre M, Mazuel JP. 1985. Relationships between instrumental and sensory measurement methods of meat color. Sci Des Aliments. 5:541–557.
- Ripoll G, Alcalde MJ, Argüello A, Córdoba MG, Panea B. 2018a. Consumer visual appraisal and shelf life of leg chops from suckling kids raised with natural milk or milk replacer. J Sci Food Agricult. 98:2651–2657.
- Ripoll G, Joy M, Muñoz F. 2011. Use of dietary vitamin E and selenium (Se) to increase the shelf life of modified atmosphere packaged light lamb meat. Meat Sci. 87:88–93.
- Ripoll G, Joy M, Panea B. 2018b. Consumer perception of the quality of lamb and lamb confit. Foods. 7:80–93.
- Ripoll G, Panea B, Albertí P. 2012. Visual appraisal of beef: Relationship with CIELab colour space. ITEA-Inform Téc Económ Agraria. 108:222–232.
- Sañudo C, Campo MM, Muela E, Olleta JL, Delfa R, Jiménez-Badillo R, Alcalde MJ, Horcada A, Oliveira I, Cilla I. 2012. Carcass characteristics and instrumental meat quality of suckling kids and lambs. Span J Agric Res. 10:690.
- Stokes M, Fairchild MD, Berns RS. 1992. Precision requirements for digital color reproduction. ACM Trans Graphics. 11:406–422.
- U.E. 2010. Directiva 95/46/CE del Parlamento Europeo y del Consejo de 24 de octubre de 1995 relativa a la protección de las personas físicas en lo que respecta al tratamiento de datos personales y a la libre circulación de esos datos. Diario Offic de Las Comunidades Eur. 281:31–50.
- Wittek T. 2002. Influence of feeding of whole goat milk or of goat milk replacer on parameters of mineral metabolism in goat kids. Tierarztliche Praxis Ausgabe Grosstiere Nutztiere. 30:84–88.
- Wyszecki G, Stiles WS. 1982. Colour science: concepts and methods, quantitative data and formulae. 2nd ed. New York: John Wiley & Sons.
- Yakan A, Ates CT, Alasahan S, Odabasioglu F, Unal N, Ozturk OH, Gungor OF, Ozbeyaz C. 2016. Damascus kids’ slaughter, carcass and meat quality traits in different production systems using antioxidant supplementation. Small Rumin Res. 136:43–53.
- Zurita-Herrera P, Delgado JV, Argüello A, Camacho ME, Germano R. 2013. Effects of three management systems on meat quality of dairy breed goat kids. J Appl Anim Res. 41:173–182.