
 ?Mathematical formulae have been encoded as MathML and are displayed in this HTML version using MathJax in order to improve their display. Uncheck the box to turn MathJax off. This feature requires Javascript. Click on a formula to zoom.
Abstract
The aim of the study is to present the effects of modern broiler production technology on performance and economic indicators. Production and economic data of two broiler farms (new and refurbished farm) of a Hungarian enterprise, both with different standards of technology, were presented on a case study basis and the differences between them were examined. There was no difference in, for example, day-old chickens, feed, litter, animal health, and expertise only in the technical background of the farms. Mortality was 23% lower, total sold live body weight (BW) per m2 was 10% higher, adjusted feed conversion ratio (FCR) at 2.6 kg BW was 6.5% higher and European Production Efficiency Factor (EPEF) was 11% more favourable on the new farm than on the refurbished farm (p < .05). Moreover, the new farm is characterised by much more balanced production indicators than its counterpart. While the refurbished farm provided an average net income of €5.1 per 100 kg live BW, it was €9.3 on the new farm (p < .05). The unit cost was 6% lower (p < .05) on the new farm compared to the other one. Although the new farm had almost twice the depreciation per unit live BW as the refurbished farm, animal health costs were 34% lower, labour costs were 27% lower and other costs were 38% lower (p < .05). Moreover, feeding cost and that for day-old chickens were also 5–6% more favourable on the new farm (p < .05). The results show the economic benefits of the modern technical background in broiler chicken production by means of a case study.
The effects of modern broiler chicken production technology on performance and economic indicators were evaluated based on two existing Hungarian broiler chicken farms.
A significant difference can be observed between the examined broiler chicken farms in most production and economic indicators.
The use of modern technology is one of the fundamental factors and conditions of productivity and profitability.
HIGHLIGHTS
Introduction
Research on poultry breeding in the last 50 years shows that there has been an extraordinary improvement in efficiency in poultry meat production (Tallentire et al. Citation2016). In addition to the development of genetics and feeding, the improvement of housing technologies was a significant contributing factor (MacDonald Citation2014). Today, broiler production mainly takes place in intensive conditions, in houses with fully enclosed and absolutely controlled environments (e.g. automated feeding and watering, artificial lighting, air-conditioned space), as these systems have the lowest resource requirement and environmental impact (MacDonald Citation2014; Mottet and Tempio Citation2017). The available genetic background is not an obstacle to efficient production. Instead, the question is to what extent the genetic potential of chicken productivity can be utilised and realised by individual farms, which depends on the establishment of the necessary environmental conditions for chicken, providing them with a feed of appropriate composition, effective animal health control and management standards (Liang et al. Citation2013; Szőllősi and Szűcs Citation2014).
Broiler housing is considered as a critical factor to achieve optimum health and welfare, growth and productive performance of chicken. It should not only provide protection against external environmental factors (e.g. cold, heat, rain, wind) and predators but maintain acceptable air quality by controlling the level of ammonia, carbon dioxide, carbon monoxide, dust and humidity, while keeping the birds within their comfort temperature zone (Küçüktopcu and Cemek Citation2019; Oloyo and Ojerinde Citation2019; Saleeva et al. Citation2020). Improvements in modern broiler housing are substantial in maintaining an optimal environment, which results in increased production efficiency (Purswell et al. Citation2011; Liang et al. Citation2013).
The main objective of this study is to present the effects of the modern broiler chicken production technology on performance and economic indicators on a case study basis, through the comparison of two existing broiler farms with different technological standards, both belonging to the same Hungarian company. The following two hypotheses were formulated in connection with this objective: H1: Broiler chicken can be produced with more favourable production efficiency indicators on the farm with a higher technical background. H2: The difference in the technological level can also be shown in economic indicators, as the more modern farm has a higher income.
Material and methods
Sample farms
The primary data required for preparing this study were provided by two farms belonging to a company of great significance in the Hungarian broiler chicken sector. Two farms were selected; one being a new farm equipped with up to date technology as a greenfield investment (hereinafter ‘Farm-1’) and the other being a refurbished farm built almost fifty years ago (hereinafter ‘Farm-2’). There are 10 broiler houses on each farm, with a slight difference in size. Farm-1 and Farm-2 have 14,000 m2 and 11,600 m2 of barn space, respectively. During the examined period, the same hybrid (Ross-308) was used at both sites. The chickens were kept and fed in flocks of mixed sexes, in accordance with the guideline of Aviagen (Citation2014). The production system was on a deep litter with a density of 17–18 chickens/m2 and in accordance with EU animal welfare regulation. There was no difference in the quality and composition of the resources used during production (day-old chickens, feed, litter, animal health), as they were transported to the farms from the same hatchery and feed mixer. The human resources of the company, that is, the specific expertise and knowledge, were also the same. The technical background and technological level was the only difference ().
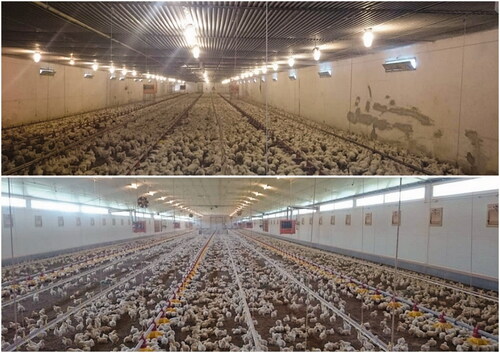
Picture 1. Internal view of the broiler houses of the examined farms (top: Farm-2, bottom: Farm-1). Source: company’s database
Farm-1, established in 2015 as part of a greenfield investment, is a modern establishment even in comparison with Western European farms. The farm has high-level animal health, animal welfare and environmental protection system. The most obvious difference compared to a usual farm layout is that all ten broiler houses on the farm can be accessed via the same corridor, so it is an absolutely closed space, which promotes compliance with hygiene standards and veterinary prevention. Washing hands, using hand sanitisers, and changing slippers are mandatory before entering each house from the corridor. After the fifth house, a partition wall has also been installed for hygienic purposes, where a change of slippers is also mandatory. The farm management system displays up-to-date information specific to the broiler house on a smart panel in front of each house. The houses are equipped with enrichment tools (e.g. metal podiums, wooden perches, straw bags, and hemp cords hanging from feeding lines). All broiler houses have windows. The houses are built of heat-insulated panels and the floors and walls are free of cracks and joints; therefore, they are easy to wash and disinfect. The broiler houses have a coffin structure that facilitates ventilation. Tunnel ventilation is used, which is controlled by nine large fans and four small fans, in addition to the cooling panels, protected by a bird net. Heating is done with four hot air blowers per house. The broiler houses have an automatic feeding and watering system. A 5-phase feeding system is used: one starter feed, two growers and two finisher feed. Water use is provided by a drilled well equipped with a water treatment system to ensure the required water quality. Straw pellets are spread as litter (∼1.5 kg/m2), which is characterized by its fine-grained, dry texture, making it suitable for dust bathing and it has a very good moisture absorbing capacity.
Farm-2 was originally built in 1968, and has since undergone numerous partial renovations. The farm has an older layout, and is divided into two parts; it has two entrances, to which two-wheel disinfectants and two containers for dead broilers are connected. The hygienic rules are the same as those on Farm-1. The structure of the broiler houses differs from that of Farm-1. Instead of a coffin structure, there are flat-roofed buildings and only six houses have windows. The lime-wash walls are more problematic, as well as time- and material-intensive to maintain cleanliness and sterility. The feeding and watering system is identical to that of the other farm, with the difference that the raising and lowering is done manually with a winch, while the other farm is equipped with an automated system. Similarly, ventilation is performed using a tunnel system, and there are also cooling panels installed, but they are not protected by bird nets.
Based on the presented technical background, Farm-2 can clearly be considered to be more outdated. However, it should be noted that this farm is still above average as concerns its technical level, as compared to the typical technical and technological backgrounds of farms in the Hungarian broiler sector, where a significant proportion of farms are 20–50 years old, and either converted and renovated.
Measurement and analysis
Data were collected from house logs and periodical records. Eight production cycles’ data series were available for each farm for the same period (2016–2017). Data collection covered production (number of day-old chickens placed, number of dead chickens, number of chickens removed and sold, live weight of chickens removed and sold, feed consumption, date of chicken placement, date of removal, useful area) and economic data (revenue, production costs, income). Production data were available at the broiler house level, so the number of items processed was 80 per farm. Economic data were available and interpretable at the farm level; therefore, the sample size was 8 for each farm.
The following physical efficiency indicators were derived from the obtained production data: first week mortality (%); total mortality (%); chickens sold per unit broiler house area (chicken/m2, kg/m2); body weight (BW) at thinning (kg/chicken); BW at the end of period (kg/chicken); average BW (kg/chicken); fattening period (days); weighted age (days); feed conversion ratio (FCR) (kg/kg); adjusted FCR at 2.6 kg BW (kg/kg); average daily body weight gain (ADG) (g/day); European Production Efficiency Factor (EPEF).
Mortality refers to all animals that fall out, including culling and dead animals. Culling includes birds that already arrive at the farm from the hatchery in such a condition that they cannot be placed in the broiler house (e.g. poor hatching) or those that are removed from the house during fattening for other reasons. Thinning (partial depletion) is common at the farms; therefore, the indexes BW at thinning, BW at the end of the period, and average BW, as their weighted average, were introduced.
The fattening period is the number of days between establishment, thinning and the end of the period. Weighted age is the mean of the age at thinning and the end of the period, weighted with the sold live BW. ADG was calculated based on average BW and weighted age.
FCR represents the amount of feed used to produce one kg living weight, which is a major factor in reducing production cost (Marcu et al. Citation2013). The calculation of adjusted FCR at 2.6 kg BW (1) is needed to provide a comparison between chickens of different body weights, as well as broiler houses and farms (Liang et al. Citation2013; Aviagen Citation2014).
(1)
(1)
The EPEF (2) is used to express the overall production profile, production efficiency of the given flock in a single index (Perić et al. Citation2009; Aviagen Citation2014).
(2)
(2)
Of the available economic data, production costs were divided into the following main cost groups: day-old chickens, feed, energy, animal health, labour, other and general expenses, and depreciation. The cost of energy includes gas and electricity, animal health costs include medications and veterinary fees, labour costs include the wages and contributions of farmworkers. Other material costs include animal catching, removal of manure, cleaning out, disinfection, disposal of dead animals, repair, maintenance and litter costs. Subsidies were not included among the revenues, thus the calculable net income should be interpreted without subsidies. As the useful floor area of the two farms did not match, farm costs were determined per 100 kilograms to live BW for the sake of comparability and interpretability. Financial data were processed in HUF and converted to EUR (€) using the base year exchange rate of the Hungarian National Bank in 2017 (310 HUF/EUR).
Descriptive statistical methods were used to process the primary data and the derived indexes. F-test was used as a first step to confirm the formulated hypotheses, followed by an independent two-sample t-test for a population with the same variance, and Welch’s t-test for a population with different variances. During the study, the derived house-level indicators of the two farms (n = 80 for each farm) and the farm-level specific values (per 100 kilograms live BW) (n = 8 for each farm) of costs, sales revenue and net income were compared. The two samples are independent of each other and the values of each indicator are normally distributed. A significance level of p < .05 was used in the statistical tests.
Results and discussion
Comparison of production parameters
One-week mortality is a critical indicator of flock quality, which is fundamentally related to chicken quality and is desirable to be below 0.7% according to the Management Handbook of Aviagen (Citation2014). This is the reason why the technological difference between the two farms is not reflected in the value of this indicator (Table ). At the same time, there are also exceptionally high values (above 2%) in both farms, which is clearly due to the lower quality of chickens. However, the effect of technology level can already be detected during the whole rearing period, as while the total average mortality on Farm-1 is 3.52%, it is 1.07% higher on the other farm (p < .05). This observation is related to the prevention and management of animal health problems and the provision of optimal environmental needs for chickens, which Farm-1 can offer more efficiently. Compared to the 2014 Hungarian average (3.9%) reported by Jankovics (Citation2018), Farm-1 is slightly more favourable, while the other farm shows slightly more unfavourable results. At the same time, a significant disadvantage is shown in comparison with the 2012 average of the TOP-25% farms of a German integration (Emsland group) (2.45%) that plays a significant role in Europe, as reported by Aliczki and Bárány (Citation2013).
Table 1. Production indicators of the examined farms.
During broiler fattening, flock density is regulated in kg per m2, which is largely determined by the stocking density. Factors influencing the stocking density include the given season, the type of ventilation, the structure and condition of the building, local laws, animal welfare regulations, and the planned slaughter weight (Aviagen Citation2014). The stocking density on Farm-1 is constant at 18.3 birds/m2, while on the other farm, it averages 17.6 birds/m2 (RSD 7.8%).
The total amount of birds sold per m2 is the function of applied stocking density and mortality. In the case of Farm-1, an average of 17.6 birds per m2 were produced in a relatively stable way, which is 5.1% more favourable compared to the relevant data of Farm-2 (p < .05). The total live weight produced per house area is interesting for the utilisation of capacities and the fluctuation of specific fixed costs within the unit cost. The total live weight sold per m2 includes the total live weight of the animals at the time of thinning and at the end of the fattening period. Results show that nearly 10% more live weight (45.3 kg/m2) was produced per unit of broiler house area on Farm-1 in comparison with Farm-2.
Flock thinning takes place 6 to 10 days before the end of the period, which is determined by the slaughterhouse’s slaughter weight requirements and also by the animal welfare rules for the given stocking density. In the case of the examined enterprise, the average weight at thinning is around 2 kg, and no significant difference (p > .05) was found between the farms. However, data is relatively balanced on Farm-1, while the other farm shows a considerable standard deviation of data (0.22 kg, 10%). The BW at the end of the period is also more balanced on Farm-1, averaging 2.74 kg, which is 6.2% higher (p < .05) than the average for Farm-2. Moreover, the data of the latter farm show a larger relative standard deviation (5.4%). A similar pattern is shown by the average BW data. The indicator shows a relatively stable value on average 2.57 kg on Farm-1, while this value is 2.46 kg on average for Farm-2. The difference (0.11 kg) was significant (p < .05).
According to the international data provided by Van Horne (Citation2018) for 2017, the average body weight of produced broilers ranges between 1.9–2.7 kg in each examined country, influenced by the consumer expectations on the given market and the related needs of the local processing industry. Therefore, the efficiency of production cannot be judged on the basis of average BW alone. The question is how many days it takes for the flock to reach the desired slaughter weight, which is determined by the ADG. The average weighted age was 39.9 days in the examined period for Farm-1, while it was 0.4 days longer for Farm-2 (p < .05). Despite the shorter fattening time, a higher average BW could be reached on Farm-1, explained by the 5.3% more favourable (p < .05) and more even ADG. In addition, since the weight gain of broilers is determined by feeding and the environment in addition to genetics, the effect of different technology levels can be clearly demonstrated in the study.
The ADG calculated from the average Hungarian data of 2014 published by Jankovics (Citation2018) was 59.85 g/day, compared to which the production of the two examined farms is clearly more efficient. Moreover, Farm-1 was able to reach the 2012 average (64.36 g/day) of the TOP-25% of the German integration which was reported by Aliczki and Bárány (Citation2013).
The FCR averages 1.57 kg/kg for Farm-1, with a low standard deviation. In contrast, the FCR for Farm-2 is 0.07 kg higher (p < .05), with great fluctuations. Adjusting the FCR value to the same average BW, an even larger difference (0.11 kg, p < .05) can be observed between the two farms. In comparison, both farms have more favourable FCR compared to the Hungarian average (Jankovics Citation2018), and Farm-1 was also able to reach the 2012 average of the TOP-25% farms of the above-mentioned German integration (Aliczki and Bárány Citation2013) in terms of this indicator.
The value of EPEF was also more balanced on Farm-1, ranging from 370 to 423, averaging 395, which is only slightly below the 2012 average of the TOP-25% farms in the German integration (Aliczki and Bárány Citation2013). In contrast, EPEF for Farm-2 was significantly lower (p < .05) and showed much greater fluctuation during the examined period. However, this unfavourable performance still exceeded the Hungarian average, which was 320 in 2014 (Jankovics Citation2018).
Comparison of economic figures
In the examined period, the net income per 100 kg live BW averaged €9.3 on Farm-1, which is almost twice (p < .05) the income achieved on Farm-2 (Table ). Moreover, we can find extremely fluctuating values on Farm-2. Results show that the difference in net income between the two farms can be attributed to the difference in cost (6.4%, p < .05), as the sales price is essentially the same. In comparison, both farms had higher incomes in the examined period than the Hungarian average in 2016, according to Hungarian FADN data (Szili and Szlovák Citation2018) (production cost: €79.04/100 kg; net income without subsidies: €0.84/100 kg). The average unit cost in the EU in 2017 was €82.50/100 kg (Van Horne Citation2018).
Table 2. Economic indicators of the examined farms.
Feeding costs represent 59–60% of total production costs, while the cost of day-old chickens has a 15% share. The share of additional cost items, such as energy, animal health, labour and other costs was lower on Farm-1, while the share of overhead costs and depreciation was lower at the other site. This difference is explained by the fact that Farm-1 uses electricity and gas more efficiently, the hygienic conditions are better thanks to the corridor system, and the highly modernised technology requires less human resources and the cost of repairs and maintenance is a fraction compared to the other plant.
The difference (p < .05) between the cost of day-old chickens per unit live weight of the two farms is explained by the differences in mortality and average BW. The difference (p < .05) in specific feeding costs is caused by different FCR. Animal health costs are 34.2% lower (p < .05) on Farm-1, mainly due to more favourable hygienic conditions. Labour costs also differ significantly (26.7%, p < .05) between the two farms, which is clearly due to the more efficient use of labour on Farm-1. The amount of depreciation per unit live BW of Farm-1 is almost double (p < .05) compared to that of its counterpart, due to the different ages of the farms. However, specific other costs are significantly higher for Farm-2, due to higher repair and maintenance costs (p < .05).
Conclusions
A significant difference (p < .05) can be detected between the two farms in most of the production indicators. Moreover, the farm with higher-level technology has much more balanced production indicators than the other one. Consequently, hypothesis H1 is accepted, according to which ‘Broiler chicken can be produced with more favourable production efficiency indicators at the farm with higher technical background’. It can also be stated that the results of the farm with a higher technology level reach the best performances of Western European farms. Despite the fact that the results of the refurbished farm (Farm-2) lag far behind those for the new farm (Farm-1), they are still both slightly above the Hungarian sector average. As regards economic indicators, data per unit live BW were compared to each other due to different farm sizes. Based on the results, the hypothesis H2 is also accepted, according to which ‘The difference in the technological level can also be shown in economic indicators, as the more modern farm has a higher income’.
The numerical generalisability of the obtained results is limited due to the case study nature of the study. At the same time, the significance of the study is compounded by the fact that it is rare in the international literature to present such detailed operational data of broiler chicken production. Our findings are in harmony with the results demonstrated by Liang et al. (Citation2013), MacDonald (Citation2014), Gillespie et al. (Citation2017), and Utnik-Banaś et al. (Citation2018), according to which poultry production technology and farm modernisation have positive impacts on productivity and efficiency. In addition, the results generally support the correlation concluded by several researchers (Mollo et al. Citation2009; Nábrádi et al. Citation2009; Szőllősi and Szűcs Citation2014; Fountas et al. Citation2020; Verdes et al. Citation2020), that is, improving the physical efficiency of broiler chicken production is key to increasing the profitability and international competitiveness of agricultural activity and reducing negative environmental impacts. A significant improvement can be achieved in this field by the complex application of state-of-the-art technologies, automation, robotics and digitisation, as well as the necessary expertise.
Ethical approval
This article does not contain any studies with animal subjects.
Disclosure statement
The authors declare that there is no conflict of interest associated with the paper. The authors alone are responsible for the content and writing of this article.
References
- Aliczki K, Bárány L. 2013. Versenyképes-e a magyar húscsirke termelés? [Is Hungarian broiler production competitive?]. Baromfiágazat. 13(3):4–6. Hungarian.
- Aviagen. 2014. Ross broiler management handbook. Huntsville (AL): Aviagen Group.
- Fountas S, Espejo-García B, Kasimati A, Mylonas N, Darra N. 2020. The future of digital agriculture: technologies and opportunities. IT Prof. 22(1):24–28.
- Gillespie J, Nehring R, Hallahan C. 2017. New versus old broiler housing technology: which leads to greater profit? J Appl Poult Res. 26(1):72–83.
- Jankovics P. 2018. A magyar vágócsirke hizlalás költségét és jövedelmét befolyásoló tényezők alakulása 1986-2014 között [Development of factors affecting the cost and income of Hungarian broiler fattening between 1986 and 2014]. Studia Mundi – Economica. 5(2):14–26. Hungarian.
- Küçüktopcu E, Cemek B. 2019. Modelling indoor environmental conditions in a commercial broiler house. Tar Bil Der. 25(4):440–448.
- Liang Y, Kidd MT, Watkins SE, Tabler GT. 2013. Effect of commercial broiler house retrofit: a 4-year study of live performance. J Appl Poult Res. 22(2):211–216.
- MacDonald JM. 2014. Technology, organization, and financial performance in U.S. broiler production. Washington (DC): U.S. Department of Agriculture, Economic Research Service; p. 53.
- Marcu A, Vacaru-Opriş I, Dumitrescu G, Ciochină LP, Marcu A, Nicula M, Peţ I, Dronca D, Kelciov B, Mariş C. 2013. The influence of genetics on economic efficiency of broiler chickens growth. Lucr Stiint Zooteh Bioteh. 46(2):339–346.
- Mollo MN, Vendrametto O, Okano MT. 2009. Precision livestock tools to improve products and processes in broiler production: a review. Rev Bras Cienc Avic. 11(4):211–218.
- Mottet A, Tempio G. 2017. Global poultry production: current state and future outlook and challenges. Worlds Poult Sci J. 73(2):241–256.
- Nábrádi A, Pető K, Balogh V, Szabó E, Bartha A, Kovács K. 2009. Efficiency indicators in different dimension. APSTRACT. 3(1-2):7–22.
- Oloyo A, Ojerinde A. 2019. Poultry housing and management. In: Kamboh AA, editor. Poultry – an advanced learning. London (UK): IntechOpen; p. 18.
- Perić L, Milošević N, Žikić D, Kanački Z, Džinić N, Nollet L, Spring P. 2009. Effect of selenium sources on performance and meat characteristics of broiler chickens. J Appl Poult Res. 18(3):403–409.
- Purswell JL, Davis JD, Luck BD, Kim EJ, Olanrewaju HA, Kiess AS, Branton SL. 2011. Effects of elevated carbon dioxide concentrations on broiler chicken performance from 28 to 49 days. Int J Poultry Sci. 10(8):597–602.
- Saleeva I, Sklyar A, Marinchenko T, Postnova M, Ivanov A. 2020. Efficiency of poultry house heating and ventilation upgrading. IOP Conf Ser: Earth Environ Sci. 433:012041.
- Szili V, Szlovák S. 2018. A főbb mezőgazdasági ágazatok költség- és jövedelemhelyzete 2016 [Results of Hungarian FADN Farms 2016]. Budapest (Hungary): Research Institute of Agricultural Economics; p. 121. Hungarian.
- Szőllősi L, Szűcs I. 2014. An economic approach to broiler production. A case study from Hungary. Ann Polish Ass Agricult Agribus Econ. 16(3):275–281.
- Tallentire CW, Leinonen I, Kyriazakis I. 2016. Breeding for efficiency in the broiler chicken: A review. Agron Sustain Dev. 36(4):66.
- Utnik-Banaś K, Żmija J, Krawczyk J, Połtowicz K. 2018. Changes in technical efficiency of the broiler production in Poland, 1994-2013. Br Poult Sci. 59(2):245–249.
- Van Horne PLM. 2018. Competitiveness of the EU poultry meat sector, base year 2017: international comparison of production costs. Report 2018-116. Wageningen (The Netherlands): Wageningen Economic Research; p. 20–25.
- Verdes S, Trillo Y, Peña AI, Herradón PG, Becerra JJ, Quintela LA. 2020. Relationship between quality of facilities, animal-based welfare indicators and measures of reproductive and productive performances on dairy farms in the northwest of Spain. Ital J Anim Sci. 19(1):319–329.