
Abstract
The aim of this study was the determination of changes in the fatty acid profile, oxidation parameters [peroxide value (PV), and malondialdehyde (MDA)] of wet and dry types of premium (PC) and economic class (EC) commercial dog foods at different stocking temperatures (+4 °C, +21 °C, +40 °C) and different stocking times (1, 3, 6, and 12 months). At the time of purchase, the PV and MDA concentrations of dry type foods were lower than those of wet type foods (p < .001). At the time of purchase, MDA concentrations in wet types of EC dog foods were higher than those of wet types of PC dog foods (p < .05). The contents of docosahexaenoic (DHA) and oleic acids in PC dog foods, at the time of purchase, were higher than those of EC dog foods (p < .05). The MDA and PV concentrations of dog food increased with the progress of stocking times at increasing temperatures (p < .05). In the 12th month of stocking, eicosapentaenoic acid (EPA)+DHA contents decreased by up to 13% in PC dog foods and 50% in EC dog foods. The EPA + DHA contents reduced up to 33% in dry types and 36% in wet types of dog foods. As a result, all the classes and types of dog foods, which were stocked at +4 °C, +21 °C, or +40 °C for up to 3 months, had no significant changes in PV, but it may be recommended to stock for up to 12 months at +4 °C to preserve the existing oxidation capacity and essential fatty acid profile.
The PV and MDA concentrations of dry type dog foods at the time of purchase were lower than those of wet type dog foods.
The contents of α-linolenic and linoleic acid in dry types of EC foods up to 12 months stocking were below the minimum limits in dog food as recommended by international authorities.
Stocking dog food at +40 °C for up to 3 months, did not have a significant effect on lipid peroxidation, but it may be recommended to stock for up to 12 months at +4 °C.
Highlights
Introduction
Dog owners choose the most ideal food to meet the optimum nutrient-energy requirements of their pets as well as to keep them healthy for a long time. Some terms used on the labels of commercial dog and cat foods may affect the choice of the pet food by the pet owner. Commercial dog foods have classifications as premium (PC), economic (EC), generic, and basic-nutrition (Heinze Citation2016). Pet owners prefer premium pet foods, even if the price is higher. According to the NRC (Citation2006) in "basic-nutrition brands" and "economic" foods, it is stated that dogs largely meet their energy, protein, and other essential nutrient needs. However, the term premium pet food has emerged with the presence of protein and animal fat, fish oil, and other essential nutrients in foods that are far above the minimum requirement. PC foods are generally offered for sale with above average quality and high prices (Kara Citation2020a). The fat levels in dog foods range from 5 to 40% (Glodde et al. Citation2018). Dogs fed with a food with ideal protein levels can tolerate high levels of fat (FEDIAF et al. Citation2020). The fat/oils in dog foods comprise from animal, vegetable, or both (Kara Citation2020a). Fatty acids, such as linoleic acid (C18:2, w-6), arachidonic acid, α-linolenic acid, EPA, and DHA in dogs and cats are used as precursors of leukotrienes, prostaglandins, and thromboxane. They have activities in blood coagulation, protection of biological membranes, nervous system, and vision. Although the mechanism cannot be fully explained, polyunsaturated fatty acids (PUFA’s) also have cellular protective properties against injuries and epithelial degeneration (Walters et al. Citation2010). In dogs, arachidonic acid is produced in organisms by elongation and desaturation of linoleic acid (Buff et al., Citation2014). It was reported that the minimum w-6 linoleic acid levels are 1.3 g in 100 g of food (dry matter: DM) during the growth period. These minimum fatty acids levels in dog foods are at least 0.08 g for w-3 α-linolenic acid (C18:3) and at least 0.05 g for EPA (C20:5, w-3) + DHA (C22:6, w-3) for 100 g of DM (NRC, Citation2006; FEDIAF, Citation2020). Fatty acids in dog foods and essential fatty acids are balanced with fish or vegetable oils. In one study, it was found that the addition of conjugated linoleic acid and DHA + EPA over the need for dog foods increased oxidation in dogs (Walters et al. Citation2010). In another study, it was reported that dog foods containing oxidised lipids inhibited growing, deteriorated antioxidant status, and weaken some immune functions of dogs in the growing period (Turek et al. Citation2003).
The ability of a commercial pet food to maintain optimum nutritional quality and taste depends on storage conditions. Although there is a difference between dog foods for shelf life, the shelf life of unopened dry-type extruded foods varies between 4 months and 3 years according to the label information. However, it is generally stated by companies that the shelf life (according to the label information) of mostly dry extruded dog foods are approximately 12 months. Chanadang et al. (Citation2016) stated that dog foods have a shelf life of 12 months or longer under appropriate stocking conditions. It is reported that there is no problem in consuming wet foods for dogs within 24 months after the production date (Case et al. Citation2011; Hillestad Citation2018). Natural or synthetic antioxidant additives are used to prevent lipid peroxidation, which is an indicator of shelf life (Case et al. Citation2011; Glodde et al. Citation2018). Lipid oxidation is one of the most important reasons for the spoilage of feedstuffs containing high polyunsaturated fatty acids and their changing shelf life. Unsaturated fatty acids are oxidised to odourless and tasteless hydro-peroxides. Oxidation products change the flavour of the food, and the structure of the fatty acids (Stadtman and Levine Citation2003). It is important to determine the shelf life of both dry-type (extruded-pellet) and wet-type dog foods, produced by today's food industry, scientifically and objectively. According to the hypothesis of the study, the current fatty acid and oxidation capacity [peroxide values (PV) and malondialdehyde (MDA) concentrations] of the dog foods supplied from the first supplier can show whether the oxidised ones of the raw materials used in the food are used and whether the antioxidant additives added to the food is sufficient/effective. The aim of this study was to determine the changes in the fatty acid profiles and the products of first oxidation (PV) and second oxidation (MDA) of wet (canned) and dry (pellet) types of premium and economic class commercial dog foods. Different stocking temperatures (+4 °C, +21 °C, +40 °C) and different storage times (1, 3, 6, and 12 months) were examined.
Materials and methods
The samples of dog food
In the study, the commercial dog foods were different brands offered for adult (20–40 kg weight) large breeds in Turkey. The dog foods consisted of 40 premium classes (PC) (20 wet types, and 20 dry types) and 40 economic classes (EC) (20 wet types and 20 dry types) from different brands. Totally, 80 different dog food brands were analysed. The PC and EC dog foods had similar raw materials and animal protein-carbohydrate sources (each class of food consists of dog foods with 5 lamb - rice, 5 fish – rice/grain, 5 grain-free, and 5 chicken-grain/potato).
The total number of analyses performed for each EC and PC during the study were 2400 [=80 (40 of PC and 40 of EC dog foods) x2 (duplicate) x5 (fresh and four different stocking times) x 3 (three different stocking temperatures)].
Stocking conditions
The peroxide value (PV) and malondialdehyde (MDA) concentrations of the dog foods [n = 80; 40 for PC (consisted of 20 wet type and 20 dry type dog foods) and 40 for EC (consisted of 20 wet type and 20 dry type dog foods)] at the time of purchase were determined. The fatty acid compositions and oxidation status (PV and MDA) in dog foods, which were stored at +4 °C, +21 °C, or +40 °C for 1, 3, 6, or 12 months, were analysed in duplicate. The dog food was stored at +4 °C in a refrigerator and the temperature was controlled by a data-logger. Stocking of dog food at +21 °C and +40 °C was carried out in two different thermostatic control cabinets and temperature values were recorded with two data-logger.
Preparation of dog food for analyses after different stocking conditions
Dry foods in pellet form were milled after each different stocking condition. Wet foods were dried and ground. This process was repeated for stocking at different durations. Dry type foods (PC and EC) were milled to a size that could pass 1.0 mm diameter (IKA Mills, MF 10 basic Microfine grinder drive, Germany). Wet type foods (PC and EC) were dried at 55 °C for 24 hours and 12 hours at 105 °C, then ground to a size that could pass 1.0 mm diameter (IKA, Germany). The MDA, PV, and fatty acid analyses were performed on these prepared samples. The fat/oils in the dried-milled dog food were extracted using diethyl ether on the extraction unit (SER148/3 Solvent Extractors, Velp Scientifica, Italy) (AOAC, 1995).
The determination of PV in dog foods
The PV of dog food was determined according to AOAC (Citation1990). The samples were dissolved by adding 30 mL acetic acid - chloroform solution (3:2) under the fume hood on the weighed sample in a sufficient amount, according to the expected PV. 0.5 mL saturated (10%; in distilled water) KI solution was added to the solution, 50 mL in a falcon tube was capped and the solution was vortexed for 1 minute. After 10 minutes of incubation in the dark, 30 mL of distilled water and 1 mL of 1% starch solution were added. Titration was performed with a sodium thiosulphate solution (0.1 N–0.01 N), and the PV was calculated (AOAC Citation1990).
The determination of MDA concentrations in dog foods
Thiobarbituric acid-reactive substances (TBARS) were determined using the spectrophotometric method reported by Botsoglou et al. (Citation1994). The malondialdehyde (MDA)/1,1,3,3-tetraethoxypropane (TEP) standard (0.024–239 µg/mL MDA/TEP) curve (f (x) = 0.00972x + 0.1674, R2 = 0.9929) was generated. Results were given in mg MDA/kg food. Analysis was carried out in six replicates.
The determination of fatty acid compositions in dog foods
The fat/oils in dog food samples were methylated with the modified (Kara Citation2020b) three-step procedure by Wang et al. (Citation2015). The supernatants (methylated fatty acids in n-hexane) were put in a 1.5 ml screw neck ND-9 amber vial with 9 mm screw caps (silicone white/PTFE caps) and analysed in a gas chromatograph (TRACE 1300, Thermo Scientific, USA) with automatic sampling (Thermo AI 1310, Thermo Scientific, USA). FAME mix (37 C) standard solution in dichloromethane (Chem-Lab, CL.40.13093.0001, Zedelgem, Belgium) was used for the identification of peaks. Heptadecanoic acid (C17:0) was used as an internal standard. A fatty acid methyl esters column (Length 60 m, I.D: 0.25 mm, film: 0.25 µm and maximum temperature 250–260 °C) with an injection split temperature of 255 °C, a column of 140 °C and a flow rate of 30 ml/min was used for the processing method for 42 minutes. Fatty acid identification was performed by comparing the peaks in the chromatogram with the retention times by the standard.
Statistical analysis
The experimental data were first subjected to Levene’s test to detect the variance homogeneity. The multivariate analyses were implemented for homogeneous variances by General Linear Model procedures to test treatment differences. Data were analysed using a randomised complete design with dog food classes x dog food types x stocking temperatures. Data were analysed based on the statistical model: Yijk=µ + Ei + Dj + EDij + eijk. Where, Yijk=the dependent variable; µ = overall mean; E = effect of i -temperature on the observed parameters; D = effect of j – food types on the observed parameters; ED interaction between the i –food types and j -temperatures; eijk=the standard error term. The relationship between the investigated variables for wet and dry foods was determined by Pearson’s Correlation (r) using the SPSS v17.0 package program. The statistical significance was taken below 0.05 (p < .05).
Results
The PV and MDA concentrations of dog foods at the beginning of the study
At the beginning of the study, the effect of food type on PV and MDA concentrations of dog foods was significant (p < .001). The PV (7.22 mEq O2/kg fat) and MDA concentrations of dry-type foods were lower than the PV and MDA concentrations of wet-type foods (p < .001). At the beginning the study, the PV of PC dog foods was similar with EC dog foods (p > .05). In addition, the MDA concentrations of the PC dog foods were lower than those of the EC dog foods (p = .015). The MDA concentrations of the wet type of EC dog foods were higher than those of the wet type of PC dog foods (p = .005) (Table ).
Table 1. The fatty acids (g/100g DM), PV (mEq O2/kg fat) and MDA (mg/kg food) concentrations of dog foods when bought from the market.
Fatty acid composition of dog food at the beginning of the study
At the beginning of the study, DHA and oleic acid levels (g/100g) in DM in PC dog foods were higher than those of EC dog foods (p < .05). The average concentrations of ALA and EPA fatty acids of the dog foods were similar for two different dog food classes (p > .05). The level of linoleic acid in DM of EC dog foods was higher than that of PC dog foods (p < .05). Although the concentrations of EPA, linoleic acid, and oleic acid in DM of the wet type dog foods were higher than those of the dry type dog foods (p < .05), ALA and DHA concentrations were similar for the different dog food types (p > .05). The w-3 ALA levels of premium class dry type dog foods were higher than those of the premium class wet type foods (p < .05). The DHA levels in the wet type of EC dog foods were higher than those of the dry type of EC dog foods (p < .05). The wet types of EC and PC dog foods contained more EPA, linoleic acid, and oleic acid than the dry types of EC and PC dog foods (p < .05) (Table ).
The MDA and PV of dog food stocked at different temperatures and times
The MDA concentrations of dog food stocked at different temperatures increased significantly with increased stocking times (p < .05) (Figure ). By stocking dog food for 1 month, the concentrations of MDA in the EC dog food were higher than those of the PC dog food (p < .05). Therefore, MDA concentrations of the dog foods at 3, 6, and 12 months stocking times were similar for PC and EC dog foods (p > .05). The dog food type was effective in changing the MDA concentration of the dog food according to the stocking conditions. There was no difference between MDA concentrations of dry and wet type dog foods, stocked for one month. However, the MDA concentrations of the wet type dog foods with stocking up to the 3rd, 6th, and 12th months were higher than those of the dry type dog foods (p < .001). The interaction between the dog food type and stocking temperature had a significant effect on the MDA concentration. The MDA concentrations of wet - type dog foods at 1, 3, 6, and 12 months of stocking times were higher than those of the dry type dog foods (p < .05) (Table and Figures and ).
Figure 1. The effect of stocking at different temperatures and different times on the concentration of MDA (mg/kg food) in dog foods (as total).
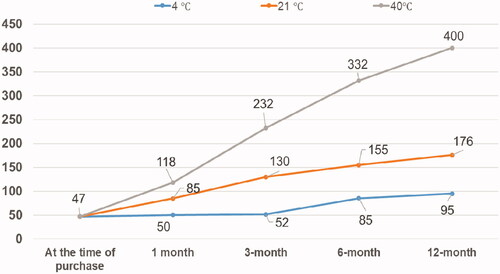
Figure 2. The effect of stocking at different temperatures and different times on the concentration of MDA (mg/kg food) in dry type dog foods.
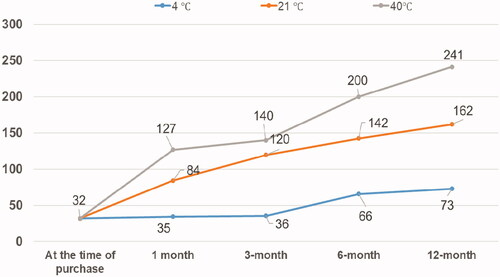
Figure 3. The effect of stocking at different temperatures and different times on the concentration of MDA (mg/kg food) in wet type dog foods.
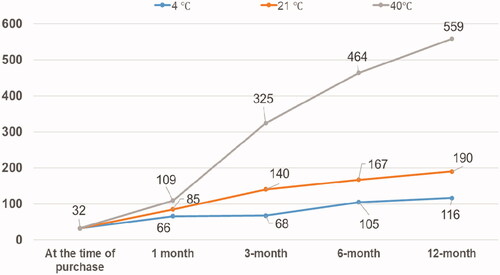
Table 2. PV and MDA of dog foods at different stocking conditions.
The PV’s of PC and EC dog foods were similar for 1 and 3-month storage. However, the PV’s of PC dog foods were higher at 6 and 12 months than the EC dog foods (p < .05). The PV of the wet-type dog foods was significantly higher than the dry-type dog foods (p < .001). The average PV of all dog foods did not change in the first 3 months despite the increase in stocking temperature, but the PV increased significantly with the increase in the stocking temperature in the 6th and 12th months (p < .001). There were no differences for PV among the dog food classes and the stocking temperature interaction for the same temperature degrees in terms of dog food classes up to 3 months of stocking. In the 6th and 12th months (for the same temperatures), it was determined that the PV values of the EC dog foods were higher than those of the PC dog foods (p < .05) (Table ).
Fatty acid profiles of dog foods stocked at different temperatures and times
Dog foods stocked for one month
The ALA, DHA, and oleic acid contents of PC dog foods, stocked at different temperatures for one month, were higher than those of the EC foods (p < .05). However, the linoleic acid contents in the dry types of the EC and PC dog foods, stored at different temperatures for one month, were less than those in the wet types of the EC and PC dog foods (p < .05). The ALA, DHA, EPA, linoleic acid, and oleic acid contents of the wet type dog foods, stored at different temperatures for one month, were generally higher than those of the dry type dog foods (p < .05). The amounts of ALA and oleic acid of the dry type of EC dog foods were higher than those of the dry type of EC dog foods (p < .05). The DHA, EPA, and linoleic acid levels of the dry type of EC dog foods were similar to those of the dry type of EC dog foods (p > .05) (Table ).
Table 3. The fatty acid contents of dog food at different stocking conditions.
Dog foods stocked for three months
The DHA and oleic acid levels in the PC dog foods were higher than those of the EC dog foods (p < .05). In addition, the ALA, EPA, and linoleic acid levels in the EC dog foods, stocked at different temperatures for three months, were higher than those of the PC dog foods (p < .05). The levels of ALA, DHA, EPA, linoleic acid, and oleic acid in the wet type foods, stocked at different temperatures for three months, were higher than those of the dry type dog foods (p < .05). The ALA and oleic acid levels of the dry type of PC dog foods were higher than those of the wet type of PC dog foods (p < .05). At the end of three months stocking, the DHA levels in wet types of the PC dog foods, were higher than those of the wet types of EC dog foods (p < .05). The linoleic acid levels in the wet types of EC dog foods were higher than those of the wet type foods of the PC dog foods (p < .05) (Table ).
Dog foods stocked for six months
In the 6th month of stocking, the contents of ALA, DHA, and oleic acid of the PC dog food were higher than those of the EC dog foods (p < .05). In 6 months of stocking, the amounts of linoleic acid in the EC dog foods were higher than those of the EC dog foods (p < .05). The EPA contents of the PC dog foods, which were stocked for 6 months, were similar to those of the EC dog foods (p < .05). In stocking for 6 months, the average levels of ALA, DHA, EPA, linoleic acid, and oleic acid of the wet type dog foods were higher than those of the dry type dog foods (p < .05). The DHA content in the wet type of PC dog foods, stocked for 6 months, was higher than that of the wet type of EC dog food (p < .05) (Table ).
Table 4. The fatty acid contents of dog food at different stocking conditions.
Dog foods stocked for twelve months
The contents of ALA and DHA of the PC dog food, stocked for 12 months, were higher than those of the EC dog food (p < .05). The linoleic acid content of the EC dog foods at 12 months of stocking was higher than that of the PC dog foods (p < .05). There was no difference between dog food classes in terms of EPA and oleic acid contents of dog foods, which were stocked for 12 months (p < .05). At the end of 12 months of storage, the contents of ALA, DHA, EPA, linoleic acid, and oleic acid in the wet-type dog foods were higher than the dry-type dog foods (p < .05). The contents of ALA, linoleic, and oleic acids in the dry-type of PC dog foods at the end of 12 months of storage were higher than those of the dry-type of EC dog foods (p < .05). The DHA of the wet type of PC dog foods for 12 months stocking was higher than that of the wet type of EC dog foods (p < .05). The linoleic acid in the wet type of PC dog food at 12 months was lower than that of the wet type of EC dog foods (p < .05) (Table ).
Pearson correlations among PV, MDA, and fatty acid contents
Dry dog foods
The stocking temperature was positively correlated with PV (r = 0.319), MDA (r = 0.569) of dry dog foods and negatively correlated with ALA (r = −0176) and EPA (r = −0.146) (p < .05). The increase in stocking time was positively correlated with the levels of PV (r = 0.466) and MDA (r = 0.378) and was negatively correlated with DHA (r = −0.247) and EPA (r = −0.290) (p < .05). The PV was positively correlated with the MDA (r = 0.435) and was negatively correlated with linoleic acid (r = −0.151) and w-9 (r = −0.096) (p < .05). MDA was negatively correlated with linoleic acid (r = −0.195) (p < .05) (Table ).
Table 5. Pearson correlations among changes of dog foods, stocked at different stocking conditions.
Wet dog foods
The stocking temperature was positively correlated with PV (r = 0.336) and MDA (r = 0.397) (p < .05). The increase in the stocking time was positively correlated with PV (r = 539) and MDA (r = 0.310), while it was negatively correlated with linoleic acid (r = −0.126), DHA (r = −0.235), and EPA (r = −0.234) (p < .05). The PV was positively correlated with the MDA value (r = 0.558) (p < .05). The MDA was positively correlated with the storage time (r = 0.310) and PV (r = 0.558) but were negatively correlated with DHA (r = −0.174), oleic acid (r = −0.195) (p < .05).
Discussion
PV and MDA concentrations
The oils and fats that enter the formulation of dog food are responsible for the main sensory changes that occur during the shelf life of food due to lipid oxidation. The unwanted taste caused by oxidation has a great economic impact on the food industry. In addition, it can reduce the nutritional quality of the food (such as fatty acids profile) and cause the production of toxic products, loss of fat-soluble vitamins, and the emergence of odour compounds that negatively affect food consumption (Marchi et al., 2018; Osawa et al. Citation2008). Despite this information, the available literature on the maximum limit of PV in pet food is very limited and the National Research Council (NRC, Citation2006), Association of American Feed Control Officials (AAFCO), and the European Pet Food Industry Federation (FEDIAF, Citation2020) do not give any reference value for the maximum allowed PV in dog and cat foods. The presented study shows individual differences between commercial companies in terms of PV and MDA values of commercial dog foods at the time of purchase. There was a difference between the types of dog foods in terms of PV and MDA concentrations at the time of purchase. At the time of purchase, the concentrations of PV (7.22 mEq O2/kg fat) and MDA (32.89 mg/kg) in dry-type dog foods were lower than those concentrations of PV (20.25 mEq O2/kg fat) and MDA (62.62 mg/kg food) in wet-type foods and this shows that wet-type dog foods may be less resistant to lipid peroxidation. These results may indicate that the fat/oil contents and ALA, EPA, and linoleic acids of the wet-canned dog foods in the presented study were higher than those of the dry type dog foods were. In addition, the fact that the production dates of the commercial dog foods purchased were not included on the dog food labels and the dog food did not provide information about the shelf time of the dog food before purchase from the market shows that there may be differences between brands. Marchi et al. (Citation2018) reported that the average PV of 208 different extruded dog foods was 17.49 mEq O2/kg fat (2.2–94.10 mEq O2/kg fat). The results by Marchi et al. (2018) regarding the PV of dog food were consistent with the present study results. In another study, Osawa et al. (Citation2008) reported that MDA concentration of 18 pet foods ranged from 7.5 to 138 nmol/kg, and the PV ranged from 1.4 to 6.8 mEq O2/kg fat. The average PV’s of dog foods reported by Osawa et al. (Citation2008) were lower than the PV of dog foods in the present study. In another study, the acid value, as the peroxidation indicator, of four different extruded dry type dog foods, was found as a significant difference (8–32 mg KOH/g) among brands (Holda and Glogowski, Citation2016).
The extruding process applied in pet food production and the stocking time of the pet foods are the main conditions, which cause lipid oxidation in pet foods. However, since the extruding process is a very short process applied to raw materials of dog food, its effect on oxidation may not be very serious. However, the raw material in the extruder can be processed as pro-oxidant by being exposed to friction and pressure due to the abrasion of the extruder screw and the air trapped in it by the expansion of the food exiting the extruder can create a larger surface area and support its oxidation (Singh et al. Citation2007). There are studies showing that the extrusion process has a negative effect on antioxidants (Case et al. Citation2011). Extruded pet foods are often enriched with antioxidants that help prevent oxidation and preserve nutritional value as they exceed the shelf life of 12 to 18 months (Marchi et al. Citation2018). In the present study, the average PV of purchased PC and EC foods was 13.79 to 13.68 mEq O2/kg fat, although there was no statistical difference and a significant difference was found between MDA concentrations (40–55 mg/kg DM). This shows that there is no difference between PC and EC dog foods for the end products in the step resulting in free radicals and peroxyl radicals, by isolating a hydrogen atom from the α-methylenic carbon in the unsaturated fatty acid group in the first stage, which is from the autoxidation process of oils in three stages (initiation, propagation, and termination) (Catala Citation2010). After this stage, with the breakdown of fatty acids, tasteless, odourless, and non-flavoring products are formed (Antolovich et al. Citation2002). Afterwards, oxidation products are formed, which are evident with changes in the taste and odour of the food. In the present study, the increased concentration of MDA, which is the indicator of the density of the end products of its oxidation, reveals that the duration of oxidation is different between the food classes and the taste-odour compounds differ. PC foods had lower concentrations in terms of oxidation end products (MDA) than EC foods. PC foods may include high levels of antioxidants and non-use of oxidised raw materials (oil seeds, animal fat, and vegetable oil) in the formula, but differences in extrusion processes (such as extrusion time, screw pressure, air gap in the pellet) may occur. The increases in the PV and MDA due to the increase in the stocking temperature up to 40 °C in the present study were compatible with the literature (Tatum and Chow Citation2008). In the present study, the PV and MDA concentration that increased with the increasing stocking times and temperatures were similar to the results of increased lipid peroxidation of dry type dog foods, stocked for 7 months at +21 °C by Holda and Glogowski (Citation2016). Although the PV’s at the 1st and 3rd months of PC and EC dog foods were similar, the PV’s at the 6th and 12th months of EC dog foods were higher than those of PC dog foods. The PV’s of wet type dog foods in the current study were significantly higher than those of dry type dog foods and may indicate that wet type dog foods are more prone to peroxidation. Due to the increase in the stocking temperature in the study, the PV’s of the dog foods did not change in general for the first 3 months. The PV’s in 6th-12th months of the dog foods increased significantly with the temperature increase. These showed that the antioxidant-oxidant and pro-oxidant compounds provided the balance (oxidation-antioxidant) in the first 3 months of stocking times (Turek et al. Citation2003; Domínguez et al. Citation2019) and then the situation shifted in favour of oxidation. In the present study, after 3 months stocking, there were differences among the class and type dog food and stocking temperature in terms of PV. The low antioxidant level in the EC dog foods, or because some factors that initiate oxidation were more effective in the EC dog food (metals, free fatty acids, lipoxygenases), may be related to the high PV (Tatum and Chow Citation2008).
Lipid oxidation of pet food is one of many factors affecting shelf life constitutes and they form unwanted flavours and odours (Jacobsen Citation1999). The acceptability of pet food is generally determined by sensory properties, such as appearance, aroma, texture, and taste (Koppel Citation2014). In the present study, until the first 3 months stocking, the PV of dry type foods was lower than that of the wet type and it was understood that these levels of PV’s in the present study would not negatively affect the taste sense of dogs (Jones and Lewis Citation2000). In addition, it was understood that PV reached 13.20–19.08 mEq O2/kg fat by stocking the dry type of PV and EC dog foods, at +4 °C for up to 12 months (Jones and Lewis Citation2000). However, it was observed that dry and wet type dog foods (in both PC and EC) stocked up to 12 months at other stocking temperatures would adversely affect the consumption by dogs, due to the high PV.
Stocking at different temperatures for 3 months did not change the PV’s of dog food (premium or economic and wet or dry types). Stocking of dog food at +21 °C and +40 °C for 6 and 12 months significantly increased the PV of dog foods. At 12 months of stocking, the PV of the EC dog food (wet and dry) was 50% higher than those of the PC dog food.
Despite the measures taken to prevent the spoilage of dog food, it is stated that the oxidation of the foods currently on sale in the markets cannot be prevented (Osawa et al. Citation2008). In previous study, it was reported that 43% of 37 different commercial pet foods had a PV of more than 20 meq/kg, fat (Corbin Citation1996). The smell of animal fat is easily perceived and reduces food palatability for people with PV of 20 meq/kg or more. Because a dog's sense of smell is 50–100 times more sensitive than humans, this oxidation is undoubtedly detected by them at a much lower value, which reduces the food consumption by dog (Corbin Citation1996). In the present study, the PV of dry-type foods (about 6.70–10 mEq O2/kg) until the first trimester stocking was lower than that of wet-type (about 21–26 mEq O2/kg) and according to Corbin (Citation1996). According to these levels, it is understood that the PV value cannot negatively affect the sense of taste in dogs. It is understood that the PV (13–19 mEq O2/kg) values of PC-dry type and EC-dry type, which were stored at +4 °C for up to 12 months, may not cause any adverse effects for dog food consumption (Corbin Citation1996). When evaluated in general, it has been understood that the dry and wet types of EC and PC dog foods were stored at different temperatures (4 °C, 21 °C, and 40 °C) up to 6-month, may not negatively affect the food consumption due to the increase in PV. However, it is thought that stocking these foods for more than 6 months at these temperatures will negatively affect the food consumption of dogs by increasing the PV of the food.
Fatty acid profile
Dietary fats are both a source of essential nutrients and a source of energy and flavour. The inclusion of fat/oil in the food can increase the palatability of pet food by changing the flavour and odour infinitely in dogs and up to a certain point for cats (Case et al. Citation2011). The labels of dog foods state that they contain a balanced combination of w-6 and w-3 fatty acids. Some other dry type dog foods state that they have an optimum ratio of w-6:w-3. The presence of w-6 and w-3 fatty acids in a balance or optimum ratio in dog foods alone is not informative (Beynen Citation2020). High linoleic acid intake with diet can inhibit ALA desaturation and thus its conversion to EPA, DHA, and eicosanoids. The combination of more linoleic acid derivatives and less ALA derived eicosanoids has a proinflammatory effect (Waldron et al. Citation2012). ALA can be converted to other w-3 fatty acids, especially EPA and DHA in the organism of dogs (Beynen Citation2020), as well as the ratio of ALA, DHA, and EPA in dog foods. In addition, pre-formed EPA and DHA can be added to dog food as components of fish oils. When the dog foods were bought from the market, EPA contents (0.25 g/100g DM) of the wet type dog foods were significantly higher than those of the dry type dog foods (0.03 g/100g DM). Ahlstrom et al. (Citation2004) found that percentages of EPA and DHA in total fatty acids in 12 different commercial dry-type dog foods belonging to large adult and puppies showed a significant difference between brands. In another study, it was reported that the percentages of DHA in total fatty acids of dry type dog foods were different in dog foods with fish oil (2.85%) and dog foods without fish oil (0.16%) (Ricci et al. Citation2009). At the end of 12 months of stocking, the EPA + DHA contents decreased 13% (0.26 g/100 g DM) in PC dog foods and decreased 50% (0.17 g/100g DM) in EC dog foods. A study to evaluate fatty acid stability in an antioxidant vitamin premix showed that EPA, DHA, and total w-3 fatty acids of dog foods, which were stocked over 6 weeks in stressed shelf life condition (40 °C and 70% relative humidity), lowed no more than a 12% ratio.
In the current study, antioxidant additives (level and type) in PC dog foods may have more efficient in preventing oxidation in very long-chain w-3 essential fatty acids, depending on increased stocking time, compared to those of the possible antioxidant additives in EC dog foods. In general, after 12 months of stocking, the EPA + DHA content lost 33% (0.22 vs 0.15 g in 100 g DM) in dry type foods and had a 36% loss (0.44 vs 0.28) in wet type foods. As an average value, it can be said that the loss rates of EPA + DHA fatty acids at the end of 12 months of stocking occur at a close rate for both types of food, and significant loss has occurred with the stocking process. In the present shelf life study, a negative correlation was found between the EPA level and the increase in the stocking temperature of dry type products with up to 12 months of storage. No correlation was found between the stocking temperature and EPA and DHA levels in wet type foods. This indicates that the EPA level will decrease with the increase in the stocking temperature of dry type foods. It may be said that antioxidant additives protected the DHA level from oxidation due to the increase in stocking temperature in dry type foods, but they were not very effective on EPA.
The fatty acid w-3 ALA, which is the most sensitive fatty acid group to lipid peroxidation, is degraded to hepta-2, 4-dienal and ethane during autoxidation and eventually forms propanol and but-2-enal as determined by researchers (Antolovich et al. Citation2002). In the study presented, contents of ALA in dog foods were found as 0.17 g in PC dog food, 0.11 g in EC dog food, 0.18 g in wet type dog foods, and 0.10 g in dry type dog foods (in 100 g DM). However, the ALA contents of the dry type in PC dog foods and dry type in EC dog foods significantly decreased with a negative correlation with the 12-month stocking period, and the ALA stabilities in PC dog foods were better than those of the EC dog foods. In the study, it was observed that stocking temperature generally did not alter ALA stability in dog food. International authorities report that adult dogs fed at the maintenance level should have a minimum of 0.08 g for ALA per 100 g DM and a minimum of 0.05 g for EPA + DHA (NRC, Citation2006; FEDIAF, Citation2020). However, the ALA level in the dry type of EC dog foods decreased to 0.05 g/100g DM after 12 months of stocking and showed that it was below the minimum limit in dog food by international authorities (NRC, Citation2006; FEDIAF, Citation2020). The ALA levels of PC (dry type and wet type) and EC (wet type) dog foods at the end of 12 months of stocking were found to be above the minimum limit of international authorities (NRC, Citation2006; FEDIAF,Citation2020) and would not have a negative effect on the nutritional needs of dogs.
Conclusion
There was individual variation between commercial companies in terms of PV and MDA concentrations of dog food when purchased from the market. The PV and MDA concentrations of dry-type dog foods had lower than wet-type dog foods and wet-type dog foods were more susceptible to oxidation. In general, stocking of dog food (premium-economic class and dry-wet type) for 3 months at +4 °C does not significantly change the food MDA concentration, while stocking food MDA concentration at +4 °C for 6 and 12 months increased the food MDA concentration 2–2.5 times.
The EPA amount of the wet type foods, when purchased from the market, was significantly higher than that of the dry type foods. At the time of purchase, ALA levels of wet and dry types in PC foods and wet type in EC foods were above the minimum value required to be found according to international standard values, but were below international standard values in the dry type in the economic class foods. At the end of 12 months of stocking, the EPA + DHA contents of dog food reached a 13% decrease in the premium class dog food and a 50% decrease in the economic class dog foods.
During the 12-month stocking of dog food, the loss rates of EPA + DHA fatty acids were close in both types of food and significant losses occurred with the stocking duration. The ALA in the dry types of premium class and economic class dog foods decreased with the 12-month stocking and ALA stability in the premium dog foods was better than economic class dog foods. The stocking temperature during 12 months of stocking had a significant negative effect on linoleic acid in dry types of EC foods and decreased to 1.30 g/100 g DM, which showed that it reached the critical limit for adult dogs.
Ethical approval
In this study, which was produced from the a TÜBİTAK Grant project, no animal or animal-derived product (such as feces, blood) that would require ethics committee approval was used as study material. No ethical approval was therefore requested.
Acknowledgments
The article was proofread by Professor Eugene Steel, which is from English Department-Erciyes University, for typographical, grammatical, spelling, punctuation, and syntactical errors. I would like to thank Ms. Delal YAVUZ and Ms. S. Bilge KAYA for their help during the laboratory phase.
Disclosure statement
The authors declare that they have no conflict of interest.
Data availability statement
The data that support the findings of this study are available on request from the corresponding author, [initials]. The data are not publicly available due to [restrictions e.g. their containing information that could compromise the privacy of research participants].
Additional information
Funding
References
- Ahlstrom Q, Krogdahly A, Vhile SG, Skrede A. 2004. Fatty acid composition in commercial dog foods. J Nutr. 134:2145–2147.
- Antolovich M, Prenzler PD, Patsalides E, McDonald S, Robards K. 2002. Methods for testing antioxidant activity. Analyst. 127(1):183–198.
- AOAC 1990. Official methods of analysis 15th ed. Arlington (VA): Association of Official Analytical Chemists, Inc.
- Beynen AC. 2020. Omega-6:3 ratio in dog food. Bonny Canteen. 1:38–49.
- Botsoglou NA, Fletouris DJ, Papageorgiou GE, Vassilopoulos VN, Mantis AJ, Trakatellis AG. 1994. Rapid, sensitive, and specific thiobarbituric acid method for measuring lipid peroxidation in animal tissue, food, and feedstuff samples. J Agric Food Chem. 42(9):1931–1937.
- Buff PR, Carter RA, Bauer JE, Kersey JH. 2014. Natural pet food: a review of natural diets and their impact on canine and feline physiology. J Anim Sci. 92(9):3781–3791.
- Case LP, Daristotle L, Hayek MG, Raasch MF. 2011. Canine and Feline Nutrition: A Resource for Companion Animal Professionals. 3rd ed. USA: Mosby Elsevier. https://www.sciencedirect.com/book/9780323066198/canine-and-feline-nutrition, https://doi.org/https://doi.org/10.1016/C2009-0-39175-8
- Catala A. 2010. A synopsis of the process of lipid peroxidation since the discovery of the essential fatty acids. Biochem Biophys Res Commun. 399:318–823.
- Chanadang S, Koppel K, Aldrich G. 2016. The impact of rendered protein meal oxidation level on shelf-life, sensory characteristics, and acceptability in extruded pet food. Animals. 6(8):44.
- Tatum V, Chow CK. 2008. Chapter 19. Effects of processing and storage on fatty acids in edible oils. In: Chow CK. (editor), Fatty acids in foods and their health implications. 3rd ed. p. 493–510. CRC Press. https://doi.org/https://doi.org/10.1201/9781420006902
- Corbin J. 1996. Petfood rancidity. Petfood Industry. 1-2:6.
- Domínguez R, Pateiro M, Gagaoua M, Barba FJ, Zhang W, Lorenzo JM. 2019. A Comprehensive review on lipid oxidation in meat and meat products. Antioxidants. 8(10):429.
- FEDIAF. 2020. Nutritonal guidelines for complete and complementary pet food for cats and dogs. Bruxelles: The European Pet Food Industry Federation.
- Glodde F, Gunal M, Kinsel ME, Ghazaleh AA. 2018. Effects of natural antioxidants on the stability of omega-3 fatty acids in dog food. Journal of Veterinary Research. 62(1):103–108.
- Heinze CR. 2016. Premium pet foods – are they worth the premium price? [Accessed 26 November 2018]. http://vetnutrition.tufts.edu/2016/10/should-you-buy-premium-pet-food/
- Hillestad K. 2018. Shelf life of pet food. [Accessed 27 November 2018]. https://www.petcoach.co/article/shelf-life-of-pet-food/
- Holda K, Glogowski R. 2016. Selected quality properties of lipid fraction and oxidative stability of dry dog foods under typical storage conditions. J Therm Anal Calorim. 126:91–96.
- Jacobsen C. 1999. Sensory impact of lipid oxidation in complex food systems. Fett/Lipid. 101(12):484–492.
- Jones DR, Lewis LD. 2000. Combination contaıner and dry pet food for increased shelf life, freshness, palatability, and nutritional value. United States Patent. Patent Number: 6,063,414.
- Kara K. 2020a. Determination of the in vitro digestibility and nutrient content of commercial premium extruded foods with different types of protein content for adult dogs. Veterinarni Medicina. 65(No. 6):233–249.
- Kara K. 2020b. Milk urea nitrogen and milk fatty acid compositions in dairy cows with subacute ruminal acidosis. Veterinarni Medicina. 65(No. 8):336–345.
- Koppel K. 2014. Sensory analysis of pet foods. J Sci Food Agric. 94(11):2148–2153.
- Marchi M, Righi F, Meneghesso M, Manfrin D, Ricci R. 2018. Prediction of chemical composition and peroxide value in unground pet foods by near-infrared spectroscopy. J Anim Physiol Anim Nutr (Berl). 102(1):337–342.
- NRC. 2006. Nutrient requirements of dogs and cats. Washington (DC): The National Academies Press.
- Osawa CC, Gonçalves LAG, Ragazzi S. 2008. Evaluation of the quality of pet foods using fast techniques and official methods. Ciênc Tecnol Aliment. 28:223–230.
- Ricci R, Berlanda M, Tenti S, Bailoni L. 2009. Study of the chemical and nutritional characteristics of commercial dog foods used as elimination diet for the diagnosis of canine food allergy. Ital J Anim Sci. 8(Sup2):328–330.
- Singh S, Gamlath S, Wakeling L. 2007. Nutritional aspects of food extrusion: a review. Int J Food Sci Tech. 42(8):916–929.
- Stadtman ER, Levine RL. 2003. Free radical-mediated oxidation of free amino acids and amino acid residues in proteins. Amino Acids. 25(3-4):207–218.
- Turek JJ, Watkins BA, Schoenlein IA, Allen KD, Hayek MG, Aldrich CG. 2003. Oxidized lipid depresses canine growth, immune function, and bone formation. J Nutr Biochem. 14(1):24–31.
- Waldron MK, Hannah SS, Bauer JE. 2012. Plasma phospholipid fatty acid and ex vivo neutrophil responses are differently altered in dogs fed fish- and linseed-oil containing diets at the same n-6:n-3 fatty acid ratio. Lipids. 47(4):425–434.
- Walters JM, Hackett TB, Ogilvie GK, Fettman MJ. 2010. Polyunsaturated fatty acid dietary supplementation induces lipid peroxidation in normal dogs. Vet Med Int. 2010:619083.
- Wang J, Wu W, Wang X, Wang M, Wu F. 2015. An affective GC method for the determination of the fatty acid composition in silkworm pupae oil using a two-step methylation process. J Serb Chem Soc. 80(1):9–20.