
 ?Mathematical formulae have been encoded as MathML and are displayed in this HTML version using MathJax in order to improve their display. Uncheck the box to turn MathJax off. This feature requires Javascript. Click on a formula to zoom.
Abstract
Dairy sheep systems are relevant for the economy of many rural areas of the Mediterranean Basin and the optimisation of their productive factors is necessary to improve their competitiveness and to reduce their environmental impact. The objective of this study was to assess, through a farm-scale life cycle assessment (LCA) approach, the potential of reducing environmental impacts on ewe milk of an innovative farming system (IF), based on the adoption of a precision feeding approach to improve milk production and quality, compared with a conventional farming system (CF) in dairy sheep farms in Tuscany region, Italy. The LCA analysis was carried out through a cradle-to-farm-gate LCA, comparing three conventional farms with three innovative farms, using 1 kg of fat protein corrected milk (FPCM) as a functional unit. The Small Ruminants Module of Nutritional Dynamic System (NDS) software was used to estimate methane emissions due to enteric fermentation. The introduction of precision feeding strategy reduced the environmental impacts of ewe milk as a consequence of the increased milk production efficiency (+50%). Indeed, the environmental impact of ewe milk was reduced in IF by 42% as the average of the impact categories being significantly different between the two farming systems.
Precision feeding is recognised as a strategy to mitigate the environmental impacts of ruminant production.
Dairy sheep innovative farms (IF), using a precision feeding approach, were compared with conventional farms (CF).
Environmental impacts of ewe mik were assessed through an LCA approach and a mechanistic model for ruminant diet formulation and evaluation.
Precision feeding improved milk production efficiency (+50) and lowered environmental impacts.
Environmental impact of ewe milk was significantly reduced in IF by 42% in eight impact categories out of 15.
Highlights
Introduction
Dairy small ruminants are mainly located in subtropical-temperate areas of Asia, Africa and Europa and they account approximately for 29% of all sheep and goats in the world, producing around 3.4% of the world’s milk (FAOSTAT Citation2021). In Europe, dairy sheep are concentrated around the Mediterranean and Black Sea regions, where their dairy products are typical ingredients of the human diet (Pulina et al. Citation2018). In Italy, most of sheep milk is processed by the dairy industry (71%) and dairy sheep production is associated with recognised high-quality cheeses through the protected designation of origin (PDO) label such as Pecorino Romano and Pecorino Toscano (ISTAT Citation2017). Thus, dairy sheep systems are relevant for the economy of many rural areas and the optimisation of their productive factors is an effective strategy for increase their competitiveness and reduce their environmental impact (de Rancourt and Carrere Citation2011; Vagnoni and Franca Citation2018). One of the most promising approach to improve their production efficiency is precision livestock farming (PLF) (FAO Citation2016a; Morgan-Davies et al. Citation2018; Odintson Vaintrub et al. 2021). PLF applies precision agriculture concept to livestock farming and it is aimed to offer a real-time monitoring and managing system to farmers through a technological support (Wathes et al. Citation2008; Berckmans Citation2017). Although PLF historically has been more associated with intensive livestock systems, some authors (Gonzalez et al. Citation2018; Morgan-Davies et al. Citation2018; Odintsov Vaintrub et al. Citation2021) argue that these technologies could equally be beneficial if introduced in extensive systems. The benefits may include greater economic returns, reduced methane emissions from enteric fermentation, reduced nitrogen and phosphorus excretions to the environment, and improved efficiency of resource utilisation (Arriaga et al. Citation2009; Gerber, Steinfeld, et al. Citation2013; Uwizeye et al. Citation2016; Pulina et al. Citation2017). Precision feeding, that is part of PLF, aims to match nutrient supply precisely with the nutrient requirements of individual animals or groups, based on real-time feedback from sensors (Zuidhof Citation2020). Indeed, feed production and enteric fermentation cover about 70% of total GHG emissions for milk production from small ruminants, so improving feeding is a strategy to reduce these impacts (Gerber, Steinfeld, et al. Citation2013). Generally, precision feeding is recognised to be an effective GHG mitigation strategy for livestock sector with low-medium potential especially for non-CO2 GHG emissions, namely CH4 emission from enteric fermentation, identified as the main source of impact in carbon footprint studies, while no clear results were identified on the other impact categories (Gerber, Steinfeld, et al. Citation2013; Henderson et al. Citation2017). Specific mathematical models have been developed in literature by several research institutions and universities, in order to predict requirements, feed utilisation, animal performance and nutrient excretion for ruminants using knowledge about feed composition, digestion and metabolism (Morgan-Davies et al. Citation2018; Cannas et al. Citation2019, Citation2004; Odintsov Vaintrub et al. Citation2021).
However, the environmental impact of precision feeding on dairy sheep farming is to date relatively unknown. The overall environmental impact of the entire production process can be estimated by the life cycle assessment (LCA), a holistic approach that uses a systematic set of procedures to convert the inputs and outputs of materials and energy that characterise a process into the associated environmental impacts. It is internationally standardised by ISO 14040:Citation2006 and 14044:2006, which define the four founding pillars (goal and scope definition, inventory, impact assessment and interpretation of results) in order to harmonise as much as possible its use among practitioners (ISO 14040 2006; ISO 14044 Citation2006). LCA has been largely applied worldwide in the last decades in evaluating the environmental impacts of livestock systems (Cederberg and Mattson Citation2000; de Vries and de Boer Citation2010; Baldini et al. Citation2017; Lovarelli et al. Citation2020). Standard methodology and guidelines for quantifying greenhouse gas (GHG) emissions and fossil fuel demand from sheep and goat supply chains, covering the system boundary of the cradle-to-primary-processing-gate, were recently developed by the Livestock Environmental Assessment and Performance (LEAP) Partnership (FAO Citation2016a, Citation2016b) and by the Product Environmental Footprint Category Rules for Dairy Products (European Dairy Association Citation2018).
However, very few studies were found in literature on dairy sheep LCA, no one about the effect of precision feeding (Marino et al. Citation2016; Bhatt and Abbassi Citation2021). Moreover, as assessed by McClelland et al. (Citation2018), livestock LCA overwhelmingly focuses on GHG emissions and climate change and few studies in literature included other impact categories, the most used were resource depletion, eutrophication and acidification. While considering climate change impact as a critical element of livestock production systems, this impact category alone is insufficient for defining the full LCA. Indeed, livestock production systems affect water, air and soil quality, global climate and biodiversity, altering the biogeochemical cycles of nitrogen, phosphorus and carbon (Leip et al. Citation2015). In particular, acidification and eutrophication of soils, water and air cannot be disregarded, since crop-livestock systems can have many losses to the environment, many due to an inefficient use of nitrogen, which precipitates a variety of negative economic, human/animal health and environmental impacts (Ershadi et al. Citation2020).
Recently, in the context of regional projects, selected precision feeding strategies have been introduced in some farms in southern Tuscany region (Italy), in order to improve milk quality and productivity. Sheep farming in the area is carried out by small-medium farms, characterised by an average flock size lower than 300 ewes in 76% of the farms (ANZ Citation2018) and the 65% of the farms has an utilised agricultural area (UAA), ranging from 10 to 100 ha, characterised by a prevalent use of annual forage species, cereals and meadow (ISTAT Citation2010). A precision feeding approach, with the use of mathematical models for the ration formulation on sheep group scale was applied to some farms, together with an optimisation of forage and grassland production.
The general objective of this study was to assess if the adoption of precision feeding approach reduced the environmental impacts of ewe milk production. Specific objectives of this paper are: i) to compare environmental impacts of sheep milk of a conventional farming system (CF) with an innovative farming system (IF), based on the adoption of a precision feeding approach, through a farm scale LCA; ii) to identify the farm activities with higher impacts in both farming systems; iii) to assess the effect of diet changing on sheep enteric methane emissions.
Materials and methods
Case study area and farms
Dairy sheep farming in Tuscany, Italy, was located mainly in southern Tuscany. This area is characterised by Mediterranean climate conditions with mean annual temperature of 15 °C and an average annual rainfall of about 800 mm (average 2003 − 2014) (Regione Toscana Citation2020). Conventional dairy sheep farming system in this area is quite homogeneous and can be classified as semi-intensive, the sheep breed most diffused is Sarda. Milk is the main product, used mainly for the production of Pecorino cheese, while meat and wool are co-products with a lower economic importance.
Conventionally, ewes graze daily on temporary grasslands, mainly mixture of oat (Avena sativa ssp. byzantina Koch) and berseem clover (Trifolium alexandrinum L.), under low stocking rates and continuous grazing conditions. Self-produced feed comes from cereals, mainly oat (Avena spp.), barley (L.) and triticale (×Triticosecale), both for grain or flour production, and temporary grasslands for hay production (mainly from oat-clover mixture). Purchased concentrated feed are usually alfalfa (Medicago sativa L.) hay and grain/flour from cereals or legumes (mostly maize, barley and faba bean). Ration is distributed partly in the barn (mainly hay or hay-silage) and partly in the milking parlour (concentrates, two times a day). Total mixed ration is not commonly adopted and the use of corn silage or other silages from cereal crops is rare.
Since 2011, an innovative feeding technique was adopted by some dairy sheep farms of Maremma Region, Tuscany, in the framework of the FORMANOVA project (2007 − 2013 Rural Development Programme (RDP) of the Tuscany Region). FORMANOVA had the main objective of improving milk production and quality of dairy sheep farming systems by introducing new techniques of forage production, both for grazing and hay production purposes and of animal feeding. The innovation on forage production constituted in converting annual crops, mainly oat-clover ley, into perennial forage crops such as sulla (Hedysarum coronarium L.) and alfalfa (Medicago sativa L.), aiming to provide higher quality pasture and hay lowering the costs of forage unit.
Precision feeding included i) a partial substitution of commercial concentrate feed mix with raw materials (whole or cracked grains of cereals and beans), ii) the optimisation hay-making techniques to increase the quality of self-produced hay and iii) the introduction of dietary lipid sources in the diet, namely soybean oil and extruded linseed. The use of these feed additives in the rations for lactating ewes was introduced in order to increase the omega-3 and conjugated linoleic acid content in ewe milk (Chilliard et al. Citation2007; Mele et al. Citation2011; Buccioni et al. Citation2015). Several studies have confirmed that the addition of plant lipids to the diets of ruminants can also decrease enteric CH4 emissions (Patra Citation2014; Lima et al. Citation2019; Vasta et al. Citation2019; Vargas-Bello-Perez et al. Citation2021).
In the innovative farms, all the rations were formulated according to the average requirements of flocks, calculated on the basis of a weekly monitoring of milk yield and quality and by using Cornell Net Carbohydrate and Protein System (CNCPS) sheep models (Cannas et al. Citation2004), implemented into Nutritional Dynamic System (NDS) software (RUM&N SAS, Reggio Emilia, Italy). Feed database of the NDS software was implemented with the nutritional characteristics of the self-produced fodder and concentrate feeds. Nutritional characteristics of commercial feeds were provided by the feed industry. Lastly, the portion of ration covered by herbage intake at pasture was considered. Moreover, during the year the data about the herbage intake ration were adjusted respect to the pasture type and quality, in order to ameliorate the fitting between ration composition and animal requirements. The quantification of grazed grass was estimated by considering the expected dry matter (DM) intake provided by the NDS software on the basis of the animal characteristics and applying the prediction equation included in the NDS software. Chemical characteristics of the fresh forage were assessed when the flock moved to a different pasture. Consume of concentrate and preserved forage was weekly monitored at flock level in order to adjust the grazed grass estimation. All research reported in this paper has been conducted in an ethical and responsible manner, and is in full compliance with all relevant codes of experimentation and legislation.
Since the comparison of the two farming systems was not possible in time (before/after comparison) due to the scheduling of the project, thus the two systems were analysed in parallel. Thus, initial assumption was that the farm management in IF before the innovation was similar to CF in terms of flock management, animal feeding, manure management and forage production.
LCA methodology
In this study, the environmental impacts of sheep milk production from three conventional (IC) and three innovative (IF) dairy farms were evaluated, by using an attributional LCA analysis. The LCA analysis was set as a cradle-to-farm-gate LCA, using 1 kg of fat protein corrected milk (FPCM) as functional unit. FPCM was calculated form the annual average milk analyses provided by the cheese factory, using the equation by Pulina and Nudda (Citation2002):
where RM, FC and PC represent raw milk amount (kg), fat content (%) and protein content (%), respectively.
Economic allocation was used to allocate all inputs and outputs among different products that are milk, lamb meat, sheep meat and wool. Economic allocation was chosen considering the large difference in economic values between milk and the other co-products. The annual economic value of milk of each farm was calculated from the monthly invoices of the cheese factory, that take in account both the quantity and the quality of milk delivered (fat and protein content, conjugated linoleic acid [CLA] and omega-3 fatty acid content). Lamb meat, sheep meat and wool value were calculated for each farm from the sales invoices. Percentages for allocation were calculated separately for each farm (Table S1).
Table 1. Main characteristics of the dairy sheep farms included in this study for conventional (CF) and innovative farming (IF) systems.
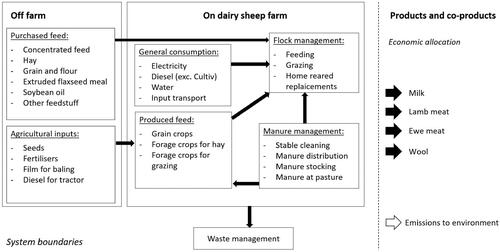
The system boundary includes all the activities necessary for flock management both i) on farm, such as general consumption (energy, water, diesel and transport of inputs), feed production (crop cultivation) and manure management; and ii) off farm, such as purchased feed and all the agricultural inputs necessary for feed production and waste management (Figure ). The study was carried out at annual scale, considering milking season going from September 2015 to August 2016. All primary data on cultivation and milk production refer to this period.
Figure 1. System boundaries of dairy sheep farming.
Data on farm management were collected through specific and detailed questionnaires to farmers to characterise farm management. Invoices for all purchased inputs, such as energy, water, seed, fertilisers and all animal feeds were collected and used to compile and elaborate the life cycle inventory (LCI). Capital goods were not included in the analysis while all transports of purchased inputs are included. Data on milk monthly production and milk quality were obtained from the invoices of the cheese factory. Thus, primary data are of very high quality, according to the criteria of reliability, completeness, and temporal and spatial representation. The main characteristics of the farms included in this study are reported in Table while the complete LCI for each farm is reported in Table S2.
Table 2. Sheep diet composition as dry matter per day for the conventional (CF) and the innovative farming (IF) systems.
The databases used for secondary data were i) Ecoinvent version 3.2 (Ecoinvent, Zurich, Switzerland) and ii) Agribalyse version (ADEME, Angers, France), that includes the ECOALIM dataset of feed ingredients used in animal production (Colomb et al. Citation2015; Wilfart et al. Citation2016). Ecoinvent database was mainly used for quantifying the impact of transport and energy production; on the other hand, the Agrobalyse database allowed estimating the environmental impacts of off farm feeding ration and agricultural inputs.
Flock profile and feeding ration
The sheep flock was subdivided by animal category in lambs, lactating ewes, replacement ewes, dry ewes and rams. For lactating ewes, a further classification was used to distinguish type of ration between the autumn-winter and the spring-summer period, since only in this last period grazing was possible.
The three innovative farms applied a partial de-seasoning lambing. In particular, the lambing season started at September as a consequence of an anticipated mating season at the end of March. The CFs applied the traditional seasoning lambing (lambing started after the second week of November).
For each of the aforementioned categories we collected data on: i) feeding rations and manure management; ii) emissions due to animal feeding and manure management and iii) methane emissions from enteric fermentation. The annualisation of each animal category was calculated by multiplying the number of animals per: 270 d for lambs, 151 d for replacement ewes, 151 d for lactating ewes with winter feeding ration, 122 d for lactating ewes with spring-summer feeding ration, 92 d for dry ewes and 365 d for rams.
The annual consumption of each feeding ingredient in the ration was calculated multiplying the daily amount with the annualised sheep category number (n° of animal × number of days). Six different concentrates were used in the dairy farms (Table ) and a specific concentrate mix was used by innovative farms. Concentrates were modelled by using data from international databases and considering only the production of single raw or transformed ingredients and processing stage at feed plant was not included, as recommended by FAO (Citation2016b). The contributions from production, processing and transport of feedstuffs were included in the system boundaries, as well their impact due to changes in soil carbon and from land use change, using secondary data from databases. Details on feeding ration for each animal category of the six farms are reported in Table as dry matter (DM).
The Small Ruminants module of the NDS software (RUM&N, Reggio Emilia, Italy), based on the CNCPS mechanistic model for ruminant diet formulation and evaluation, was used to estimate the average energy intake of the flocks (Cannas et al. Citation2004). Data in input to the software were sheep breed, sheep weight, milk yield and quality (fat and protein), feeding ration for each sheep category as dry weight including herbage intake, while data in output were the daily gross energy intake per animal (MJ head−1 d−1). The model output was the gross energy intake of the average annual diet for each animal category and this value was multiplied by the default methane conversion factor (Ym) to calculate the annual methane emissions in kg CH4 head−1 year−1, with a Tier 2 approach (IPCC Citation2006). Specific parameters and emission factors applied to estimate methane emissions from enteric fermentation are reported in Table S3, while methane emissions included in the Life Cycle inventory as annual methane emissions per head are reported in Table S4.
Table 3. Impact categories evaluated in this study.
Table 4. ANOVA – absolute results for conventional (CF) and innovative farming (IF) systems (functional unit: 1 kg of fat and protein corrected milk) (n.s. is not significant; * significant at the p ≤0.05 level; ** significant at p ≤0.01 level; *** significant at p ≤0.001 level.).
Manure management was quite similar in all the six farms, consisting in solid manure with straw bedding, which is removed from the stable once or twice a year and immediately applied to the farm fields. The number of hours per day that sheep spent at pasture, on average 4 h per day both in CF and IF, was multiplied for an average daily manure production to estimate the amount of manure produced in the stable and the amount deposited at pasture. Products used for stable cleaning were included. Emissions due to manure storage and distribution were included as well as emissions from manure deposition at pasture. Methane emissions from manure storage were computed as a proportion of the maximum CH4 potential (Bo) of manure using a tier 1 method of IPCC (Citation2006). Unfortunately, the Small Ruminants module of the NDS software did not provide diet-specific nitrogen excretion rates for each farm and sheep category, so value from literature was used (Masoni Citation2010).
Modellisation of crop cultivation
Modellisation of crop cultivation was carried out following the product category rules (PCR) guidelines developed for ‘Arable Crops’ (EPD, Citation2016). Only crops amount used for sheep feeding were included in the model (‘total allocated area’ in Table ). Production of straw from durum wheat (Triticum turgidum subsp. durum (Desf.) Husn.) was included using an economic allocation, since grain was excluded, being sold outside the farm. A specific model was built for each crop of the six farms, namely durum wheat, bread wheat (Triticum aestivum L.), triticale, oat, barley, annual meadow (oat-clover mixture), annual grassland (oat-clover mixture), sulla and alfalfa. For each crop, the model included diesel consumption for all agricultural operations (primary and secondary tillage, sowing, fertilisation, mechanical and chemical weeding, hay mowing, harvesting and straw baling), production of all related inputs (diesel, seeds, fertilisers, herbicides, net for hay bales and packaging). Emissions to environment included were: ammonia, dinitrogen monoxide, nitrogen oxides to air, nitrates and phosphates to water. These emissions were estimated using default emission factors from IPCC (Citation2006) and PCR Arable Crops (EPD, Citation2016). Some emission factors are reported in Table S3.
Impact assessment
Inventory data were processed using OpenLCA version (8.3 GreenDelta, Berlin, Germany) to assess the environmental impacts related to conventional and innovative dairy sheep farms. The impact assessment was carried out by means of the International Reference Life Cycle Data System (ILCD) midpoint method (Wolf et al. Citation2012), including the impact categories shown in Table and using the IPCC (Citation2013) method for impact on Climate Change. Acronyms, units and references for each impact category are reported in Table .
Data elaboration and statistical analysis
Results of the life cycle impact assessment were analysed both as total value and as process contribution. Process contribution was analysed for: 1) general consumptions (diesel, electricity, water consumption, waste management and transport of inputs); 2) enteric fermentation; 3) on farm cereal cultivation (wheat, barley, oat and triticale); 4) on farm forage cultivation (alfalfa and oat/clover meadow for hay production); 5) on farm grassland cultivation (grassland for pasture); 6) off farm hay production; 7) off farm cereals and legume production; 8) concentrates production; 9) off farm other feed production (extruded flaxseed meal, soybean oil, sugar beet root pulp and vitamins); 10) manure management (stable cleaning, manure distribution, emissions from stocking and distribution in field) for the process contribution analysis.
Data elaboration and statistical analysis were performed with R software (R Core Team Citation2018). One-way ANOVA was applied to the total value to determine whether there was a statistically significant difference between CF and IF in each impact category. To assess the difference in the annual methane per head emitted from the enteric fermentation between CF and IF and between the different animal categories, a two-way ANOVA was used with ‘farming system’ and ‘animal category’ as factors. Tukey’s HSD post hoc test was used to identify significant differences among treatments (α = 0.05).
Principal component analysis (PCA) was carried out using the R package ‘vegan’ with processes as variables on the impact categories which turned out to be significant different between CF and IF from the one-way ANOVA. PCA was used to identify correlations between processes and farm type per each impact category.
Results
Results of environmental impact of ewe milk in conventional farms and innovative farms
The results from the one-way ANOVA showed that the environmental impact of ewe milk was significantly lower in IF compared to C in eight impact categories out of 15, while no differences were observed in the others impact categories (Table ). CC, FE, Ire and ME showed a reduction of 44% from CF to IF, followed by POF and OD, with a reduction of 42 and 41%, respectively, and then with slightly lower values by PM (38%) and RDm (37%).
Impact contribution analysis
The results of the 15 impact categories, used to compare the environmental impact of the milk produced in CF and IF, were analysed in order to identify processes that contributed most to each impact category (Figure ).
Figure 2. Process contribution to environmental impacts per impact category and farm type. Impact category: A: acidification; CC: climate change; FEx: freshwater ecotoxicity; FE: freshwater eutrophication; HTc: human toxicity – carcinogenics; HTnoc: human toxicity – non-carcinogenics; IRe: ionising radiation – ecosystems; IRh: Ionising radiaton – human health; ME: marine eutrophication; OD: ozone depletion; PM: particulate matter/respiratory inorganics; POF: photochemical ozone formation; RDm: resource depletion – mineral, fossils and renewables; RDw: resource depletion – water; TE: terrestrial eutrophication.
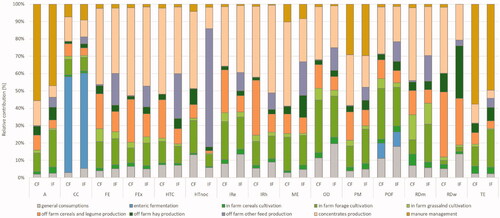
Analysing the results per process contribution, ‘concentrates production’ was the process with the higher impact in both farm types in 8 out of 15 impact categories (FE, FEx, HTc, HTnoc (only in CF), IRe, IRh, ME and RDm), with over 40% of the total impact in FE, FEx, HTc, HTnoc (only in CF), IRh (only in IF), ME (only in CF). ‘Concentrates production’ had also a remarkable impact on OD (27% on average between CF and IF) and on POF (24% on average between CF and IF). Enteric fermentation, that includes only methane emissions, was the main responsible for impact on CC (55%) while had a lower share on POF (9%). Averagely, ‘off farm cereals and legume production’ was responsible for 32% of impact in RDw, 32% and 25% (only in CF) in IRh and IRe, and 19% in FEx. ‘Off farm hay production’ has an overall low impact with exception of RDw in CF. ‘Off farm other feed production’ had higher impact only in IF in HTnoc (68%), in HTC (26%), in ME (19%) and in FE (18%). ‘On farm forage cultivation’ contributed to 27% of impact on OD, 26% in POF and 20% on IRe. ‘On farm grassland cultivation’ and ‘on farm cereal crop cultivation’ had generally a low impact, equal to 3% and 2% on average over all the impact categories. Manure management accounted on average for 54% in TE, 51% in A and 29% in PM, while showed very low contribution in all the other impact categories. General consumptions registered a low impact in all the impact categories (on average 7%), with higher values only in OD (15%) and POF (15%).
Analysing the results only for significant impact categories and farm type (Figures and ; raw data for Figure are reported in Table ), enteric fermentation was lower in IF than in CF (−44%) and contributed in both farm for 55% to the total CC impact. ‘Concentrates production’ (−61%) and ‘off farm cereals and legume production’ (−66%) had a lower impact on CC in IF than in CF. ‘Off farm other feed production’, ‘general consumptions’ and ‘off farm hay production’ and had a higher impact on CC in IF than in CF.
Figure 3. Principal component analysis for significant impact category and farm type (CF: conventional farm; IF: innovative farm). Impact category: CC: climate change; FE: freshwater eutrophication; IRe: ionising radiation – ecosystems; ME: marine eutrophication; OD: ozone depletion; PM: particulate matter/respiratory inorganics; POF: photochemical ozone formation; RDm: resource depletion – mineral, fossils and renewables.
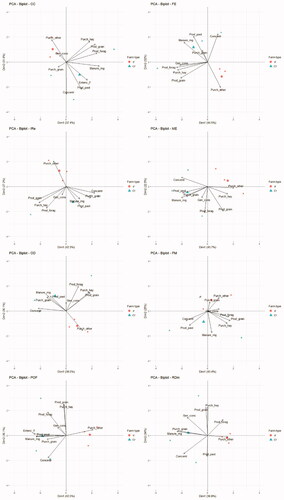
Figure 4. Contribution of processes to significant impact categories per farm type (CF: conventional farm; IF: innovative farm) (impact category unit ± standard error). Impact category: CC: climate change; FE: freshwater eutrophication; IRe: ionising radiation – ecosystems; ME: marine eutrophication; OD: ozone depletion; PM: particulate matter/respiratory inorganics; POF: photochemical ozone formation; RDm: resource depletion – mineral, fossils and renewables. Raw data are available in Table S5.
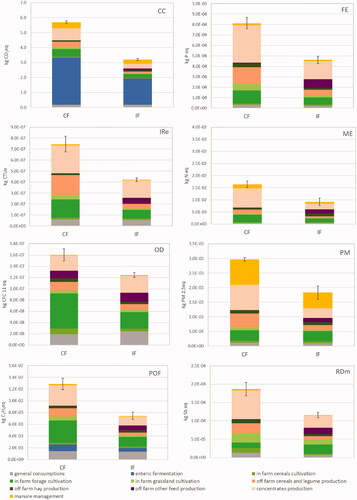
Table 5. Sheep category contribution to methane emissions from enteric fermentation of dairy sheep (number of days (d) considered for each sheep category is reported in brackets).
FE was higher in IF than CF only in the process ‘Off farm other feed production’ while it was lower for all the other processes, with a reduction up to 60% for ‘on farm grassland cultivation’ and ‘off farm cereals and legume production’. ‘Concentrates production’, the main process contributor, was 41% of total FE impact as average of farm type and showed a reduction in absolute values of 51% from CF to IF.
IRe was higher in IF than CF only for the process ‘off farm other feed production’. IRe was lower in IF than in CF in all the other processes, with a reduction up to 60% for ‘manure management’, ‘on farm grassland cultivation’ and ‘off farm other feed production’. ‘Concentrates production’, the main process contributor (on average 36% of total IRe impact), showed a reduction of 36% from CF to IF.
ME was higher in IF than in CF for the processes: ‘off farm cereals and legume production’, ‘off farm hay production’ and ‘off farm other feed production’. ME was lower in IF than in CF in all the other processes, with a reduction up to 70% for ‘concentrates production’, the main process contributor and ‘on farm forage cultivation’.
The main contributors to OD were ‘on farm forage cultivation’, ‘concentrates production’ and ‘general consumptions’. OD was higher in IF than CF for ‘generic consumptions’, ‘off farm other feed production’ and ‘concentrates production’. OD was lower in IF than in CF in the other processes with a reduction up to 50% for ‘on farm forage cultivation’ and ‘on farm cereal cultivation’.
The main contributors to PM were ‘Manure management’ and ‘concentrates production’. PM was higher in IF than CF only for ‘off farm other feed production’. In all the other processes, PM was lower in IF than in CF, with a reduction up to 60% for ‘concentrates production’, ‘on farm forage cultivation’ and ‘off farm cereals and legume production’. ‘Manure management’ registered a reduction of 37% from CF to IF in PM impact.
‘On farm forage cultivation’ and ‘concentrates production’ were the two processes contributed mainly to POF. POF was higher in IF than CF only for ‘off farm other feed production’. For all the other processes, POF was lower in IF than in CF, with a reduction up to 70% for ‘on farm grassland cultivation’ and up to 60% ‘off farm cereals and legume production’.
The main contributor to RDm was ‘concentrates production’, ‘on farm forage cultivation’ and ‘off farm other feed production’ that had higher impact in IF than in CF. All the other processes had lower impact on RDm in IF than in CF, in particular ‘on farm cereal cultivation’ and ‘off farm cereals and legume production’ had a reduction up to −60% from CF to IF.
Effect of innovative feeding strategy on methane emissions from enteric fermentation
Enteric methane emissions per kg FPCM were significantly lower in IC (1.76 ± 0.06 kg CO2eq kg−1 FPCM) than in CF (3.15 ± 0.12 kg CO2eq kg−1 FPCM) (p < .001).
No differences were observed in the annual methane emissions per head (as weighted average among all sheep categories) between CF and IF, equal on average between the two farm types to 14.63 ± 0.31 kg CH4 head−1 year−1, while significant differences were recorded considering animal category, with higher annual emissions for lactating ewe fed winter ration compared to lactating ewe fed summer ration, ewe lambs/replacement ewes and to dry ewe/rams (Table ). Detailed data for each farm type on methane emissions from enteric fermentation for sheep category, annual value for lactating ewes and annual value for sheep, as weighted average of all categories, are reported in Table .
Discussions
Precision feeding strategy produced in the dairy sheep system an overall reduction by 42% of the environmental impact of ewe milk, as an average reduction in the impact categories significantly different between IF and CF. The key factor of the lower environmental impacts of IF compared to CF is the increase of the efficiency of milk production in the innovative farms, being equal to +50% of annual milk production per ewe (165 kg FPCM ewe−1 year−1 and 246 kg FPCM ewe−1 year−1 in CF and IF, respectively) (Table ). Precision feeding influenced positively feed efficiency (kg of feed used per kg FPCM produced). Indeed, the DMI per lactating ewe, as average of winter and summer feed rations, was 4% higher in IF (Table ), while feed efficiency was 45% higher in IF lactating ewe (0.53 kg FPCM/kg DMI) than in CF (0.37 kg FPCM/kg DMI).
Overall, the lower impacts in IF compared to CF were due to a reduction of impacts from i) animal feeding (−30%, as average among impact categories), ii) farm general consumptions (−12%, as average among impact categories) and iii) manure management (−54%, as average among impact categories). However, specific effects for each impact category were identified.
Results for climate change were mainly affected by enteric methane emissions and feed production, as reported also in recent reviews on environmental performance of sheep farming by Bhatt and Abbassi (Citation2021) and Atzori et al. (Citation2017). The contribution of enteric fermentation in the total impact on climate change of ewe milk was 55% in both systems, in line with values reported for dairy sheep by Gerber, Steinfeld, et al. (Citation2013). In literature on dairy sheep, the contribution of enteric fermentation to CC varied from 78% in Sabia et al. (Citation2020), to 34% in Batalla et al. (Citation2015) and 45% in Vagnoni et al. (Citation2015). The value estimated in this study for annual enteric methane emissions of sheep (14.63 ± 0.31 kg CH4 head−1 year−1, as weighted average including all sheep categories) doubled the emission factor reported in the Italian GHG inventory (7.2 kg CH4 head−1 year−1) (ISPRA Citation2021). Indeed, this last value refers to a more extensive sheep farming, with much lower milk yields (about one-third) than those reported in this study.
The lower enteric methane emissions in IF were mainly due to the higher milk production efficiency. Indeed, when methane emissions per head were analysed, no difference was found between CF and IF. In this study, the addiction of lipids to the ration did not produce differences in estimated CH4 emissions from enteric fermentation between CF and IF. Indeed, even if a Tier 2 method was used to calculate the gross energy intake, also diet-specific Ym are needed to capture the effect of feed additives on rumen microbiota metabolism. Significant differences in enteric methane emissions per head were obtained only among animal categories, with the highest values for lactating ewe with winter ration. This is probably due to the presence of fresh forage in the summer diet and, as a consequence, to the higher digestibility of the structural carbohydrates. According to the NDS small ruminant model, the prediction of the energy digestibility (DE) of the ration varied according to the category of animals, being highest in the ration for lactating ewes (averaging 65 and 68% in CF and IF, respectively), lowest in dry ewes (averaging 58.6 and 61.5% in CF and IF, respectively) and intermediate for replacement animals (averaging 64.4 and 65.4% in CF and IF, respectively) (data not shown). On average, the DE of winter ration was lower than that of summer ration in CF (64.7 vs. 66.5%, for winter and summer ration, respectively), whereas the DE of the ration applied in the IF was very similar between winter and summer season (67.9 vs. 67.8%).
The climate change impact category was the only one for which it was possible to compare our results with other studies found in literature on dairy sheep farming. Our results in IF (3.21 kg CO2eq kg−1 FPCM) were in the range reported by Weiss and Leip (Citation2012) in a study at European scale that modelled the carbon footprint for milk ranging from 2.6 to 4.1 kg CO2eq kg−1 milk of sheep and goats, while CF showed higher values (5.71 kg CO2eq kg−1 FPCM). The values of CF are in agreement with values reported by Batalla et al. (Citation2015) in a semi-extensive Spanish sheep farm (5.17 kg CO2eq kg−1 FPCM), while they are higher than values reported for dairy sheep rearing by Escribano et al. (Citation2020), in semi-arid rangelands in Spain (1.77 − 4.09 kg CO2eq kg−1 of milk), in Sardinia, Italy by Vagnoni and Franca (Citation2018) (3.25 kg CO2-eq kg−1 FPCM) and by Vagnoni et al. (Citation2015), equal to 2.0–2.3 kg CO2eq kg−1 FPCM in three different farming systems. Calculation from values of milk and direct GHG emissions per ewe reported by Sintori et al. (Citation2019), referring to a dataset of 144 sheep farms located in Western Greece and Macedonia, and including only direct GHG emissions, produced an average result of 3.6 kg CO2eq per kg milk. In South Italy, Sabia et al. (Citation2020) found a CF equal to 3.78 kg CO2eq kg−1 FPCM, in farm where Merino sheep were fed with ration based only on fresh and preserved roughages. The higher values reported in this study could be due a more intensive input use in farming system compared to the semi-extensive systems found in Spain and in Sardinia. However, a clear comparison is not feasible since many aspects can affect the results at the same time, such as differences in system boundaries, methods for emission estimates, secondary data dataset, assumptions, input use and milk yields.
In this study, the second source of impact on climate change was feed production (34% in CF and 30% in IF), with impact of ‘off farm produced feed’ higher than ‘on farm produced feed’, both in CF (off farm 23% and on farm 12%) and in IF (off farm 20% and on farm 10%). Gerber, Steinfeld, et al. (Citation2013) reported a similar contribution from feed production as global average for milk produced by small ruminants (35%). ‘Off farm feed production’ was identified as the main contributor of feed production, especially in semi-intensive farms, also in Batalla et al. (Citation2015).
Feed production was the main contributor to all other significant impact categories and precision feeding produced changes in both on farm and off farm produced ration in IF. For freshwater eutrophication (FE) and marine eutrophication (ME), feed production was responsible of 93% in CF and 94% in IF of total FE impact and 87% of total ME impact. Impact of ‘off farm feed production’ was about 70% of the impact of feed production, and it was related to ‘concentrates production’ and ‘off farm cereal and legume production’. ‘On farm grassland production’ showed a decrease in IF of impact on FE and ME. Indeed, improved forage production in IF lowered the nitrogen and phosphorus fertiliser requirements, thanks to a higher presence of leguminous crops (sulla and alfalfa) than in CF.
Impact of feed production was the main contributor also for IRe (90% in CF and 86% in IF), mainly due to off farm feed production (61% in CF and IF). Decrease by 44% of total IRe impact in IF compared to CF is explained by a reduction impact of ‘concentrates production’, ‘on farm forage production’ and ‘off farm cereal and legume production’.
Results for RDm showed that feed production was responsible for 91% in CF and 93% in IF. Off farm feed production covered 62% in CF and 56% in IF. In IF, there was a decrease in impact for ‘concentrates production’, ‘on farm cereals and legume production’ and ‘off farm cereal and legume production’, while there was an increase in ‘on farm forage production’.
Feed production was responsible for 87 and 79% of impact on OD and 79 and 72% of impact on POF, for CF and IF, respectively. Impact of ‘On farm feed production’ on OD was higher than ‘off farm feed production’ in CF while ‘off farm feed production’ was higher in IF. On farm and off farm feed production had the same share in POF. Impact of OD and POF is also related to energy consumption, indeed in these two impact categories ‘general consumption’ had a higher share, increasing from CF to IF (12 and 20% on OD; 11 and 18% in POF), due to the higher impact of transport of input.
Impact of PM was linked to feed production (67% in CF and 65% in IF) and also to manure management (29% in CF and 30% in IF). It was not possible with the NDS Small Ruminant model to account for diet-specific nitrogen excretions, so impact reductions of manure management in IF (−37%), was mainly due to the higher production efficiency.
As reported by many recent papers, the introduction of legume crops in cropping systems can have positive environmental impacts, helping in reducing energy use, GHG emissions and N losses, and it can be pivotal for the sustainable intensification of forage production in drought-prone Mediterranean mixed crop-livestock systems (Annicchiarico Citation2017; Reckling et al. Citation2016; Nemecek et al. Citation2011, Citation2015).
Moreover, the increased self-production of protein-rich fodder in the farms had a consequent positive influence in reducing the amount of concentrates, widely recognised to be an important source of environmental impact, in particular climate change, due to the associated land use change for soybean-based feed production (Van Der Werf et al. Citation2005; Gerber, Hristov, et al. Citation2013). Indeed, in IF, the lower use of concentrate feed per mature ewe (−45%, from 156 to 85 kg of concentrate feed per mature ewe per year) reduced climate change, FE, ME and resource depletion. However, it is worth noting that there was an increase in the off farm feed production in IF, indeed self-sufficiency decreased from 59 to 50% from CF to IF. The lower share of concentrates was replaced in IF by a higher share of ‘off farm cereals and legume production’ coming from the same area of the farms, thus having a lower impact linked to the transport to farm (−45%), compared to concentrate feed. Quite low use of co-products for animal feeding was observed in both farm types, with exception of beet pulps.
Impacts for all impact categories were higher in CF than in IF, with the exception of human toxicity non cancer (HTnc). Indeed, HTnc was higher in IF than CF, even if not statistically significant, due to ‘off farm other feed production’, in particular to silage maize cultivation, which includes higher use of pesticides compared to other crops.
However, the results of all significant indicators, except for climate change, showed a quite high variability, as consequence of the low number of farms included in the study (Figure ).
Increasing soil carbon sequestration has been identified as a mitigation option in the livestock sector, especially in extensive farms and in grazed livestock production systems (Soussana et al. Citation2010; FAO Citation2018). However, soil carbon sequestration was not included in this study, since small differences in agricultural practices for cereals and forage production were observed between CF and IF. The partial replacement of oat-clover ley with 2- or 4-year forage crops in IF may increase carbon sequestration (Sarkar et al. Citation2020), nevertheless it is not possible to estimate easily this potential carbon sequestration without running a specific soil model or using measured data in a long-term study. Moreover, in both farm type there was no use of permanent grasslands, awarded to play an important role as carbon sinks and as mitigation strategy for sheep rearing (Batalla et al. Citation2015; O’Brien et al. Citation2016; Marino et al. Citation2016; Escribano et al. Citation2020).
As general remark, results of this study were in agreement with the outcomes of several studies testing various strategies to reduce the environmental impact and the use of resources of livestock systems adopting new farm management, showing that sustainable intensification can improve the environmental performances, while increasing the production (Marino et al. Citation2016; O’Brien et al. Citation2016). Overall, even if our study highlighted quite clearly a lower environmental impact of IF than CF, it has to be underlined that since agricultural processes (both crop yields and livestock productivity) are highly susceptible to year-to-year variations in weather patterns, these results need to be confirmed on a longer time frame, accounting also for the variability of environmental conditions.
Conclusions
Precision feeding in dairy sheep farming improved milk production efficiency by 50% and lowered environmental impacts of ewe milk as kg FPCM by 42%, as average of the impact categories being significantly different between IF and CF, that were climate change, freshwater eutrophication, ionising radiation – ecosystems, marine eutrophication, ozone depletion, particulate matter, photochemical ozone formation and resource depletion mineral. Enteric fermentation for climate change and feed production for all impact categories were the main responsibles of environmental impact.
Overall, the reduction of environmental impacts of ewe milk was obtained mainly increasing farm productivity with the use of more balanced rations, taking into account nutrients concentration both in concentrate supplement and in fresh fodder. In this sense, the use feeding models, such as CNCPS, can help in making the most appropriate choices. Furthermore, it was essential to increase the availability of green forage by widening the time window with the introduction of multi-annual species. The combination of these two strategies guarantees a better production response and, ultimately, a lower impact of emissions per kg of product.
Supplemental Material
Download MS Word (85 KB)Acknowledgements
The authors would like to thank the anonymous reviewers for their suggestions and comments. The authors gratefully acknowledge dairy sheep farmers and people from the ‘Caseificio Sociale Manciano’ cheese factory for their participation in this study, and for providing us extensive information about their production systems.
Disclosure statement
No potential conflict of interest was reported by the author(s).
Data availability statement
Most of the data supporting the findings of this study are available within the article and its supplementary materials. Other data not included there are available from the corresponding author, S. Bosco, upon reasonable request.
Additional information
Funding
References
- Annicchiarico P. 2017. Feed legumes for truly sustainable crop-animal systems. Ital J Agronomy. 12(2):151–160.
- ANZ. 2018. Anagrafe nazionale Zootecnica. http://statistiche.izs.it.
- Arriaga H, Pinto M, Calsamiglia S, Merino P. 2009. Nutritional and management strategies on nitrogen and phosphorus use efficiency of lactating dairy cattle on commercial farms: an environmental perspective. J Dairy Sci. 92(1):204–215.
- Atzori AS, Molle G, Decandia M, Vagnoni E, Sanna L, Arca P, Duce P, Franca A, Porqueddu C. 2017. Review on LCA approaches and GHG mitigation actions in sheep supply chain. Report of EU LIFE project “Sheep to Ship” LIFE15 CCM/IT/000123. http://www.sheeptoship.eu/images/Report/A.2.1_Review_LCA_studies.pdf.
- Baldini C, Gardoni D, Guarino M. 2017. A critical review of the recent evolution of Life Cycle Assessment applied to milk production. J Clean Prod. 140:421–435.
- Batalla I, Knudsen MT, Mogensen L, del Hierro Ó, Pinto M, Hermansen JE. 2015. Carbon footprint of milk from sheep farming systems in Northern Spain including soil carbon sequestration in grasslands. J Clean Prod. 104:121–129.
- Berckmans D. 2017. General introduction to precision livestock farming. Anim Front. 7(1):6–11.
- Bhatt A, Abbassi B. 2021. Review of environmental performance of sheep farming using life cycle assessment. J Clean Prod. 293:126192.
- Buccioni A, Serra A, Minieri S, Mannelli F, Cappucci A, Benvenuti D, Rapaccini S, Conte G, Mele M. 2015. Milk production, composition, and milk fatty acid profile from grazing sheep fed diets supplemented with chestnut tannin extract and extruded linseed. Small Ruminant Res. 130:200–207.
- Cannas A, Tedeschi LO, Atzori AS, Lunesu MF. 2019. How can nutrition models increase the production efficiency of sheep and goat operations? Anim Front. 9(2):33–44.
- Cannas A, Tedeschi LO, Fox DG, Pell AN, Van Soest PJ. 2004. A mechanistic model for predicting the nutrient requirements and feed biological values for sheep. J Anim Sci. 82(1):149–169.
- Chilliard Y, Glasser F, Ferlay A, Bernard L, Rouel J, Doreau M. 2007. Diet, rumen biohydrogenation and nutritional quality of cow and goat milk fat. Eur J Lipid Sci Technol. 109(8):828–855.
- Cederberg C, Mattsson B. 2000. Life cycle assessment of milk production - a comparison of conventional and organic farming. J Clean Prod. 8(1):49–60.
- Colomb V, Ait SA, Mens CB, Gac A, Gaillard G, Koch P, Mousset J, Salou T, Tailleur A, van der Werf HMG. 2015. AGRIBALYSE®, the French LCI Database for agricultural products: high quality data for producers and environmental labelling. OCL - Oilseeds Fats. 22(1):D104.
- de Rancourt M, Carrère L. 2011. Milk sheep production systems in Europe: diversity and main trends. In: Bernués A, Boutonnet JP, Casasús I, Chentouf M, Gabiña D, Joy M, López-Francos A, Morand-Fehr P, Pacheco F, editors. Economic, social and environmental sustainability in sheep and goat production systems. Zaragoza, Spain: CIHEAM/FAO/CITA- DGA; p. 107–111.
- de Vries M, de Boer IJM. 2010. Comparing environmental impacts for livestock products: A review of life cycle assessments. Livest Sci. 128(1–3):1–11.
- EPD 2016. Arable crops (2013:05 v. 2.0). Product category classification: UN CPC 011, 014, 017, 019. Available online at: https://test1.environdec.com/PCR/Detail/?Pcr=8804.
- Ershadi SZ, Dias G, Heidari MD, Pelletier N. 2020. Improving nitrogen use efficiency in crop-livestock systems: A review of mitigation technologies and management strategies, and their potential applicability for egg supply chains. J Clean Prod. 265:121671.
- Escribano M, Elghannam A, Mesias FJ. 2020. Dairy sheep farms in semi-arid rangelands: a carbon footprint dilemma between intensification and land-based grazing. Land Use Policy. 95:104600.
- European Dairy Association. 2018. Product environmental footprint category rules for dairy products. Brussels, Belgium: European Dairy Association.
- FAO. 2016b. Environmental performance of animal feeds supply chains: guidelines for assessment. Livestock environmental assessment and performance partnership. Rome, Italy: FAO. http://www.fao.org/3/a-mj751e.pdf.
- FAO. 2018. Measuring and modelling soil carbon stocks and stock changes in livestock production systems. Rome. http://www.fao.org/3/I9693EN/i9693en.pdf.
- FAO. 2016a. Greenhouse gas emissions and fossil energy use from small ruminant supply chains: guidelines for assessment. Livestock environmental assessment and performance partnership. Rome, Italy: FAO. http://www.fao.org/3/a-i6434e.pdf.
- FAOSTAT. 2021. Livestock primary statistics. (accessed 2021 July 20). http://www.fao.org/faostat/en/#data/QL.
- Frischknecht R, Braunschweig A, Hofstetter P, Suter P. 2000. Modelling human health effects of radioactive releases in Life Cycle Impact Assessment. Environ. Impact Assess. 20(2):159–189.
- Frischknecht R, Steiner R, Jungbluth N. 2008. The Ecological Scarcity Method – EcoFactors 2006. A method for impact assessment in LCA. Environmental studies no. 0906. Federal Office for the Environment (FOEN), Bern.
- Garnier-Laplace JC, Beaugelin-Seiller K, Gilbin R, Della-Vedova C, Jolliet O, Payet J. 2008. A Screening Level Ecological Risk Assessment and ranking method for liquid radioactive and chemical mixtures released by nuclear facilities under normal operating conditions. Proceedings of the International conference on radioecology and environmental protection, 15-20 june 2008, Bergen.
- Gerber PJ, Hristov AN, Henderson B, Makkar H, Oh J, Lee C, Meinen R, Montes F, Ott T, Firkins J, et al. 2013. Technical options for the mitigation of direct methane and nitrous oxide emissions from livestock: a review. Animal. 7(2):220–234.
- Gerber PJ, Steinfeld H, Henderson B, Mottet A, Opio C, Dijkman J, Falcucci A, Tempio G. 2013a. Tackling climate change through livestock – A global assessment of emissions and mitigation opportunities. Rome, Italy: FAO.
- Gonzalez LA, Kyriazakis I, Tedeschi LO. 2018. Review: precision nutrition of ruminants: approaches, challenges and potential gains. Animal. 12(s2):s246–S261.
- Greco SL, Wilson AM, Spengler JD, Levy JI. 2007. Spatial patterns of mobile source particulate matter emissions-to-exposure relationships across the United States. Atmos. Environ. 41(5):1011–1025.
- Guinée JB, Gorrée M, Heijungs R, Huppes G, Kleijn R, de Koning A, Van Oers L, Wegener Sleeswijk A, Suh S, Udo de Haes HA, et al. 2002. Handbook on Life Cycle Assessment: Operational Guide to the ISO Standards. Series: Eco-efficiency in industry and science. Kluwer Academic Publishers, Dordrecht.
- Henderson B, Falcucci A, Mottet A, Early L, Werner B, Steinfeld H, Gerber P. 2017. Marginal costs of abating greenhouse gases in the global ruminant livestock sector. Mitig Adapt Strateg Glob Change. 22(1):199–224.
- Humbert S. 2009. Geographically Differentiated Life-cycle Impact Assessment of Human Health [Doctoral dissertation]. Berkeley, California, USA: University of California.
- IPCC. 2006. Vol 4 Agriculture, Forestry and Other Land Use, chapters 10 and 11. In: IPCC, Eggleston HS, Buendia L, Miwa K, Ngara T, Tanabe K, editors. Guidelines for national greenhouse gas inventories, prepared by the national green- house gas inventories programme. Japan: IGES.
- IPCC 2013. Climate Change 2013: The Physical Science Basis. Contribution of Working Group I to the Fifth Assessment Report of the Intergovernmental Panel on Climate Change. Cambridge, United Kingdom and New York, NY, USA, p. 1535.
- ISO 14040. 2006. Environmental management – life cycle assessment – principles and framework. Geneva, Switzerland: International Standards Organization.
- ISO 14044. 2006. Environmental management – life cycle assessment − requirements and guidelines. Geneva, Switzerland: International Standards Organization.
- ISPRA, 2021. Italian greenhouse gas inventory 1990–2019. National inventory report 2021. Rapporto 341/2021, Roma. https://www.isprambiente.gov.it/it/pubblicazioni/rapporti/italian-greenhouse-gas-inventory-1990-2019-national-inventory-report-2021.
- ISTAT, 2010. Italian national census for agriculture, Roma. https://www.istat.it/it/censimenti-permanenti/censimenti-precedenti/agricoltura/agricoltura-2010.
- ISTAT, 2017. Agricoltura e zootecnia. (accessed 2017 January 22). http://www.istat.it.
- Leip A, Billen G, Garnier J, Grizzetti B, Lassaletta L, Reis S, Simpson D, Sutton MA, de Vries W, Weiss F, et al. 2015. Impacts of European livestock production: nitrogen, sulphur, phosphorus and greenhouse gas emissions, land-use, water eutrophication and biodiversity. Environ Res Lett. 10(11):115004.
- Lima PR, Apdini T, Freire AS, Santana AS, Moura LML, Nascimento JCS, Rodrigues RTS, Dijkstra J, Garcez Neto AF, Queiroz MAÁ, et al. 2019. Dietary supplementation with tannin and soybean oil on intake, digestibility, feeding behavior, ruminal protozoa and methane emission in sheep. Anim Feed Sci Technol. 249:10–17.
- Lovarelli D, Bacenetti J, Guarino M. 2020. A review on dairy cattle farming: is precision livestock farming the compromise for an environmental, economic and social sustainable production? J Clean Prod. 262:121409.
- Marino R, Atzori AS, D'Andrea M, Iovane G, Trabalza-Marinucci M, Rinaldi L. 2016. Climate change: Production performance, health issues, greenhouse gas emissions and mitigation strategies in sheep and goat farming. Small Ruminant Res. 135:50–59.
- Masoni A, Lulli L, Mariotti, M, Cisternino A. 2010. Piano di concimazione per le colture erbacee di pieno campo. In: Felici, editor. Riduzione dell’inquinamento delle acque dai nitrati provenienti dall’agricoltura. 267–315, Pisa, Italy.
- McClelland SC, Arndt C, Gordon DR, Thoma G. 2018. Type and number of environmental impact categories used in livestock life cycle assessment: a systematic review. Livest Sci 209:39–45.
- Mele M, Contarini G, Cercaci L, Serra A, Buccioni A, Povolo M, Conte G, Funaro A, Banni S, Lercker G, et al. 2011. Enrichment of Pecorino cheese with conjugated linoleic acid by feeding dairy ewes with extruded linseed: effect on fatty acid and triglycerides composition and on oxidative stability. Int Dairy J. 21(5):365–372.
- Morgan-Davies C, Lambe N, Wishart H, Waterhouse T, Kenyon F, McBean D, McCracken D. 2018. Impacts of using a precision livestock system targeted approach in mountain sheep flocks. Livest Sci. 208:67–76.
- Nemecek T, Hayer F, Bonnin E, Carrouée B, Schneider A, Vivier C. 2015. Designing eco-efficient crop rotations using life cycle assessment of crop combinations. Eur J Agron. 65:40–51.
- Nemecek T, Huguenin-Elie O, Dubois D, Gaillard G, Schaller B, Chervet A. 2011. Life cycle assessment of Swiss farming systems: II. Extensive and intensive production. Agr Syst. 104(3):233–245.
- O’Brien D, Bohan A, McHugh N, Shalloo L. 2016. A life cycle assessment of the effect of intensification on the environmental impacts and resource use of grass-based sheep farming. Agr Syst. 148:95–104.
- Odintsov Vaintrub M, Levit H, Chincarini M, Fusaro I, Giammarco M, Vignola G. 2021. Review: precision livestock farming, automats and new technologies: possible applications in extensive dairy sheep farming. Animal. 15(3):100143.
- Oers van L, de Koning A, Guinee JB, Huppes G. 2002. Abiotic Resource Depletion in LCA. Improving characterization factors for abiotic resource depletion as recommended in the new Dutch LCA Handbook. Road and Hydraulic Engineering Institute, Ministry of Transport and Water, Amsterdam.
- Patra AK. 2014. A meta-analysis of the effect of dietary fat on enteric methane production, digestibility and rumen fermentation in sheep, and a comparison of these responses between cattle and sheep. Livest Sci. 162:97–103.
- Posch M, Seppälä J, Hettelingh JP, Johansson M, Margni M, Jolliet O. 2008. The role of atmospheric dispersion models and ecosystem sensitivity in the determination of characterisation factors for acidifying and eutrophying emissions in LCIA. Int J Life Cycle Assess. 13(6):477–486.
- Pulina G, Francesconi AHD, Stefanon B, Sevi A, Calamari L, Lacetera N, Dell’Orto V, Pilla F, Ajmone Marsan P, Mele M, et al. 2017. Sustainable ruminant production to help feed the planet. Ital J Anim Sci. 16(1):140–171.
- Pulina G, Milán MJ, Lavín MP, Theodoridis A, Morin E, Capote J, Thomas DL, Francesconi AHD, Caja G. 2018. Invited review: current production trends, farm structures, and economics of the dairy sheep and goat sectors. J Dairy Sci. 101(8):6715–6729.
- Pulina G, Nudda A. 2002. Milk production. In: Pulina G, editor. Dairy sheep fedding and nutrition. Bologna, Italy: Avenue Media; p. 11–13.
- Rabl A, Spadaro JV. 2004. The RiskPoll software, version is 1.051 (dated August 2004). www.arirabl.com.
- R Core Team. 2018. R: a language and environment for statistical computing. Vienna, Austria: Foundation for Statistical Computing. https://www.R-project.org/.
- Reckling M, Bergkvist G, Watson CA, Stoddard FL, Zander PM, Walker RL, Pristeri A, Toncea I, Bachinger J. 2016. Trade-offs between economic and environmental impacts of introducing legumes into cropping systems. Front Plant Sci. 7:615–669.
- Regione Toscana. 2020. Regional hydrological and geological sector, 2020. https://www.sir.toscana.it/consistenza-rete.
- Rosenbaum RK, Bachmann TM, Gold LS, Huijbregts MAJ, Jolliet O, Juraske R, Koehler A, Larsen HF, MacLeod M, Margni M, et al. 2008. USEtox - The UNEP-SETAC toxicity model: recommended characterization factors for human toxicity and freshwater ecotoxicity in Life Cycle Impact Assessment. Int J Life Cycle Assess. 13(7):532–546.
- Sabia E, Gauly M, Napolitano F, Serrapica F, Cifuni GF, Claps S. 2020. Dairy sheep carbon footprint and ReCiPe end-point study. Small Rumin Res 185:106085.
- Sarkar R, Corriher-Olson V, Long C, Somenahally A. 2020. Challenges and potentials for soil organic carbon sequestration in forage and grazing systems. Rangeland Ecol Manage. 73(6):786–795.
- Seppälä J, Posch M, Johansson M, Hettelingh JP. 2006. Country-dependent Characterization factors for Acidification and Terrestrial Eutrophication Based on Accumulated Exceedance as an Impact Category Indicator. Int J Life Cycle Assessment. 11(6):403–416.
- Sintori A, Liontakis A, Tzouramani I. 2019. Assessing the environmental efficiency of Greek dairy sheep farms: GHG emissions and mitigation potential. Agriculture (Switzerland). 9(2):28.
- Soussana JF, Tallec T, Blanfort V. 2010. Mitigating the greenhouse gas balance of ruminant production systems through carbon sequestration in grasslands. Animal. 4(3):334–350.
- Struijs J, Beusen A, van Jaarsveld H, Huijbregts MAJ. 2009. Aquatic Eutrophication. Chapter 6 in: Goedkoop, M., Heijungs, R., Huijbregts, M.A.J., De Schryver, A., Struijs, J., Van Zelm, R. (2009) ReCiPe 2008 A life cycle impact assessment method which comprises harmonised category indicators at the midpoint and the endpoint level. Report I: Characterization factors, first edition, The Hague.
- Uwizeye A, Gerber PJ, Schulte RPO, De Boer IJM. 2016. A comprehensive framework to assess the sustainability of nutrient use in global livestock supply chains. J Clean Prod. 129:647–658.
- Vagnoni E, Franca A. 2018. Transition among different production systems in a Sardinian dairy sheep farm: environmental implications. Small Rumin Res. 159:62–68.
- Vagnoni E, Franca A, Breedveld L, Porqueddu C, Ferrara R, Duce P. 2015. Environmental performances of Sardinian dairy sheep production systems at different input levels. Sci Total Environ. 502:354–361.
- Van Der Werf HMG, Petit J, Sanders J. 2005. The environmental impacts of the production of concentrated feed: the case of pig feed in Bretagne. Agr Syst. 83(2):153–177.
- Vargas-Bello-Pérez E, Darabighane B, Miccoli FE, Gómez-Cortés P, Gonzalez-Ronquillo M, Mele M. 2021. Effect of dietary vegetable sources rich in unsaturated fatty acids on milk production, composition, and cheese fatty acid profile in sheep: a meta-analysis. Front Vet Sci. 8: 641364.
- Vasta V, Daghio M, Cappucci A, Buccioni A, Serra A, Viti C, Mele M. 2019. Invited review: plant polyphenols and rumen microbiota responsible for fatty acid biohydrogenation, fiber digestion, and methane emission: experimental evidence and methodological approaches. J Dairy Sci. 102(5):3781–3804.
- Wathes CM, Kristensen HH, Aerts JM, Berckmans D. 2008. Is precision livestock farming an engineer’s daydream or nightmare, an animal’s friend or foe, and a farmer’s panacea or pitfall? Comput Electron Agr. 64(1):2–10.
- Weiss F, Leip A. 2012. Greenhouse gas emissions from the EU livestock sector: a life cycle assessment carried out with the CAPRI model. Agric Ecosyst Environ. 149:124–134.
- Wilfart A, Espagnol S, Dauguet S, Tailleur A, Gac A, Garcia-Launay F. 2016. ECOALIM: a dataset of environmental impacts of feed ingredients used in French animal production. PLoS One. 11(12):e0167343–17.
- WMO 1999. Scientific Assessment of Ozone Depletion: 1998. Global Ozone Research and Monitoring Project - Report No. 44, Geneva.
- Wolf MA, Pant R, Chomkhamsri K, Sala S, Pennington D. 2012. International reference life cycle data system (ILCD) handbook – towards more sustainable production and consumption for a resource-efficient Europe. Luxembourg: European Commission – Joint Research Centre Publications Office of the European Union. JRC reference report, EUR 24982 EN.
- Zuidhof MJ. 2020. Precision livestock feeding: matching nutrient supply with nutrient requirements of individual animals. J Appl Poult Res. 29(1):11–14.