
 ?Mathematical formulae have been encoded as MathML and are displayed in this HTML version using MathJax in order to improve their display. Uncheck the box to turn MathJax off. This feature requires Javascript. Click on a formula to zoom.
Abstract
This study investigated the effects of developmental stage and store time on the chemical composition, microbial community, co-occurrence networks and fermentation characteristics of sweet sorghum silage. Sweet sorghum harvested at two developmental stages (heading stage, S1; hard dough stage, S2) was treated as follows: (I) natural fermentation of S1 (NS1); (II) natural fermentation of S2 (NS2) and ensiled for 1, 3, 7, 15, 30 and 60 days. After 60 days of ensiling, NS2 silage had higher lactic acid concentration and the ratio of lactic to acetic acid, and lower pH value and acetic acid concentration than NS1 silage. Meanwhile, NS2 silage also had higher ammonia nitrogen (NH3-N) content than NS1 silage, but the NH3-N content of both treatments was lower than 100 g/kg TN. Leuconostoc and Lactococcus were respectively dominant in both 7-day NS1 and NS2 silages, while Lactobacillus was the most abundant genus in 30-day NS1 and NS2 silages. The developmental stage altered the bacterial co-occurrence networks of fresh and ensiled sweet sorghum. Spearman’s correlation heatmap showed that the higher lactic acid content and ratio of lactic to acetic acid in NS2 silage could be associated with the higher water-soluble carbohydrate content in S2 material, the higher abundance of Lactococcus in the initial phase of ensiling and the higher abundance of Lactobacillus in the late phase of ensiling. These results concluded that the sweet sorghum harvested at the hard dough stage is preferred for silage production over the sweet sorghum harvested at the heading stage.
Microbial succession pattern was studied on fresh and ensiled samples.
Growth stage affected the chemical and microbial parameters of sweet sorghum.
Epiphytic microbiota was correlated with the chemical composition of forage.
Metagenomic sequencing showed Lactobacillus was dominated in all silages.
Growth stage accelerated the fermentation of sweet sorghum silage.
HIGHLIGHTS
Introduction
Sweet sorghum (Sorghum bicolour (L.) Moench), a perennial economic crop belonging to the genus Sorghum of Gramineae, is native to eastern Africa (Doggett Citation1988) and has now grown in more than 100 countries due to its characteristics in terms of high light, nitrogen and water use efficiency and large biomass yield. As a typical C4 plant, its photosynthetic efficiency is 2-3 times higher than that of sugar beet and wheat. Bassam and Jakob (Citation1997) reported that sweet sorghum can be mowed 3-4 times per year and produce 160 tons of aboveground biomass per hectare for each mowing. Sweet sorghum has strong resistance to waterlogging, drought, high temperature, salinity and barren, so it is suitable for planting in humid, semi-humid, semi-arid and arid regions of tropical, subtropical and temperate zones. So, it is not only called ‘the camel among crops’ but also known as ‘a promising alternative forage to maize’. And now, sweet sorghum is the main silage material in semi-arid, arid and high salinity, and is increasingly becoming the world’s most important silage crop after maize (Zhang et al. Citation2015). Despite these advantages, the current challenge for forage sorghum silage production and utilisation should not be ignored. These include insufficient crude protein content (<80 g/kg dry matter (DM), Chen et al. Citation2018), high post-harvest sugar loss (up to 50%, Schmidt et al. Citation1997), lower protein and starch digestibility than maize silage (Mutegi et al. Citation2010) and the undesirable aerobic stability (Ferrero et al. Citation2019). Most importantly, the stereotypes about the ‘low nutritional value’ of sorghum relative to maize among forage producers and breeders hamper the further promotion of sweet sorghum silage production in agricultural practice. Thus, feed manufacturers and animal scientists need to carry out a series of trials to show the true feeding value of sorghum silage (Ronda et al. Citation2019).
Different from the complete and comprehensive silage study of forage sorghum and sorghum grain, the current research on sweet sorghum silage is limited and mainly focuses on the selection and effectiveness of additives on fermentation quality, especially on aerobic stability and nutrient digestibility. Similar to maize, sweet sorghum can be well-fermented without additives (McDonald et al. Citation1991; Zhao et al. Citation2021). But it should note that the fermentation quality can be greatly different when the silage was produced from the sweet sorghum harvested at different developmental stages. Oliveira et al. (Citation2020) and Toruk et al. (Citation2010) have shown that the developmental stage (or harvest timing) of forage is the main factor determining the nutritional value and fermentation quality of silage. The proper harvest timing of forage for silage is always the compromise between the optimised nutritional quality and the maximised yield (Beck et al. Citation2013). It is generally recommended to ensile forage sorghum during the ripe stage, but De Brouwer et al. (Citation1991) pointed out that forage sorghum silage made at this stage predicted little more than fulfilling the maintenance needs of animals. Differently, McCullough (Citation1989) indicated that to obtain a higher feeding value, forage sorghum should be ensiled before the heading or no later than the bloom stage. However, forage sorghum at the heading to bloom stage has high moisture content and may lead to undesirable fermentation. Thus, to obtain high-quality silage, sweet sorghum should be harvested for ensiling at the appropriate developmental stage. Although the studies on the optimal developmental stage of forage sorghum are numerous, to our knowledge, no study has evaluated the effects of the developmental stage and ensiling day on sweet sorghum silage.
With the popularisation of culture-independent analyses, high-throughput sequencing technology has enabled us to explore the microbial population shifts involved in the growing and ensiling process, and to mine more crucial biological information (McAllister et al. Citation2018). Therefore, this study aimed to investigate the effects of the developmental stage and ensiling day on the fermentation characteristics, microbial community and co-occurrence networks of sweet sorghum silage. The obtained results may, therefore, provide a reference for improving the fermentation quality of sweet sorghum silage without increasing cost.
Materials and methods
Experimental materials
Sweet sorghum was seeded in Jianghuai Watershed Experimental Station of Anhui Agricultural University (32.57°N, 117.50°E, altitude 70.3 m, annual average temperature 21.0 °C, annual average precipitation 1036 mm) on 30 June 2020, under the same tillage, irrigation and fertilisation management. The experimental field was divided into three equal blocks (10 m2 per block) as replications for each treatment. Each block was split into two plots and randomly assigned to two developmental stages. After 12 weeks of planting, half of the plots were harvested on 28 August 2020, and the remaining plots were harvested 5 weeks later, on 2 October 2020, to obtain two developmental stages of sweet sorghum (heading stage, S1; hard dough stage, S2). The harvest time was in the morning with clear weather, and the stubble height was about 15 cm. Fresh sweet sorghum was chopped into about 2 cm lengths by a feed chopper, immediately. For each developmental stage, the chopped material was mixed thoroughly and divided into two batches for silage preparation and fresh sample analysis, respectively.
Silage preparation
A total of 36 bags (2 treatments × 6 ensiling days × 3 replicates per treatment) were prepared and the treatments were set as follows: (I) natural fermentation of S1 (NS1) and (II) natural fermentation of S2 (NS2). Specifically, after thorough mixing, about 450 g of chopped material was packed into each pre-sterilised polyethylene plastic bag, vacuum-sealed by a sealing machine (DZD-400, Aomitai Technology Co., Ltd., Nanjing, China) and stored at environmental temperature (27.5 ± 2.5 °C) for 1, 3, 7, 15, 30 and 60 days of ensiling. Triplicate bags per treatment were opened and sampled for the following analyses.
Chemical composition and microbial population analyses
At sampling, fresh or ensiled samples were loaded into an ethanol-sterilised container, mixed thoroughly and split into three subsamples. The first subsample was oven-dried at 105 °C for 15 min (deactivation of enzymes) and 65 °C for 48 h to constant weight for DM determination. Then the dried samples were ground by a laboratory knife mill (FW100, Taisite Instrument Co., Ltd., Tianjin, China) to pass through a 1-mm screen for WSC, neutral detergent fibre (NDF), acid detergent fibre (ADF) and total nitrogen (TN) analyses. The WSC content was determined by the anthrone-sulfuric acid method of Thomas (Citation1977). The NDF and ADF content of fresh samples were determined by the methods of Van Soest et al. (Citation1991) with a fibre analyser (Ankom 200, Ankom Technology, Macedon, NY, USA). The TN content was analysed by a Kjeldahl nitrogen analyser (Kjeltec 8200, Foss Analytics, Höganäs, Sweden), and then multiplied by 6.25 to calculate crude protein (CP) content.
The second subsample was mixed with deionised water at a ratio of 1:3 and extracted at 4 °C for 24 h (Dong et al. Citation2020). After filtration with 4 layers of gauze and Whatman filter paper No. 1, the pH of the filtrate was immediately determined by a glass electrode pH metre (HI 2221, Hanna Instruments, Inc., Woonsocket, RI, USA). The concentration of ammonia nitrogen (NH3-N) was determined by the phenol-hypochlorite method of Broderick and Kang (Citation1980) on a microplate spectrophotometer (Multiskan Sky, Thermo Scientific, Wilmington, USA) and expressed on a TN basis. The concentration of organic acids including lactic acid (LA), acetic acid (AA), propionic acid (PA) and butyric acid (BA) was quantified by the HPLC system (Agilent 1260 Infinity, Agilent Technologies, Inc., Waldbronn, Germany) as described in our previous study (Zhao et al. Citation2018). The buffering capacity (BC) of fresh samples was measured using the titration method of Playne and McDonald (Citation1966).
The third subsample was homogenised with autoclaved saline solution (0.85% NaCl) at a ratio of 1:9 and shaken at 37 °C, 120 rpm for 2 h. Then 1 mL above solution was 10-fold serially diluted for microbial counting, and the rest solution was filtered with 2 layers of sterile gauze for subsequent bacterial DNA extraction. The LAB, aerobic bacteria, yeasts, moulds and enterobacteria were counted by culture-based methods using selective media (Zhao et al. Citation2022). Specifically, LABs were counted on de Man, Rogosa and Sharp agar medium after anaerobic incubation at 37 °C for 72 h. Aerobic bacteria were counted on a nutrient agar medium after aerobic incubation at 37 °C for 48 h. Yeasts and moulds were respectively counted on potato dextrose agar medium after aerobic incubation at 30 °C for 48 h. Enterobacteria were counted on violet red bile glucose agar medium after aerobic incubation at 37 °C for 24 h. The microbial population was transformed to a logarithmic scale in the form of colony-forming units (CFU) and expressed on a fresh weight (FW) basis.
High-throughput sequencing analysis
The bacterial DNA extraction and polymerase chain reaction (PCR) amplification were conducted according to the procedures reported by Zhao et al. (Citation2022). The purified amplicons were paired-end sequenced using the Illumina sequencing platform (MiSeq PE300, Illumina Inc., San Diego, CA, USA). All raw reads were processed using FLASH (version 1.2.11) and the low-quality sequences with quality scores less than 20 were filtered out using QIIME (version 1.9.1). After removing chimeric sequences by the UCHIME algorithm, the qualified reads with 97% identities were clustered into operational taxonomic units (OTUs) through UPARSE (version 7.0). The OTUs were classified using the RDP classifier (version 2.11) based on the SILVA database (version 132) with a confidence threshold of 70%, and they were denominated at the phylum and genus levels. Alpha diversity including Chao1, Shannon and Coverage indexes as well as beta diversity presented by the Bray–Curtis metric were calculated in QIIME software. Nonmetric multidimensional scaling (NMDS) plot was constructed to visualise the Bray–Curtis distance metric using the Vegan package of R (version 4.0.5). Spearman correlation heatmap was applied to visualise the relationships between chemical composition and epiphytic microbiota (fresh samples) as well as fermentation parameters and bacterial community (ensiled samples) using the Pheatmap package of R.
Co-occurrence network analysis
The co-occurrence pattern was constructed by calculating multiple abundance correlations based on a genus-level matrix using the Networkx toolkit (version 2.6.3). Only genera of relative abundance >0.05% were considered. If Spearman correlation coefficient (ρ) >0.50 and p < 0.05, co-occurrence is considered to be robust. The co-occurrence networks are visualised using the interactive platform Gephi (version 0.9.2). Nodes represent individual bacterial genera, and edges represent the pairwise correlation between nodes in the bacterial network. The calculated topological characteristics of bacterial networks include positive (co-occurrence) and negative (mutually exclusive) correlation numbers, network diameter, average clustering coefficient, etc.
Statistical analysis
The effects of the developmental stage, ensiling day and their interactions on fermentation characteristics, chemical composition, microbial population and alpha diversity indexes of silages were investigated using GLM of SAS (version 9.2; SAS Institute Inc., Cary, NC) according to the model as follows:
where Yij is the dependent variable; μ is the overall mean; Ti is the effect of developmental stage (i = 2, PA vs. PB); Dj is the effect of the ensiling day (j = 6, 1, 3, 7, 15, 30 and 60); (T × D)ij are the interaction effects of developmental stage and ensiling day; and eijk is the residual error. Comparisons between developmental stages were conducted using a t-test when the effect of the developmental stage was significant. The statistical differences were considered significant at p < 0.05.
Results
Chemical and microbial characteristics of fresh sweet sorghum
As shown in Table , the developmental stage significantly (p < 0.05) affected all measured chemical and microbial parameters (pH, BC, DM, WSC, NDF, ADF, CP, LAB, aerobic bacteria, yeasts, moulds and enterobacteria) of sweet sorghum. With the maturity of sweet sorghum, the DM, WSC, NDF and ADF content and the LAB, aerobic bacteria, yeast, mould and enterobacteria populations increased, while the CP content and BC decreased (p < 0.05).
Table 1. The chemical composition and epiphytic microbial populations of fresh sweet sorghum harvest at two developmental stages.
Fermentation characteristics of ensiled sweet sorghum
The developmental stage had significant (p < 0.05) effects on the pH value, the LA, AA and PA concentrations and the ratio of lactic to acetic acid (LA/AA), while the ensiling day had significant (p < 0.05) effects on the pH value and the LA, AA and PA concentrations of sweet sorghum silage (Table ). The pH of NS1 and NS2 silages sharply (p < 0.05) decreased during the first 7 days of ensiling reaching the lowest value (3.75 and 3.59) on day 15 and day 60 of ensiling, respectively. Throughout the ensiling process, NS2 silage always had a statistically or numerically lower pH value than NS1 silage. The LA concentration presented the opposite trend to the pH value, with the highest concentration of 53.6 and 132 g/kg DM in 30-day NS1 silage and 60-day NS2 silage, respectively. Regardless of developmental stage, the AA concentration increased (p < 0.001) with the extension of ensiling days, while the PA concentration showed a downward and then upward tendency. At the end of fermentation (day 60), NS2 silage had higher AA but lower PA concentration than NS1 silage (p < 0.05). During the whole ensiling, the LA/AA value of NS1 and NS2 silages fluctuated and reached the maximum on day 3 of ensiling. The BA was not detected in all sweet sorghum silages.
Table 2. Effects of growth stages and ensiling day on fermentation performance of ensiled sweet sorghum.
The DM and WSC content and the NH3-N concentration were affected by the developmental stage and ensiling day, and the WSC content and the NH3-N concentration were affected by their interaction (p < 0.01). As ensiling proceeded, the DM and WSC content decreased, and the NH3-N concentration increased (p < 0.05). NS2 silage always had higher DM and WSC content but also higher NH3-N concentration than NS1 silage.
Table showed that ensiling day significantly (p < 0.01) affected the population of LAB, aerobic bacteria, yeasts, moulds and enterobacteria, while the interaction of developmental stage and ensiling day significantly (p < 0.001) affected the population of LAB in sweet sorghum silage. The LAB population of NS1 and NS2 silages showed an upward and then downward tendency, but the aerobic bacteria, yeast, mould and enterobacteria populations constantly decreased to a negligible (<2.0 log10 CFU/g FW) or undetected level. The LAB population of NS1 and NS2 silages increased rapidly during the first 3 days of ensiling and detected the maximum (7.84 and 9.47 log10 CFU/g FW) on day 30 of ensiling. Although the population of LAB in the NS2 silage was significantly (p < 0.05) higher than that in the NS1 silage on day 1 of ensiling, there was no difference in the population of LAB between NS1 and NS2 silages, subsequently.
Table 3. Effects of growth stages and ensiling day on microbial population of ensiled sweet sorghum.
Bacterial community of fresh and ensiled sweet sorghum
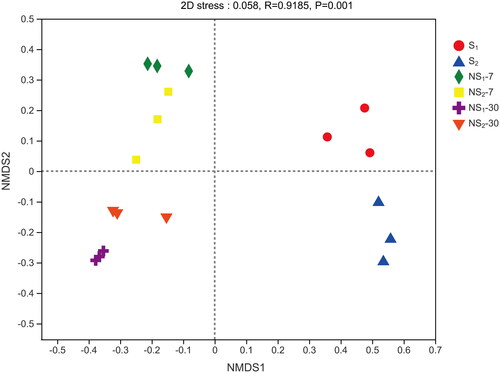
The alpha diversity of the microbial community in fresh and ensiled sweet sorghum is presented in Figure . The Shannon and Chao1 indexes of fresh samples were higher than those in ensiled samples (p < 0.05). Among all silages, NS2 silage always had numerically (p > 0.05) lower Shannon and Chao1 indexes than NS1 silage. Compared with fresh samples (S1 and S2), the Shannon and Chao1 indexes of ensiled samples (NS1 and NS2) decreased after 7 days of ensiling, and further decreased after 30 days of ensiling. The lowest Shannon and Chao1 indexes were observed in the NS2 silage on day 30 of ensiling. The average Good’s coverage of all samples exceeded 99%. The beta diversity of the microbial community in fresh and ensiled sweet sorghum was assessed by NMDS analysis based on the Bray–Curtis distance metric (Figure ). A clear separation and distinction were observed between the symbols of fresh and ensiled samples in the NMDS plot. Among them, the symbols of S1 and S2, as well as NS1-7, NS2-7, NS1-30 and NS2-30, were well separated.
Figure 1. (A–D) General information of sequence and alpha diversity (Shannon and Chao1 indexes) of bacterial communities. S1, sweet sorghum harvested at the heading stage; S2, sweet sorghum harvested at hard dough stage; NS1, natural fermentation of sweet sorghum harvested at the heading stage; NS2, natural fermentation of sweet sorghum harvested at the hard dough stage.
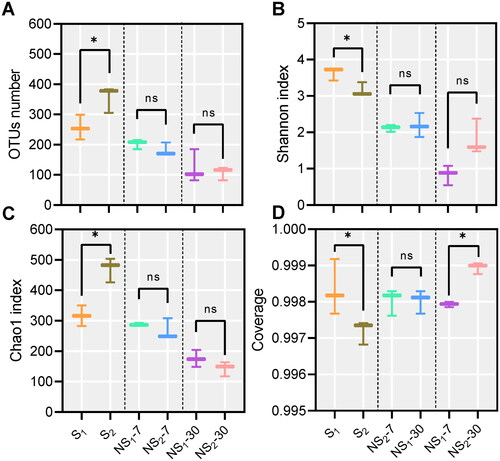
Figure 2. Beta diversities of bacterial communities, calculated by Nonmetric multidimensional scaling (NMDS) plot based on the Bray–Curtis distance metric. S1, sweet sorghum harvested at the heading stage; S2, sweet sorghum harvested at hard dough stage; NS1, natural fermentation of sweet sorghum harvested at the heading stage; NS2, natural fermentation of sweet sorghum harvested at the hard dough stage.
The bacterial community abundance of fresh or ensiled sweet sorghum was first analysed at the phylum level (Figure ). Proteobacteria, Firmicutes, Actinobacteriota and Bacteroidota were detected in both S1 and S2 and Proteobacteria (72.9% and 81.0%) were the phyla with high relative abundance. With the maturity of sweet sorghum, the relative abundances of Firmicutes and Actinobacteriota decreased from 10.9% and 9.96% to 4.20% and 5.50%, respectively, but Proteobacteria and Bacteroidota increased from 72.9% and 5.77% to 81.0% and 8.51%. After 7 days of ensiling, the relative abundance of Firmicutes in NS1 and NS2 increased rapidly from 10.9% and 4.20% to 96.4% and 96.5%, respectively, accompanied by the decrease in the relative abundance of Proteobacteria, Actinobacteriota and Bacteroidota. After 30 days of ensiling, Firmicutes (>99%) were dominant in all sweet sorghum silages.
Figure 3. The relative abundance of bacterial community at the phylum level (A) and the genus level (B). S1, sweet sorghum harvested at the heading stage; S2, sweet sorghum harvested at hard dough stage; NS1, natural fermentation of sweet sorghum harvested at the heading stage; NS2, natural fermentation of sweet sorghum harvested at the hard dough stage.
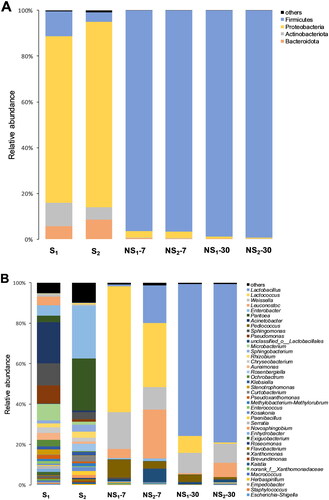
The bacterial community abundance of fresh or ensiled sweet sorghum was further analysed at the genus level. There were 21 genera with a percent of abundance greater than 1% in S1 and 14 genera in S2 (Figure ). Acinetobacter (20.3%), Sphingomonas (10.9%) Pseudomonas (9.15%) and Microbacterium (8.17%) were the 4 genera with high relative abundance in S1, while the most abundant genera in S2 were Enterobacter (26.0%), followed by Pantoea (25.9%). With increasing maturity of sweet sorghum, the relative abundances of Acinetobacter, Sphingomonas, Pseudomonas, Microbacterium and Leuconostoc decreased from 20.3%, 10.9%, 9.15%, 8.17% and 4.28% to 0.83%, 3.29%, 1.32%, 1.91% and 0.04%, but Enterobacter and Pantoea increased from 5.20% and 3.13% to 26.0% and 25.9%, respectively. With the process of ensiling, the relative abundance of aerobic bacteria such as Acinetobacter, Sphingomonas and Pseudomonas decreased to an undetectable level. After 7 days of ensiling, the relative abundance of Lactococcus in NS1 and NS2 silages increased from 0.21% and 0.59% to 62.2% and 31.6%. After 30 days of ensiling, Lactobacillus became the dominant genus in both NS1 and NS2 silages, with relative abundance accounting for 75.0% and 78.3%, respectively.
Microbial co-occurrence networks of fresh and ensiled sweet sorghum
The co-occurrence network based on the correlation coefficient matrix, to a certain extent, can reflect the relationships between microbial members. Thus, the bacterial co-occurrence networks of fresh and ensiled sweet sorghum based on Spearman’s rank correlation were separately created at two developmental stages to clearly understand the effects of the developmental stage on the interrelationships of bacterial members (genera). Based on co-occurrence network analysis (Figure , Table ), the number of nodes and edges in bacterial networks was ranked as follows: S2 > S1 > NS1 > NS2.
Figure 4. Co-occurrence networks analyses of fresh and ensiled sweet sorghum harvested at two developmental stages. Bacterial co-occurrence networks of S1 (A), S2 (B), NS1 (C) and NS2 (D). Nodes colour indicates bacterial phylum and node size indicates its relative abundance. Edge are coloured according to negative (green) and positive (red) correlations.
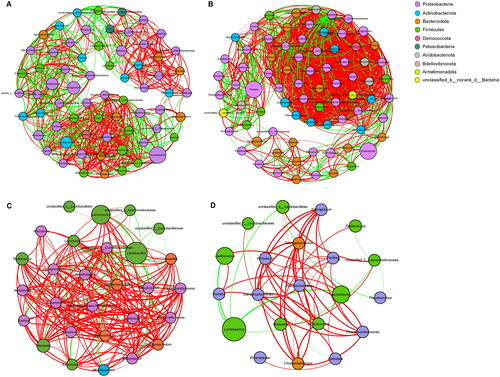
Table 4. Network topological characteristics of fresh and ensiled sweet sorghum.
Correlation analysis of chemical composition and epiphytic microbiota as well as fermentation parameters and bacterial community
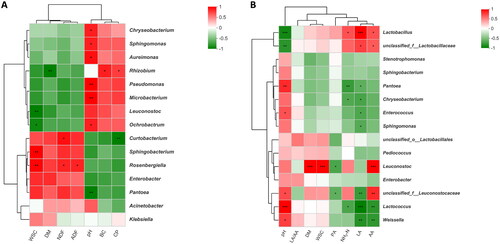
Spearman’s correlation heatmap was constructed to visualise the relationships between chemical composition and epiphytic microbiota as well as fermentation parameters and bacterial community (Figure ). In fresh sweet sorghum (Figure ), Chryseobacterium, Sphingomonas, Aureimonas, Pseudomonas, Microbacterium and Ochrobactrum were positively (p < 0.05) correlated with pH value, with correlation coefficients of 0.829, 0.829, 0.886, 0.943, 0.939 and 0.829, respectively. Conversely, Pantoea was negatively correlated with pH value (R = −0.943, p < 0.01). Rhizobium was positively (p < 0.05) correlated with CP content (R = 0.788) and BC (R = 0.829), whereas negatively (p < 0.01) correlated with DM content (R= −0.943). There was a positive correlation between Curtobacterium and DM content (R = 0.886, p < 0.05) and a negative correlation between Curtobacterium and CP content (R = −0.943, p < 0.01). Sphingobacterium and Rosenbergiella were positively (p < 0.01) correlated with WSC content, with correlation coefficients of 0.943 and 0.928, respectively. In ensiled sweet sorghum (Figure ), the relative abundance of Lactobacillus was positively correlated with LA (R = 0.907, p < 0.001) and AA (R = 0.837, p < 0.05) concentrations, but negatively correlated with pH value (R = −0.877, p < 0.001). The relative abundance of Leuconostoc was positively correlated with AA (R = 0.896, p < 0.001) concentration, DM (R = 0.861, p < 0.001) and WSC (R = 0.831, p < 0.001) content, whereas negatively correlated with PA (R = −0.562, p < 0.05) concentration. The relative abundance of Enterococcus, Lactococcus and Weissella was positively correlated with pH value (p < 0.05) with the correlation coefficients of 0.613, 0.904 and 0.676, respectively, and negatively correlated with LA concentration (p < 0.05) with the correlation coefficients were −0.657, −0.937 and −0.804, respectively.
Figure 5. Spearman’s correlation heatmap of (A) chemical composition and epiphytic microbiota (top 10 genera) in fresh sweet sorghum (B) fermentation parameters and bacterial community (top 10 genera) in ensiled sweet sorghum. Red squares represent positive correlation (0 < r < 1), whereas green squares represent negative correlation (−1 < r < 0). *, significant at p < 0.05; **, significant at 0.001 < p ≤ 0.01. BC, buffering capacity; CP, crude protein; DM, dry matter; ADF, acid detergent fibre; WSC, water soluble carbohydrates; NDF, neutral detergent fibre; PA, propionic acid; NH3-N, ammonia nitrogen; AA, acetic acid; LA, lactic acid; LA/AA, ratio of lactic to acetic acid.
Discussion
Effects of developmental stage and ensiling day on chemical composition and epiphytic microbiota of sweet sorghum
Forage maturity is the most important factor affecting its quality at harvest (Buxton Citation1996). In this study, with the maturity of sweet sorghum, the DM, WSC, NDF and ADF content increased, while the CP content decreased, which was similar to the study of Toruk et al. (Citation2010). The increase in DM content was attributed to the accumulation of carbohydrates (non- and structural carbohydrates) produced by photosynthesis. While the increase of NDF and ADF content and the decrease of CP content could be attributed to the decrease in leaf-stem ratio, since the cell wall components in the stem are higher than that in the leaf, and the CP content in the stem is lower than that in the leaf (Contreras‐Govea and Albrecht Citation2006; Ma et al. Citation2019). Furthermore, the increased proportion of NDF and ADF also led to a relative decrease in CP content (Onyango Citation2010). Queiroz et al. (Citation2021) indicated that the decrease of CP content during forage growth might be the result of the ‘dilution effect’ caused by the increasing proportion of cell walls. This in turn explains the decrease of BC, because the anion concentration and CP content of pre-ensiled material are positively correlated with its BC (McDonald et al. Citation1991).
The population of LAB, aerobic bacteria, yeast and enterobacteria increased with the increase of maturity, which was probably due to the increased WSC content and ageing tissue proportion from the heading to the hard dough stage. As Macarisin et al. (Citation2013) reported, the microbial number and diversity can be sharply affected by the developmental stages of the leaf and plant. Throughout the growth cycle of forage, the external environment (e.g. solar radiation, temperature and rainfall) and internal environment (e.g. plant morphology, moisture content and leaf thickness) have been changing, and they are reported to affect microbial colonisation (Kinkel et al. Citation2000). Recent studies showed that sugar and volatile organic compounds secreted by forage play an important role in determining the microbial population of forage (Farre-Armengol et al. Citation2016; Sharma et al. Citation2020). Microbes, including LAB, are known to enrich sugar-rich plants. Thus, the higher WSC content in S2 could explain the increased population of epiphytic microorganisms. Moreover, other nutrients released from ageing tissue and leaves in S2 were also thought to benefit the growth of microorganisms (Thompson et al. Citation1993).
Effects of developmental stage and ensiling day on fermentation performance of ensiled sweet sorghum
From the heading to the hard dough stage, the DM content of sweet sorghum increased from 192 to 319 g/kg FW. The low DM content of S1 did not seem to be suitable for silage production (Di Marco et al. Citation2002). However, the DM content required to ensure well preservation of the silage must be evaluated along with the pH value, since even silages with low DM content can be effectively preserved as long as the pH value is low enough (Faria et al. Citation2011). Weissbach (Citation1996) found that the critical pH values of high-quality silage were 4.20, 4.45, 4.75 and 5.00 when the DM was 20%, 30%, 40% and 50%, respectively. In this study, the final pH values of NS1 (∼20% DM) and NS2 (∼30% DM) silages were both less than 4.20, indicating that all sweet sorghum silages were well preserved. The high fermentation rate of NS1 and NS2 silages reflected by the quick establishment of the pH stable stage could be attributed to the sufficient WSC content and low BC of sweet sorghum at two developmental stages. Wherein the lower pH and higher LA concentration in NS2 than that in NS1 could be related to the higher WSC content and LAB population and lower BC of S2. As in most studies, AA concentration increased with the extension of ensiling time. It is generally believed that the production of AA in the later stage of ensiling was mainly associated with the shift from homotypic fermentation to heterotypic fermentation. Thus, the higher AA concentration in NS2 silage than that in NS1 silage may be related to the more hetero-fermentative LAB. The PA is the fermentation product mainly produced by propionic acid bacteria. The lower PA concentration in NS2 silage than that in NS1 silage could be explained that the low pH of NS2 silage inhibiting the activity of PA-producing bacteria. Clostridia are easily found in silage with DM less than 30% (van Niekerk et al. Citation2010). But no BA was detected in NS1 and NS2 silages, suggesting that clostridial fermentation did not occur in the sweet sorghum silage.
The DM content of the silage depends on the DM content of the forage at the time of ensiling (Queiroz et al. Citation2021). The significantly higher DM content of the NS2 silage than that of the NS1 silage was due to the higher DM content in S2 than in S1. Similarly, the higher WSC content in NS2 silage than that in NS1 silage could be probably due to the higher WSC content in S1. There were significant differences in WSC content between S1 and S2 (156 vs 284 g/kg DM), but the difference in WSC content between NS1 and NS2 silages tended to decrease as ensiling proceeded, which was similar to the results of Johnson et al. (Citation2003).
As an indicator of protein degradation, NH3-N concentration has long been used to evaluate the fermentation characteristics of silage. The concentration of NH3-N in high-quality silage should be less than 10% (or 100 g/kg) of TN (McDonald et al. Citation1991). The final NH3-N concentrations of NS1 and NS2 silages were no more than the above limit, suggesting that no serious proteolysis occurred in sweet sorghum silage harvested at these two developmental stages. Compared with NS1 silage, NS2 silage had a higher NH3-N concentration, and this was in line with the results of Khan et al. (Citation2011), that is, mature forage had a higher NH3-N concentration of its silage. According to Faria et al. (Citation2011), proteolysis was abundant in ageing and dead tissues, which might explain the increased NH3-N concentration of NS2 silage in this study. The protein degradation and ammonia generation in silage involved the activities of plant protease, clostridia, enterobacteria, etc. However, there was no significant difference in the population of enterobacteria between NS1 and NS2 silages, and no clostridia (data not shown) was detected in all sweet sorghum silages. So, microbial factors such as clostridia and enterobacteria are difficult to explain the higher NH3-N concentration in NS2 silage. We speculated that the higher NH3-N concentration could be primarily related to the plant protease activities.
The higher population of LAB in NS2 silage was associated with the higher WSC content and LAB population of S2. As ensiling proceeded and O2 depleted, the population of aerobic bacteria and moulds in NS1 and NS2 silages rapidly decreased to an undetectable level. And the negligible number of yeast and enterobacteria in both treatments was associated with its low pH value and high LAB population. Although yeasts are resistant to low pH, short-chain organic acids such as LA and AA can enter yeast cells in an undissociated form, releasing H+ to rapidly reduce intracellular acidity, thereby inhibiting or even killing yeast (McDonald et al. Citation1991). Further, the decrease of yeasts was also associated with the rapid increase of LAB as the latter are more competitive under anaerobic and acidic conditions.
Effects of developmental stage and ensiling day on the bacterial community of fresh and ensiled sweet sorghum
The Good’s coverage in all samples was above 99%, suggesting that the sequencing depth was sufficient for reliable analysis of the microbial community. The higher OTUs number in S2 than that in S1 reflected the more abundant bacterial compositions in sweet sorghum harvested at the hard dough stage. Ensiling decreased the bacterial alpha diversity of sweet sorghum, reflected by Chao1 and Shannon indexes, which could ascribe to the disappearance of epiphytic bacteria that are intolerant to acid and anaerobic environments (Dong et al. Citation2020). Low pH conditions are mainly responsible for reducing microbial diversity in acidic environments (Mendez-Garcia et al. Citation2015). The high WSC content and sufficient LAB number of S1 and S2 ensured the LAB proliferation and rapid acidification during ensiling, effectively inhibiting undesirable microorganisms and thereby reducing the alpha diversity of the bacterial community in sweet sorghum silages.
The NMDS plot was constructed to visualise bacterial community composition differences as distances between treatments (Figure ). The 2D stress for NMDS was 0.058, indicating that the symbols in the plot are well represented. The separated cluster between S1 and S2 suggested that there were remarkable differences in the bacterial community composition of fresh sweet sorghum harvested at the two developmental stages. This discrepancy could be associated with the chemical composition of the forage, climate or other factors (Guan et al. Citation2018). Meanwhile, the clear separation between the fresh and ensiled samples could ascribe to the inhibition or inactivation of aerobic and acid-intolerant epiphytic bacteria during ensiling (Dong et al. Citation2020). And the separation among ensiled samples showed that there were differences in the bacterial community composition of sweet sorghum silages at different ensiling days and developmental stages.
This obvious shift of bacterial community from Proteobacteria to Firmicutes before and after ensiling was attributed to the inhibition of aerobic bacteria such as Acinetobacter, Sphingomonas and Pseudomonas, and the proliferation of LAB such as Lactobacillus, Weissella, Pediococcus and Lactobacillus. Lactococcus, Pediococcus and Weissella are generally considered early colonisers during ensiling (Graf et al. Citation2016; Dong et al. Citation2019) due to their weaker tolerance to acid compared with Lactobacillus. Thus, with the process of ensiling, the relative abundance of Lactococcus and Weissella decreased. Meanwhile, Lactococcus and Weissella are found to contribute to the establishment of the initial acid environment and the growth of Lactobacillus (Cai et al. Citation1998). Accordingly, the bacterial community of NS1 and NS2 was firstly dominated by Lactococcus (day 7) and finally dominated by Lactobacillus (day 30). As a typical hetero-fermentative LAB, Leuconostoc can use the phosphoketolase pathway to produce a mixture of LA, AA and ethanol (Gallagher et al. Citation2018). This could explain the high AA concentration in NS2 silage with the high relative abundance of Leuconostoc.
Effects of developmental stage on microbial co-occurrence networks of fresh and ensiled sweet sorghum
Co-occurrence networks among bacterial genera for fresh and ensiled sweet sorghum were constructed to clearly understand the effects of the developmental stage on the correlation and interaction of the epiphytic and silage microbiome. Based on the number of nodes and edges, the complexity of bacterial networks in fresh sweet sorghum increased from the heading stage to the hard dough stage (Table , Figure ). Ensiling decreased the complexity of bacterial networks, with the simplest bacterial correlation structures in NS2 (Table , Figure ). High fermentation quality was accompanied by low network complexity, which is in line with Bai et al. (Citation2021).
According to Banerjee et al. (Citation2016), the negative correlation of co-occurrence networks indicates a possible competition for resources and common predators, while the positive correlation indicates symbiotic or cooperative relationships within microbial taxa. The lower proportion of negative correlations in the network of S2 (22.3%) than those in the network of S1 (37.3%) manifested that, with the growth of sweet sorghum (the increase of available substrate), the competition among bacterial taxa in its epiphytic microbiota weakened. Furthermore, the higher proportion of positive correlations in the network of NS1 and NS2 silages (89.2% and 85.7%) than those in the networks of S1 and S2 (62.7% and 77.7%) reflected the increased cooperative interactions among bacterial taxa after ensiling. Thus, the microbiome in well-fermented silages is primarily cooperative, which could be confirmed by some findings: (I) Lactococcus and Weissella establishing an acidic environment suitable for the growth of Lactobacillus (Cai et al. Citation1998; II) The dual-purpose inoculants was developed and popularised based on the synergistic effect of homo-fermentative and hetero-fermentative LAB.
Correlation of chemical composition and epiphytic microbiota as well as fermentation parameters and bacterial community of fresh and ensiled sweet sorghum
In fresh sweet sorghum, the positive between Rhizobium or Ochrobactrum and CP content could be explained by their nitrogen-fixing capacity, as these two genera belong to Rhizobiaceae. It is commonly known that rhizobia can fix nitrogen from the atmosphere for use by host plants. A significant positive correlation was observed between Curtobacterium and DM content in this study. Wang et al. (Citation2019) reported that the wilting treatment obviously increased the relative abundance of this genus in Moringa oleifera leaf silage. Based on the above results, Curtobacterium may prefer low-moisture plant material. Sphingobacterium and Rosenbergiella have been reported to metabolise carbohydrates by oxidation and fermentation pattern, respectively, which interpreted the significant positive correlation between Sphingobacterium or Rosenbergiella and WSC content. In sweet sorghum silage, Lactobacillus was positively correlated with LA concentration but negatively correlated with pH value, which further confirmed that this genus had strong acid resistance and played a crucial role in the pH decline in the late stage of ensiling (Yuan et al. Citation2020). Simultaneously, Lactobacillus and Leuconostoc were positively correlated with AA concentration, indicating that the production of AA during ensiling of sweet sorghum was related to the strains of Leuconostoc and heterofermentative Lactobacillus. The significant negative correlation between Lactobacillus and WSC content presented that the decrease of WSC in sweet sorghum silage was mainly due to the consumption of Lactobacillus rather than undesirable microorganisms.
In general, plant protease, enterobacteria and/or clostridia involve the generation of NH3-N during ensiling. However, no clostridia were detected in all sweet sorghum silages. Meanwhile, there was a negative correlation between Enterobacter and NH3-N concentration. These results suggested that enterobacteria and clostridia were not supported to explain the higher NH3-N concentration in NS2 silage. The generation of NH3-N during ensiling of sweet sorghum might be primarily associated with plant protease, but further study is required. Enterococcus, Lactococcus and Weissella presented a significant positive correlation with pH value, and this is probably due to the fact that these three genera were replaced by Lactobacillus as pH declined, leading to the low relative abundances of Enterococcus, Lactococcus and Weissella observed in silages with low pH value.
Conclusions
Sweet sorghum contains low BC but high WSC content, which can be used as a promising forage for silage production. The developmental stage had great effects on fermentation performance, microbial community and co-occurrence networks of sweet sorghum silage. The sweet sorghum silages made at the heading and hard dough stages both displayed lactate-type fermentation. Therefore, sweet sorghum harvested at the hard dough stage is recommended for silage production to optimise fermentation characteristics and silage yield.
Ethical approval
All research reported in this research has been conducted in an ethical and responsible manner, and is in full compliance with all relevant codes of experimentation and legislation.
Disclosure statement
No potential conflict of interest was reported by the author(s).
Data availability statement
The data that support the findings of this study are available from the corresponding author, TS, upon reasonable request.
Additional information
Funding
References
- Bai J, Ding Z, Ke W, Xu D, Wang M, Huang W, Zhang Y, Liu F, Guo X. 2021. Different lactic acid bacteria and their combinations regulated the fermentation process of ensiled alfalfa: ensiling characteristics, dynamics of bacterial community and their functional shifts. Microb Biotechnol. 14(3):1171–1182.
- Banerjee S, Kirkby CA, Schmutter D, Bissett A, Kirkegaard JA, Richardson AE. 2016. Network analysis reveals functional redundancy and keystone taxa amongst bacterial and fungal communities during organic matter decomposition in an arable soil. Soil Biol Biochem. 97:188–198.
- Bassam EL, Jakob K. 1997. Sweet sorghum, a sustainable crop for energy production in Europe - results of 10 years experiments (1985–1995). Paper presented at the First International Sweet Sorghum Conference; 14–19; Beijing, China.
- Beck P, Poe K, Stewart B, Capps P, Gray H. 2013. Effect of brown midrib gene and maturity at harvest on forage yield and nutritive quality of sudangrass. Grassl Sci. 59(1):52–58.
- Broderick GA, Kang JH. 1980. Automated simultaneous determination of ammonia and total amino acids in ruminal fluid and in vitro media. J Dairy Sci. 63(1):64–75.
- Buxton DR. 1996. Quality-related characteristics of forages as influenced by plant environment and agronomic factors. Anim Feed Sci Tech. 59(1–3):37–49.
- Cai Y, Benno Y, Ogawa M, Ohmomo S, Kumai S, Nakase T. 1998. Influence of Lactobacillus spp. from an inoculant and of Weissella and Leuconostoc spp. from forage crops on silage fermentation. Appl Environ Microbiol. 64(8):2982–2987.
- Chen L, Li J, Dong Z, Yuan X, Shao T. 2018. Effects of applying oil-extracted microalgae on the fermentation quality, feed-nutritive value and aerobic stability of ensiled sweet sorghum. J Sci Food Agric. 98(12):4462–4470.
- Contreras‐Govea FE, Albrecht KA. 2006. Forage production and nutritive value of oat in autumn and early summer. Crop Sci. 46(6):2382–2386.
- De Brouwer CHM, Van Der Merwe HJ, Snyman LD. 1991. A laboratory study of the composition and fermentation of various crop silages. S Afr J Anim Sci. 21:21–27.
- Di Marco ON, Aello MS, Nomdedeu M, Van Houtte S. 2002. Effect of maize crop maturity on silage chemical composition and digestibility (in vivo, in situ and in vitro). Anim Feed Sci Technol. 99(1–4):37–43.
- Doggett H. 1988. Sorghum. 2nd ed. New York (NY): Longman Scientific & Technical.
- Dong Z, Li J, Chen L, Wang S, Shao T. 2019. Effects of freeze-thaw event on microbial community dynamics during red clover ensiling. Front Microbiol. 10(1559):1559.
- Dong Z, Shao T, Li J, Yang L, Yuan X. 2020. Effect of alfalfa microbiota on fermentation quality and bacterial community succession in fresh or sterile Napier grass silages. J Dairy Sci. 103(5):4288–4301.
- Faria WG, Goncalves LC, Ribeiro GO, Carvalho WTV, Mauricio RM, Rodrigues JAS, Faria WG, Saliba EOS, Rodriguez NM, Borges ALCC. 2011. Effect of grain maturity stage on the quality of sorghum BRS-610 silages. Arq Bras Med Vet Zootec. 63(5):1215–1223.
- Farre-Armengol G, Filella I, Llusia J, Penuelas J. 2016. Bidirectional interaction between phyllospheric microbiotas and plant volatile emissions. Trends Plant Sci. 21(10):854–860.
- Ferrero F, Piano S, Tabacco E, Borreani G. 2019. Effects of conservation period and Lactobacillus hilgardii inoculum on the fermentation profile and aerobic stability of whole corn and sorghum silages. J Sci Food Agric. 99(5):2530–2540.
- Gallagher D, Parker D, Allen DJ, Tsesmetzis N. 2018. Dynamic bacterial and fungal microbiomes during sweet sorghum ensiling impact bioethanol production. Bioresour Technol. 264:163–173.
- Graf K, Ulrich A, Idler C, Klocke M. 2016. Bacterial community dynamics during ensiling of perennial ryegrass at two compaction levels monitored by terminal restriction fragment length polymorphism. J Appl Microbiol. 120(6):1479–1491.
- Guan H, Yan Y, Li X, Li X, Shuai Y, Feng G, Ran Q, Cai Y, Li Y, Zhang X. 2018. Microbial communities and natural fermentation of corn silages prepared with farm bunker-silo in Southwest China. Bioresour Technol. 265:282–290.
- Johnson LM, Harrison JH, Davidson D, Mahanna WC, Shinners K. 2003. Corn silage management: effects of hybrid, maturity, inoculation, and mechanical processing on fermentation characteristics. J Dairy Sci. 86(1):287–308.
- Khan SH, Azim A, Sarwar M, Khan AG. 2011. Effect of maturity on comparative nutritive value and fermentation characteristics of maize, sorghum and millet silages. Pak J Bot. 43(6):2967–2970.
- Kinkel LL, Wilson M, Lindow SE. 2000. Plant species and plant incubation conditions influence variability in epiphytic bacterial population size. Microb Ecol. 39(1):1–11.
- Ma J, Sun G, Shah AM, Fan X, Li S, Yu X. 2019. Effects of different growth stages of amaranth silage on the rumen degradation of dairy cows. Animals. 9(10):793.
- Macarisin D, Patel J, Bauchan G, Giron JA, Ravishankar S. 2013. Effect of spinach cultivar and bacterial adherence factors on survival of Escherichia coli O157:H7 on spinach leaves. J Food Prot. 76(11):1829–1837.
- McAllister TA, Duniere L, Drouin P, Xu S, Wang Y, Munns K, Zaheer R. 2018. Silage review: using molecular approaches to define the microbial ecology of silage. J Dairy Sci. 101(5):4060–4074.
- McCullough ME. 1989. Forage for dairy cows: part 4. Don’t overlook annuals when feeding your herd. Fort Atkinson (WI): Hoard’s Dairymen; p. 137.
- McDonald P, Henderson AR, Heron SJE. 1991. The biochemistry of silage. 2nd ed. Marlow (UK): Chalcombe Publications.
- Mendez-Garcia C, Pelaez AI, Mesa V, Sanchez J, Golyshina OV, Ferrer M. 2015. Microbial diversity and metabolic networks in acid mine drainage habitats. Front Microbiol. 6(475):475.
- Mutegi E, Sagnard F, Muraya M, Kanyenji B, Rono B, Mwongera C, Marangu C, Kamau J, Parzies H, de Villiers S, et al. 2010. Ecogeographical distribution of wild, weedy and cultivated Sorghum bicolor (L.) Moench in Kenya: implications for conservation and crop-to-wild gene flow. Genet Resour Crop Evol. 57(2):243–253.
- Oliveira SS, Costa K, Souza W, Santos C, Teixeira DAA, Silva V. 2020. Production and quality of the silage of sorghum intercropped with Paiaguas palisadegrass in different forage systems and at different maturity stages. Anim Prod Sci. 60(5):694–704.
- Onyango CM. 2010. Preharvest and postharvest factors affecting yield and nutrient contents of vegetable amaranth (var. Amaranthus hypochondriacus) Wageningen (The Netherlands): Wageningen University; p. 129.
- Playne MJ, McDonald P. 1966. The buffering constituents of herbage and of silage. J Sci Food Agric. 17(6):264–268.
- Queiroz FEd, Rocha VR, Monção FP, Rigueira JPS, Parella RAdC, Rufino LDdA, Santos ASd, Cordeiro MWS. 2021. Effect of row spacing and maturity at harvest on the fermentative profile, aerobic stability, and nutritional characteristics of biomass sorghum (BRS 716) silage in the semiarid region of Brazil. Revista Brasileira de Zootecnia. 50:e20200254.
- Ronda V, Aruna C, Visarada KBRS, Bhat BV. 2019. Sorghum for animal feed. In: Aruna C, Visarada KBRS, Bhat BV, editors. Breeding sorghum for diverse end uses. Sawston (UK): Woodhead Publishing; p. 229–238.
- Schmidt J, Sipocz J, Kaszas I, Szakacs G, Gyepes A, Tengerdy RP. 1997. Preservation of sugar content in ensiled sweet sorghum. Bioresour Technol. 60(1):9–13.
- Sharma M, Sudheer S, Usmani Z, Rani R, Gupta P. 2020. Deciphering the omics of plant-microbe interaction: perspectives and new insights. Curr Genomics. 21(5):343–362.
- Thomas TA. 1977. An automated procedure for the determination of soluble carbohydrates in herbage. J Sci Food Agric. 28(7):639–642.
- Thompson IP, Bailey MJ, Fenlon JS, Fermor TR, Lilley AK, Lynch JM, Mccormack PJ, Mcquilken MP, Purdy KJ, Rainey PB, et al. 1993. Quantitative and qualitative seasonal changes in the microbial community from the phyllosphere of sugar beet (Beta vulgaris). Plant Soil. 150(2):177–191.
- Toruk F, Gonulol E, Kayisoglu B, Koc F. 2010. Effects of compaction and maturity stages on sunflower silage quality. Afr J Agr Res. 5(1):55–59.
- van Niekerk WA, Hassen A, Bechaz FM. 2010. Influence of growth stage at harvest on fermentative characteristics of Panicum maximum silage. S Afr J Anim Sci. 40(4):334–341.
- Van Soest PJ, Robertson JB, Lewis BA. 1991. Methods for dietary fiber, neutral detergent fiber, and nonstarch polysaccharides in relation to animal nutrition. J Dairy Sci. 74(10):3583–3597.
- Wang Y, He L, Xing Y, Zheng Y, Zhou W, Pian R, Yang F, Chen X, Zhang Q. 2019. Dynamics of bacterial community and fermentation quality during ensiling of wilted and unwilted Moringa oleifera leaf silage with or without lactic acid bacterial inoculants. Msphere. 4(4):e00341.
- Weissbach F. 1996. New developments in crop conservation. In: Jones DIH, Jones R, Dewhurst R, Merry R, Haigh PM, editors. Proceedings of the 11th International Silage Conference. Aberystwyth (UK): IGER; p. 11–25.
- Yuan X, Dong Z, Li J, Shao T. 2020. Microbial community dynamics and their contributions to organic acid production during the early stage of the ensiling of Napier grass (Pennisetum purpureum). Grass Forage Sci. 75(1):37–44.
- Zhang SJ, Chaudhry AS, Osman A, Shi CQ, Edwards GR, Dewhurst RJ, Cheng L. 2015. Associative effects of ensiling mixtures of sweet sorghum and alfalfa on nutritive value, fermentation and methane characteristics. Anim Feed Sci Technol. 206:29–38.
- Zhao J, Dong Z, Li J, Chen L, Bai Y, Jia Y, Shao T. 2018. Ensiling as pretreatment of rice straw: the effect of hemicellulase and Lactobacillus plantarum on hemicellulose degradation and cellulose conversion. Bioresour Technol. 266:158–165.
- Zhao J, Yin X, Dong Z, Wang S, Li J, Dong D, Shao T. 2022. Using gamma-ray irradiation and epiphytic microbiota inoculation to separate the effects of chemical and microbial factors on fermentation quality and bacterial community of ensiled Pennisetum giganteum. J Appl Microbiol. 132(3):1675–1686.
- Zhao J, Yin XJ, Wang SR, Li JF, Shao T. 2021. Separating the effects of chemical and microbial factors on fermentation quality and bacterial community of Napier grass silage by using gamma-ray irradiation and epiphytic microbiota transplantation. Anim Feed Sci Technol. 280:115082.