
ABSTRACT
Political engagement is deeply enmeshed with online activity. However, there has been a lack of publicly available cross-country datasets enabling researchers and policymakers to understand how politics and digital space intersect. This paper introduces the Digital Society Project (DSP), which aims to provide systematic, cross-country measurement of political institutions and behavior that manifest online or are affected by online activity. Using the Varieties of Democracy Project infrastructure, DSP provides annual global data from 2000 to 2021. The dataset features 35 indicators measuring online censorship, politicization of social media, coordinated information operations, foreign influence, monitoring of domestic politics, and regime cyber capacity. This article introduces the DSP data collection effort, overviews the resulting dataset, and validates key indicators by conducting a series of diagnostic tests. We demonstrate that the DSP dataset aligns with extant datasets measuring internet freedom and offers expanded coverage across countries and over time. We analyze two case studies, walking through how the DSP data can be used to extend existing work on China to generalize this case to other contexts, and examining in depth the case of Ethiopia, which differs the most between DSP and Freedom House’s Freedom on the Net.
Introduction
Over the last few decades, the internet has become global and ubiquitous, with more than half of the world’s population using the internet regularly, and the average internet user spending 6.5 hours daily online (Kemp, Citation2019). From the role of social media in the Arab Spring to the spread of anti-vaccination disinformation during the pandemic, focal events have made the intersection of the internet and politics an intensely scrutinized research area across the social sciences.
How has the internet affected political institutions and behavior? Has social media made the collective action problem easier to solve, or has it led to increased polarization? Has information become more easily accessible from multiple sources, or has it become harder to sift truth from disinformation? A broad and exciting literature has blossomed around these questions, but despite creative data collection and inspired research design, measurement of these new concepts – especially on a large-n, cross-country basis – has been largely blunt, with ad-hoc operationalization.
This paper introduces the Digital Society Project (DSP), which aims to provide systematic, cross-country measurement of political institutions and behavior that manifest online or are affected by online activity. Using the Varieties of Democracy (V-Dem) infrastructure, the DSP dataset provides annual data from 2000 to 2021 for nearly all countries in the world (with planned annual updates going forward). The DSP dataset features 35 indicators measuring online censorship, polarization and politicization of social media, misinformation campaigns and coordinated information operations, foreign influence in and monitoring of domestic politics, and regime cyber capacity.
This article introduces the data collection effort and presents several interesting highlights from the resulting dataset. We demonstrate the content, convergent, and case-specific validity of the data. We first show that it is possible to use DSP measures to reconstruct Freedom House’s Freedom on the Net (FOTN) measure, producing a measure that correlates highly with FOTN. This analysis establishes the content validity of the DSP measures; they instantiate a coherent – and externally developed – theoretical framework. Second, we use FOTN country reports to answer the DSP survey and demonstrate substantial convergence between “synthetic” DSP scores generated from FOTN expert assessments and those provided by DSP experts. A final validation exercise we do is to take a closer look at two case studies. We first examine the internet censorship and coordinated information operations in China to show that the DSP dataset is able to capture the literature’s characterization of these issues. Finally, we describe the case of Ethiopia, where FH and DSP are most in disagreement over in the two macrovalidity exercises.
Since this is an open and publicly available dataset, we hope that it will be of significant utility to academics and policy communities who are interested in studying the intersection between the internet and politics.
Theoretical background
Social media and the internet have deeply infiltrated politics. It has become easier to quickly measure public opinion (McGregor, Citation2020), reach out to constituents, mobilize and unite people (Boulianne, Citation2009, Citation2015; Dimitrova & Byström, Citation2017), empower grassroots movements (Murthy, Citation2018), and transfer information to mass publics – the internet and social media is everywhere (Dimitrova & Jörg, Citation2018). However, there has been a lack of high quality, publicly available datasets that enable researchers and policymakers to understand how politics and social media intertwine. That is not to say that there is no demand for such a dataset – numerous innovative papers have been published in the last two decades or so which study the impact of social media in political life.
What is missing is a robust dataset including several key indicators with global coverage. It is our hope that with the Digital Society Project dataset, academics will be able to eliminate some of these gaps.
In the existing literature, there is a theoretical expectation that the rise of social media should alter politics by reducing the transaction costs that factor into solving collective action problems (Castells, Citation2009; Shirky, Citation2009). The ability to communicate is an essential component of most elements of politics, and as such, we expect that the changes brought by the rise of universal, instantaneous, and mobile mass communication should therefore affect a myriad of political outcomes. Larry Diamond dubbed such technology “liberation technology” to capture the role of technology in increasing the ability of social movements to resist regimes (Diamond, Citation2010).
The low barrier of entry for the collection of social media data by scholars has led to a proliferation of case-specific and regional studies of the effects of social media on various variables in global contexts. To name just a few to hint at the variety: the use of ICTs to facilitate violence in Africa (Pierskalla & Hollenbach, Citation2013), and general mobilization in the continent (Manacorda & Tesei, Citation2020), their use in election monitoring in Nigeria (Bailard & Livingston, Citation2014), social media’s role in Euromaidan (Brantly, Citation2019; Wilson, Citation2017), or its effect on political participation in the EU (Vaccari et al., Citation2015). Meta-studies on the relationship between Internet and social media usage and political engagement show a positive, albeit small increase in outcomes such as civic engagement, political participation and voting (Boulianne, Citation2009, Citation2015).
Research on the effect of social media on social mobilization, especially in authoritarian contexts, has been particularly extensive (Farrell, Citation2012; Gohdes, Citation2020; Tucker et al., Citation2016; Tufekci, Citation2017). The bulk of this work has been focussed on social media’s role in the Arab Spring (i.e., the so-called “Facebook Revolutions”) (Smidi & Shahin, Citation2017; Stepanova, Citation2011; Zhuo, Wellman, & Yu, Citation2011) and earlier Color Revolutions (Bunce & Wolchik, Citation2010; Goldstein, Citation2007; Kyj, Citation2006). While much of this work highlights social media’s potential for citizen mobilization in closed regimes, authoritarian states with high technical capacity – notably China – are able to allow substantial political criticism on social media while stymying collective action (King, Pan, & Roberts, Citation2013).
Yet, scholars increasingly acknowledge that social media also has a dark side. Multiple authors examine how digital communication platforms affect political violence (Bak, Sriyai, & Meserve, Citation2018; Gohdes, Citation2020; Wahlström & Törnberg, Citation2021; Warren, Citation2015). There is growing evidence that the internet has stabilized technically capable authoritarian regimes by enhancing their capacity to monitor populations and solve the dictator’s information problem (Morozov, Citation2012). These include China’s use of social media monitoring to learn which policies and local officials are unpopular, Russia’s domestic astroturfing efforts online, and the use of social media to help the government identify regime opponents in various Arab countries (Gohdes, Citation2018, Citation2020; Wilson, Citation2016). Indeed, authoritarian regimes have developed an ever-evolving menu of strategies for policing internet content and disrupting collective action (Deibert, Palfrey, Rohozinski, & Jonathan, Citation2008; Roberts, Citation2018).
A growing literature has also explored the negative implications of the internet for democracies. Evidence suggests that social media has helped destabilize new democracies by making short-term collective action easy at the expense of building institutions (Faris & Etling, Citation2008). Others have focussed on more specific problems that arise from social media, such as the danger of homophily (the self-sorting of individuals into sheltered groups of those with similar beliefs) (Garrett & Resnick, Citation2011; Gentzkow & Shapiro, Citation2011; Page, Citation2008; Sunstein, Citation2009), or implications of a digital divide domestically (Schlozman, Verba, & Brady, Citation2010). Scholars in this literature have argued that, even in democracies, internet censorship is politically motivated (Meserve & Pemstein, Citation2018), and that legal protections for civil liberties are often ineffectively extended to the digital realm (Meserve, Citation2018; Zittrain, Citation2003).
And, of course, recent elections point to concerns about political and electoral cyber-security, and the weaponization of social media by foreign actors to interfere in democratic processes (Dowling, Citation2021; Henschke, Sussex, & O’Connor, Citation2020). As with the effect of social media on mobilization, the study of regime capacity for operating in this context is typically confined to single-country case studies analyzing the capabilities of particular states (Hjortdal, Citation2011; Krekel, Adams, & Bakos, Citation2014). Cross-national work currently relies on broad instruments, such as GDP, to approximate general measures of state capacity and have not effectively measured specific capabilities (Wilson, Citation2016).
The work that we discuss above provides substantively varied and theoretically rich perspectives on the effects of the internet on politics. However, one drawback of this work is that it is almost exclusively composed of single country case studies, and in particular, cases that select upon the dependent variable of something interesting having happened. Despite its importance to understanding authoritarian persistence and democratic politics in the contemporary world, an almost total lack of cross-national comparative data persists. While scholars would benefit from such data, this need is especially acute for policy-makers and firms who increasingly need to make decisions in light of global variation in digital politics. Global variation in states’ capacity to control and monitor their populations’ internet usage, or the extent to which individuals use social media to politically organize, is not unknowable. But these quantities are difficult to measure cross-nationally because such information is the domain knowledge of individuals who are experts on particular countries.
The digital society project dataset
Our approach
We designed the DSP dataset to fill in the gap of comparative data pertaining to the political environment of the internet and social media. It is a country-year longitudinal dataset covering 202 countries and 35 indicators from 2000 to 2021. The V-Dem Institute provided the use of its infrastructure for this data collection project. Well validated and widely used throughout the social-scientific community, the V-Dem methodological approach is well suited to measuring topics related to digital society. Expert coding is appropriate when the concepts in question are too technical or nuanced for crowd-sourced data, but well defined and knowable by experts on the country in question. The V-Dem protocol is to have a minimum of five experts answering each question, typically recruiting academics. In the recruitment process, the project adheres to the following five criteria when selecting potential experts: 1) proven expertise in the assigned country and thematic survey (as evidence by for example, an advanced degree in the subject-area)Footnote1; 2) connection to the country (coders are typically nationals or residents in the country they code); 3) seriousness of purpose; 4) impartiality (individuals associated with a political party will not be recruited), and 5) on average, diversity in the background of coders (Coppedge et al., Citation2018). V-Dem has recruited Regional Managers and Country Coordinators who together with the Principal Investigators and Project Managers prepare a list of between 100 and 200 potential experts. Project Managers located in Gothenburg make the final decision who to invite to participate in the survey, and for security purposes, are the only people who know the identity of the coders.
The V-Dem team processed the DSP data using the standard V-Dem protocols using the custom-made Bayesian Item-Response Theory measurement model (Coppedge et al., Citation2018; Marquardt & Pemstein, Citation2018; Pemstein et al., Citation2018). This model allows for experts to vary both in reliability – the rate at which they make stochastic errors – and rating thresholds – systematic bias in how they map their perceptions into answers to Likert-scale questions. V-Dem pairs this IRT framework with anchoring vignettes, which use hypothetical examples to effectively learn how experts’ rating thresholds vary. Furthermore, coders rate countries beyond their country of primary expertise, further helping the model to assess systematic country-level differences in the rating thresholds.
The survey
The Digital Society expert survey features 35 indicators, grouped into five categories: coordinated information operations, digital media freedom, state internet regulation capacity, online media polarization, and social cleavages. Below we briefly describe the purpose of each category, and we list all indicators in . The full codebook with description of each variable is available in Supplementary Appendix A.
Table 1. Indicators included in the DSP survey.
Coordinated information operations
Social media is increasingly used as a tool of coordinated information operations. Both foreign powers, with a vested interest in the political trajectory of the country, and domestic actors, with an incentive to skew information available to their publics, deploy such operations. These actors use the reach of social media and tools such as “troll armies” to generate and disseminate particular viewpoints or fake news. This portion of the survey captures the presence and characteristics of either foreign or domestic coordinated information operations. In addition, it estimates the capacity of regimes to use such techniques both domestically and abroad.
Digital media freedom
These questions model the implementation and extent of a variety of filtering, censorship, and shutdown of the internet (e.g., filtering, active takedowns, limitation of access), by actor (e.g., government, non-state actors) in terms of both capacity and actual practice.
State internet regulation capacity and approach
States vary dramatically in their capacity to regulate online content. This portion of the survey examines the extent to which the state has the capacity to regulate online content, and the model that the state uses to regulate online content. In particular, we ask questions about the extent to which laws allow states to remove content, privacy and data protections, the extent to which actors can leverage copyright and defamation law, and de-facto levels of state intervention in online media.
Online media polarization
Questions under this sub-topic help provide a sense of whether, and to what extent, online and traditional media is polarized within a country. The responses measure the level of fractionalization, whether and to what extent citizens are getting information from these polarized sources and whether the media markets serve a certain ideological niche.
Social cleavages indicators
This portion of the survey pertains to the divisiveness within society and how it is further aggravated by social media. In other words, how are social cleavages further deepened by inciting violence and political action through social media.
Findings from the v4 (2022) digital society survey
The resulting DSP survey gives its users the opportunity to examine various dimensions of the interaction between Internet and politics. With the aim to give a short preview of how the DSP data can be used, we present findings in three key research areas: usage of the Internet to organize offline action; spread of false information online; and censoring online content.
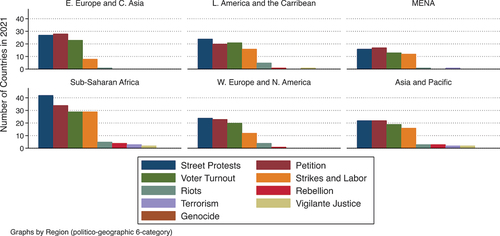
Several DSP indicators capture dimensions of how the Internet and social media are being used to solve collective action problems, both for good and for ill. In “What types of offline political action are most commonly mobilized on social media?” we find that online organization of offline political action seems to be extremely widespread, with the most common offline political action organized online being street protest (organized online in 72% of countries), petition signing (69%), voter turnout efforts (58%), and strikes/labor actions (44%). There are definite geographic patterns in this data. Whereas organizing petition signing online is extremely common in Western Europe and North America and Eastern Europe and Central Asia (where more than 80% of countries experienced this in 2021), it is less common in sub-Saharan Africa (where only 57% of countries experienced this in 2021). In contrast, it is common to organize strikes or other labor action online in Latin America (where just over 50% of countries experienced this in 2021), but this is uncommon in Eastern Europe and Central Asia (where under one-third of countries experienced this in 2021).
Significant violent action is also mobilized online, though these offline actions are more rare. Terrorism and vigilantism (mob lynching, stalking, harassment) are organized online in less than 10% of countries. In addition, the use of social media in organizing ethnic cleansing or genocide is reported by at least a third of the expert coders in three countries: Afghanistan, Eritrea, and India.
In and we show the 2021 breakdown across different offline activities that are organized online. depicts the pattern across the world, and depicts patterns by region.
Figure 1. Breakdown in offline activities organized online, 2021.
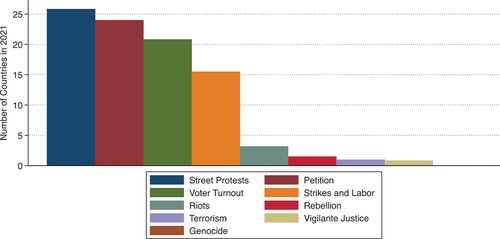
Figure 2. Breakdown in offline activities organized online by region, 2021.
The indicator “How often do people use social media to organize offline violence?” provides some additional perspective, on a 3-point Likert scale. In 2021, nine countries – Afghanistan, Bangladesh, Chile, India, Iraq, Libya, the Maldives, Sudan, Turkey – are ranked at the level of “Frequently: There are numerous cases in which people have used social media to organize offline violence.” In v1 of the dataset (through 2018), only five countries were in this category.
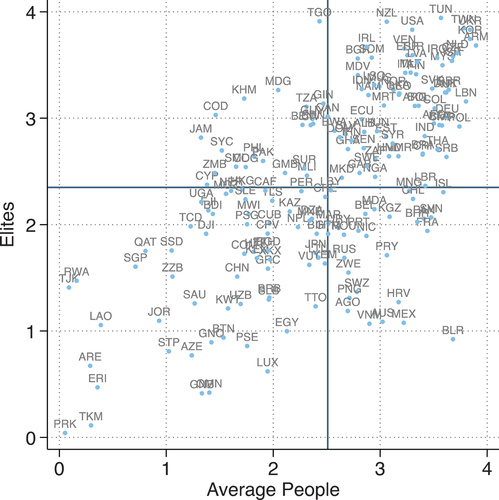
We distinguish which segment of the population is organizing “offline political action of any kind” with social media in a pair of indicators that separately capture whether average people or domestic elites are doing so. shows the relationship between these two indicators. The dark blue lines represent the average scores for 2021 for each of the two indicators. While there is a positive relationship between the two (r = 0.645, p < .0), online mobilization in a set of countries is skewed toward being either elite-perpetrated or population-perpetrated. Note that some cases weighted more toward elites like Cambodia (KHM) and others toward average people, e.g. Belarus (BLR).
Figure 3. Use of social media to mobilize offline action (elites vs. Average people), 2021.
We have several indicators that map the degree to which false information operations exist on social media. We ask the degree to which “the government and its agents use social media to disseminate misleading viewpoints or false information to influence” both its own population and countries abroad. These two indicators correlate highly (r = 0.930, p < .000). lists the governments most likely to disseminate false information domestically and abroad. Among the worst offenders on both indicators are Turkmenistan, Venezuela, Syria, Burma/Myanmar, and Eritrea.
Table 2. Top countries disseminating false information.
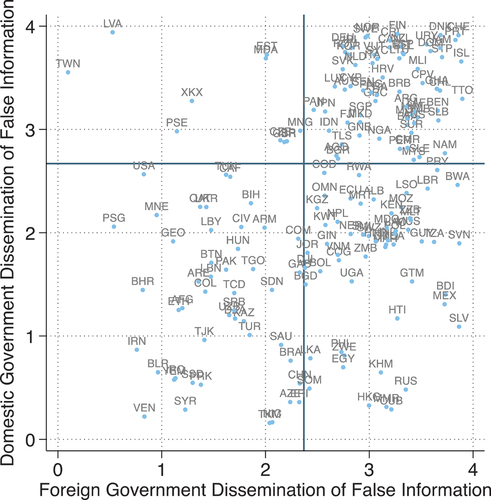
We also measure the degree to which foreign governments use social media to spread false information to influence domestic politics in the country. In we compare this indicator to the one capturing the domestic government’s tendency to disseminate false information. The dark blue lines represent the average scores for 2021 for each of the two indicators. We see that the countries being affected the most by foreign governments’ dissemination of false information but doing so the least in their own countries are Latvia and Taiwan. On the other side of the spectrum are countries which frequently disseminate false information to their own populations, but are relatively free from foreign interference – e.g. Russia and El Salvador.
Figure 4. Foreign and domestic government dissemination of false information, 2021.
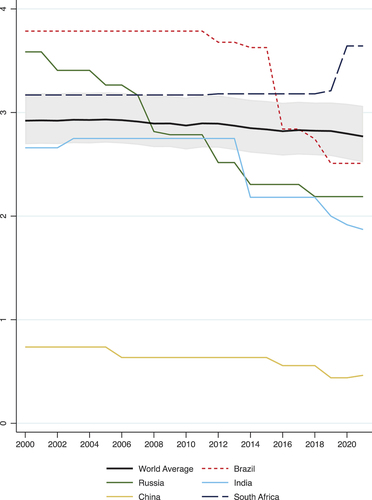
The survey contains several questions about tactics governments use to suppress online content that is not favorable to them. In , we examine one of the common tactics to censor political information on the Internet: internet filtering. The figure shows the trends in internet filtering from 2000 to 2021 for the world average, and the BRICS countries. Except for South Africa, which uses this tactic more rarely in recent years (score around 3.5 on this 0 to 4 indicator), all other countries increasingly censor political content online. For 2021 China has a score of 0.5 meaning filtering is a regular practice of the government. After steep decline in recent years, for 2021 both Russia and India have a score around 2, which indicates that the government regularly and successfully removes about half of the critical content toward the government. Brazil also experiences a precipitous decline on this DSP indicator in 2016, and has a score of 2.5 in 2021.
Figure 5. Government internet filtering in practice, 2020–2021.
Validation
Attempts to validate new datasets face a paradoxical issue: if the data cannot be validated against existing knowledge it may be suspect, while if it can be perfectly validated it is demonstrably redundant. Thus, while we cannot provide a full validation of our dataset, we nonetheless can use other sources that measure similar concepts to provide an overview of data quality. In order to validate the robustness of the data, we draw upon the techniques introduced in McMann et al.‘s Strategies of Validation framework (McMann, Pemstein, Seim, Teorell, & Lindberg, Citation2021) for evaluating the dataset in two stages: at the macro level of aggregated thick-theoretical performance compared to the Freedom House Freedom on the Net (FOTN) report, and the case study level of comparing our data set’s measurement of aspects of Chinese digital society, in addition to a close look at the less well-studied case of digital society in Ethiopia.
Macro validation
Freedom on the Net is Freedom House’s annual report on internet freedom around the world. It started with covering 15 countries in 2009 growing to 65 countries by Citation2020. FOTN measures, among other concepts: obstacles to access, limits on content, and violations of user rights. FH produces a report for each country which includes a narrative on these aspects of internet freedom, based on materials and research from international experts. A major issue with this data set is the limited number of countries covered. DSP offers an advantage regarding coverage both in time and number of countries and so would offer a substantial value-added for scholars and policymakers. We have designed two independent methods for assessing the DSP in comparison to FOTN: constructing FOTN values from DSP indicators and generating DSP indicators based on the FOTN narrative analyses.
Constructing FOTN from DSP
In this section, we leverage the theoretical framework of the FOTN report in conjunction with our DSP indicators in order to perform a validity assessment of the new dataset. In short, we map DSP indicators onto the component questions of the FOTN framework in order to construct a faux FOTN measure with FH’s theory, but our data. By comparing the alternate measure with the original, we can assess whether our indicators perform comparably, and could therefore provide equivalent measurement for the countries and years not covered by the FOTN data. In the context of the McMann et al. framework this is combination of assessing content validity (by assessing whether the content covered in FOTN can be mapped onto DSP indicators) and convergent validity (by testing whether the aggregated measures are comparable).
To compare these two datasets, we use the DSP data to operationalize Freedom House’s theory, i.e. we use the aggregation scheme described in the Methodology document provided by FH. The FOTN combined score of 100 is arrived at by combining expert-assigned scores on 20 questions grouped along three sub-dimensions: Obstacles to Access; Limits on Content; and Violations of User Rights. We map each of those individual questions onto one DSP indicator, which matches best the spirit of the FH questions, even if sometimes an exact match is not available. We then use Freedom House’s aggregation formula for generating a new “Freedom on the Net” score as well as its sub-dimensions. More specifically, the creators of the FH indices have assigned an arbitrary weight for each question. These scores are in turn added together to arrive at the final FOTN measure. After choosing the most appropriate question from the DSP survey, we rescale the DSP data to match the range assigned by FH, and then we reproduce the FOTN index and its three sub-indices with DSP data.
Supplemental table 1 in Appendix B shows how we mapped each of the questions. For example, to operationalize the first indicator from the Limits on Content index: Does the state block or filter, or compel service providers to block or filter, internet content?, we use the DSP indicator Government Internet filtering in practice (v2smgovfilprc). Supplemental table 2 in Appendix B shows the descriptive statistics of both the original FH indices, and the reproduction with DSP data, as well as the correlation between the measures. It is encouraging to see that the correlations are very high, all above .7. The original FOTN total score correlates with the newly produced DSP index at 0.876.
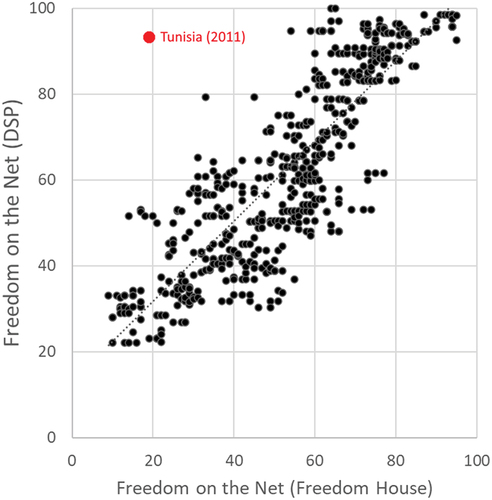
Finally, let us look at some descriptive graphs to better illustrate the data. In , we show a scatterplot between these two measures for all available years for all countries – from 2009 to 2020. This figure shows clearly the high correlation between the two measures, with only a handful of cases that show substantial discrepancy from the linear fit line. The most substantially different value (marked in red) with a FOTN value of approximately 20 and a DSP calculated value of about 75 is an exception that proves the rule. This data point is Tunisia for 2011, the year in which the Jasmine Revolution occurred in January. The DSP data picks up the liberalization of the Tunisian internet early in the year, while FOTN does not pick it up until 2012 due to the timing of publication.
Figure 6. Scatterplot between the original freedom on the net index and the reproduced measure with DSP indicators (all years: 2009–2020).
is a scatterplot between the original FOTN index (x-axis) and the reproduced measure with DSP indicators (y-axis) for the first and last years available from Freedom House − 2009 and 2020. The dotted line is a linear fit prediction between the two measures. We see that there is a very good fit between the two measures for both years with relatively few deviations. Looking at the right-hand side of the figure, which plots the data for 2020, we see that highest scoring countries are Estonia, Sweden, Iceland. Similarly, at the low end of the graph, both the DSP data and FH converge in assigning the lowest scores for Cuba, China, and Iran.
Figure 7. Scatterplot between the original freedom on the net index and the reproduced measure with DSP indicators (2009 and 2020).
On the left-hand side, the data is for the year 2009. Even though the number of countries is substantially reduced due to Freedom House’s more limited coverage, the general patterns remain with very high convergence between the two measures. Egypt shows the most significant discrepancy, with FH’s score being 55, while DSP rates Egypt’s Internet freedom with a score of 34.5. However, the rank ordering of countries is nearly identical: with Egypt being 5th worst on the original FOTN measure, and 4th worst on the reconstructed one.
Overall, this provides strong evidence that DSP indicators are capable of reproducing the FOTN measures within FOTN’s own theoretical framework, and should be seen as a way to apply that theory to a comprehensive set of countries and years.
Constructing DSP indicators from FOTN narratives
In order to further assess the convergent validity of the DSP data with the FOTN data (Freedom House 2020), we asked a MA-level research assistant to independently read the FOTN reports and then answer the DSP questions informed only by the FOTN reports. This tests whether our worldwide expert pool converges on the same conclusions as the FOTN experts who write the analytic narratives of the state of internet freedom in each country. Following best practices, this RA was not previously familiar with either the DSP data or the cases in question, so she was “blind” to any input except for the FOTN reports.
This RA has completed this process for every country covered by FOTN from 2009 to 2021, accounting for all 35 DSP indicators across 676 country-years.Footnote2 Our coding instructions were that if the RA could not confidently select a DSP rating for a particular question, she was to mark all Likert scale ratings that could apply as a rough quantification of uncertainty.
As a first convergent validation step using these data, we calculated the correlation between DSP variables and the RA-coded DSP variables. Out of 33 indicators (we exclude the 2 non-Likert scale indicators in this exercise), all of them are correlated with a p-value of 0.05 or lower, with the exception of Online Media Fractionalization (p = .15) (see Supplemental table 3). However, the correlation coefficients range between 0.06 (for Online Media Fractionalization) and 0.72 (for Government Internet Filtering), which indicates the alignment between the two datasets in terms of conceptual overlap varies across the DSP indicators. To understand the nature of discrepancy, we compare the “nearly-correct” values with one point off to account for uncertainty, and we explore which indicators and countries perform relatively worse than others.
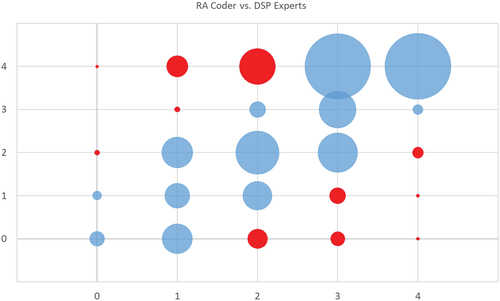
First, we compare in aggregate across all indicators the RA coded versus the DSP expert values. This is shown in , which is a bubble chart in which the area of the circles in each permutation is proportionate to the number of observations. Encouragingly, the bulk of the data is compressed into the diagonal where RA and DSP agree precisely. Of the 18,852 country-year-indicator observations in this exercise, 6,249 (33%) are exactly the same, and an additional 7,782 (41%) are a single point off. Since the actual DSP coding process involves a minimum of five coders whose scores are aggregated, a 1-point shift in the Likert scale is a reasonable approximation of “nearly correct” values in this exercise.
Figure 8. Count of RA coded values versus DSP coded values, 2009–2021.
Of the 4,821 (26%) of data points that are off by more than a point, there are clear patterns both in countries and types of indicator. Just six indicators represent over 50% of the misses, with “Organization of Offline Action by Elites” (v2smorgelitact) representing a full 10% by itself. The other misses are dominated by the DSP indicators that likewise focus on elite or party specific indicators such as “Party dissemination of false information abroad” and “domestic” (v2smparab and v2smpardom) and “Political parties hate speech” (v2smpolhate). There is also a clear correlation with our RA’s stated uncertainty variable, with these indicators representing nearly 40% of the instances where she stated a range rather than a specific value on the Likert scale. The overall analysis of the discrepancies points to the FOTN narratives simply not covering these substantive aspects in enough detail to reliably code DSP variables.
The best performing indicators in this exercise were several “in practice” variables (as opposed to capacity variables) such as likelihood of being arrested for online activity (v2smarrest), government social media censorship in practice (v2smgovcenprc), and use of social media to organize offline violence (v2smorgviol). Those three variables were coded within one point of the DSP values by our RA 91%, 92%, and 94% of the time.
The pattern of misses by country is stark. Of the 65 countries that our RA coded from FOTN narratives, the 34 least accurately coded only contain three countries not in the Global South. And two of those three – Ukraine and Belarus – are post-Soviet cases. Virtually every OECD country is in the ranks of the most accurately coded. It is difficult to ascertain and test which dataset is “correct” in these instances, but DSP experts largely are natives and/or residents of the countries that they code, while FOTN uses a more centralized process. It is plausible that the concentration of discrepancies in the global south reflects the fact that DSP coders have more case-specific information than is available to FOTN.Footnote3
Case study
Finally, we will use two case studies in order to evaluate how well DSP indicators capture the detailed nuances present in country case studies. This exercise demonstrates that scholars can use DSP data to take the thick theoretical work of single-case studies, and reliably operationalize their core concepts into large-n cross-country work.
The case of China
For our first case study, we selected China because it is a well-studied case of digital authoritarianism (Kendall-Taylor, Frantz, & Wright, Citation2020; Wilson, Citation2016). China represents an “easy” validation case, making it a reasonable face validity test in that we can assess whether DSP indicators correctly reflect the well understood state of digital politics in China.
We focus on the three well-known studies of aspects of Chinese digital authoritarianism by King, Pan, and Roberts (Citation2013, Citation2014, Citation2017), in order to evaluate how well DSP indicators capture the ground truth of this case.
The Chinese government allows online media to proliferate and the populace uses such media widely. Nearly half of the population has access to internet and two out of every 10 Chinese actively use Weibo (Qin, Strömberg, & Wu, Citation2017). This is measured in the DSP dataset by the variable v2smonex (“Existence of domestic online media”), which in 2020 had a maximum ordinal value of 3.
King, Pan, and Roberts’ work demonstrates that the censorship program promoted by the Chinese government is aimed to suppress those posts that are specifically aimed toward social mobilization. The authors analyze several posts from social media websites, which are deemed potentially contentious, before the Internet Content Providers or the Chinese government take them down. They then examine which types of posts face censorship.
According to King, Pan, and Roberts, the Chinese government allowed social media to flourish in the country but with a few key restrictions. People were free to post criticism against the government and its policies as long as such posts did not have the potential to lead to collective action. Thus, the government permitted posts which reflected negatively upon the government, giving a false impression of freedom of speech to people, while in reality it exercised tight control and removed any type of discussion online that related to mass mobilization.
The Chinese government follows a threefold approach to monitor and censor content on the internet. First, they surveil people’s social media posts to gauge their mood to understand whether people are unhappy with the regime, and oftentimes, the regime acts swiftly to address the expressed problems (Hassid, Citation2015). This is captured in the DSP dataset through the variable v2smgovsmmon (“How comprehensive is the surveillance of political content in social media by the government or its agents? ”), which in 2020 had the most extreme value of 0 – “Extremely comprehensive.”
Second, the government censors any specific content that is considered a threat to their political stability. This includes any controversial photos, videos, micro-blogging service posts and foreign news sites. In practice, the government mandates that Internet Service Providers (ISP) censor any sensitive or controversial information. For example, the estimated extent of censorship of Sina Weibo ranges from 0.01% of posts by a sample of prioritized users, including dissidents, scholars, journalists, and VIP users to 13% of posts on selected sensitive topics (Fu, Chan, & Chau, Citation2013). For the DSP dataset, country experts coded the extent to which the government censors political content on social media in practice. This is captured by the variable v2smgovsmcenprc defined as government social media censorship in practice. On a scale of 0–4, China ranks 2 or “sometimes” which is consistent with the theory that the government will allow posts that may criticize the government but not those that have potential to lead to mass mobilization.
We further assess average people’s use of social media to organize offline action through the variable v2smorgavgact. The DSP data indicates that China ranks 2 or “sometimes” on a scale of 0–4. Protests on issues like corruption and pollution are relatively common in China. It also aligns well with their information problem as authoritarian regimes may expect and welcome substantively narrow protests as a way of enhancing regime stability by identifying, and then dealing with, discontented communities (Chen, Citation2012).
Third, government exercises a massive and consistent campaign of astroturfing, with paid actors posting regime friendly disinformation in a coordinated manner. This is captured in DSP by v2smgovdom or “government dissemination of false information.” Country experts were asked to rate on a scale of 0–4 on how often the government and its agents use social media to disseminate misleading viewpoints to influence its own population. China ranks 0 or “Extremely often. The government disseminates false information on all key political issues.” In keeping with China’s reputation as a leader in these technologies, they rank among the five worst countries in the world on this indicator.
This three-pronged approach is made possible by a number of different cyber capacities. According to King et al., the task of censorship in China is a collaboration between government agencies, leaders, and different levels of government. This is captured in the DSP data by the variable v2smgovsmalt or government social media alternatives. In the DSP dataset, China receives a “0” on of a scale of 0–4 or “Essentially all social media usage takes place on platforms controlled by the state.” The DSP data also captures the extent to which government is directly involved in taking down sensitive information using the variable v2smregapp or government online content regulation approach. One a scale of 0–4, China receives a “1” or “most online content monitoring and regulation is done by the state, though the state involves private actors in a limited way.” This reflects the well-documented state-led regulation of the internet by the Chinese government.
One of the limitations of the research by King et al. is that they have no data on whether dissent leads to arrests. There have been a significant number of news articles on arrests of journalists and political activists in China, but little quantitative operationalization. The DSP variable v2smarrest or “arrests for political content” captures this. On a scale of 0–4, China ranks 0 or “Extremely likely.” While this is unsurprising, the availability of this indicator worldwide and over time is a valuable addition to our ability to generalize the quantification of this authoritarian toolkit.
In sum, the DSP data contains measurements directly quantifying each of the aspects of China’s well-studied state control of social media. While China is extensively studied, it is nonetheless useful to establish that the DSP data generation process produces estimates that reflect broad scholarly understanding of the case. Assuming that the pool of DSP/V-Dem experts behaves reasonably similarly across cases, we would expect this ability to effectively measure this authoritarian toolkit to extend across the dataset. This contention certainly relies on strong assumptions, but we find the above analysis a useful starting point, especially in conjunction with the broader content and convergent macro-validity analyses.
The case of Ethiopia
Our second case is Ethiopia, selected both because it is a much less well-known case of digital politics and because it is the case that Freedom House and DSP are most in disagreement over in the two macro validity exercises performed earlier. In the construction of FOTN from DSP indicators, Ethiopia’s score had the highest average residual among all countries. In the construction of DSP indicators from FH narratives, Ethiopia was the 5th least accurate country coded by the RA. It is the only country to be in the bottom five of both exercises. This makes Ethiopia a “hard” validation case.
If we pull apart the total FOTN measure from DSP and Freedom House and examine the difference year by year for Ethiopia, we can see a distinct pattern. In Supplemental table 6 in Appendix B, we present the differences for each year, and can easily see that the bulk of the variance is deriving from the Obstacles to Access sub-category. On average, Obstacles to Access across all countries is 2.1 points higher, Limits on Content 3.4 points higher, and Violations of User Rights 7.7 points higher. The re-normalized residuals are presented for each year and category in the “Norm” column.
Note that when normalized, the Limits on Content and Violations of User Rights categories only represent a total difference on average of 7.3 points on the hundred-point scale, while Obstacles to Access is 15 by itself. In fact, not one country-year for Ethiopia in the Limits on Content and Violations of User Rights categories ranks in the top 25 for highest residuals across all countries, while the 10 years of Ethiopia in Obstacles to Access are the 2nd through 11th country-years with highest residuals (first is 2011 Tunisia, which was discussed earlier as being idiosyncratically affected by the timing of Freedom House’s release around the Arab Spring). This points to DSP and Freedom House’s FOTN measures performing almost identically in two of the three categories for this case, but with drastic divergence in a single category. Why is there such divergence on Limits on Content in the Ethiopia case?
When we mapped DSP indicators onto the Freedom House FOTN framework, we used three indicators for the construction of the five sub-measures of the Limits on Content metric: online media existence (v2smonex) for 9 of the 25 points, government internet shutdown in practice (v2smgovshut) for 6 points, and internet legal regulation content (v2smregcon) for 10 points. If we examine how well our RA was able to code these indicators from FH country summaries, we find that the latter two had very few inconsistencies, being off by more than one point in only 4 of the 20 country-indicator years.
However, online media existence was off by two points (despite only having a 3-point scale) in all 10 years for Ethiopia. Recall from Supplemental table 4, that online media existence was the second-best performing indicator we had. Ethiopia represents a full quarter of the inaccuracy for that indicator in the RA coding test.
In short, the systematic and comprehensive difference between DSP and Freedom House with regard to online media existence in Ethiopia accounts entirely for its outlier status. So who is correct? In this case, the answer is both, from a certain point of view.
In the annual qualitative reports summarizing the Freedosm on the Net measures, Ethiopia’s low score in Obstacles to Access focuses on low internet penetration figures from ITU survey data in addition to the high cost of internet access. One could argue that these figures are misleading, with anecdotal evidence on the ground indicating that the survey figures are vastly underrepresenting Ethiopian internet usage (Wilson, Lindberg, & Tronvoll, Citation2021), while also underestimating how a minority using internet news sources relay that information on to others as “bridges.” But one could make similar arguments about much of the developing world.
Specific to Ethiopia though, the FOTN country reports only discuss in passing the specific details of the successful efforts by the Ethiopian opposition online over the last decade. While this includes extensive use of social media for spreading video of repression, it also includes the establishment specifically of online alternative information sources (such as EthioTube and activist Jawar Mohammed’s social media presence). This puts Ethiopia in a unique situation among countries in which it can have de facto lower access rates and prohibitively high costs, while simultaneously being measured by DSP as reaching the highest measure of domestic online media.
This points to Ethiopia primarily being an outlier in that the prevalence of domestic online media is a uniquely bad proxy for the existence of obstacles to access the internet, in a way that does not apply to other countries.
Conclusion
In this article, we overview the DSP dataset – product of a global survey of hundreds of experts. We validate the data against existing cross-national datasets and case studies. The data covers virtually all countries in the world from 2000 to 2021 and measures a set of 35 indicators of polarization and politicization of social media, misinformation campaigns, coordinated information operations, and foreign influence on domestic politics. We expect that the data and the research produced by this project will be of great interest to both the academic and policy communities, at a time when the importance of understanding the political and social consequences of the internet is rapidly increasing.Footnote4
Supplemental Material
Download MS Word (586.3 KB)Supplemental Material
Download MS Word (25.1 KB)Disclosure statement
No potential conflict of interest was reported by the author(s).
Supplementary material
Supplemental data for this article can be accessed online at https://doi.org/10.1080/19331681.2024.2350495
Additional information
Funding
Notes on contributors
Valeriya Mechkova
Valeriya Mechkova is an Assistant Professor at the Department of Political Science, University of Gothenburg, Sweden, and co-PI of the Digital Society Project. Her research interests are in the field of democracy, representation and human development, and internet and politics. She has published in APSR, Democratization, World Development, Comparative Political Studies, among others.
Daniel Pemstein
Daniel Pemstein is a professor of Political Science & Public Policy at North Dakota State University. I’m a comparative political economist and methodologist who studies democratic institutions. I am the co-director of the Digital Society Project, a co-developer of the Unified Democracy Scores, and a co-author of the Scythe Statistical Library. I also serve as project manager for measurement methods for, and sit on the steering committee of, the Varieties of Democracy project.
Brigitte Seim
Brigitte Seim is a scholar of comparative politics, focusing on the political economy of development. She is currently an Associate Professor in the Department of Public Policy, Peter Thacher Grauer Scholar, Adjunct Associate Professor of Global Studies, and Adjunct Associate Professor of Political Science. I am also Project Manager of Experiments for the Varieties of Democracy (V-Dem) Project and a founding Principal Investigator of the Digital Society Project.
Steven. L Wilson
Steven Lloyd Wilson is an assistant professor of politics at Brandeis University, project manager for the Varieties of Democracy Institute, and co-PI of the Digital Society Project. His research focuses on comparative democratization, cyber-security, and the effect of the Internet and social media on authoritarian regimes, particularly in the post-Soviet world.
Notes
1. For the DSP survey, V-Dem first invited from the Media, Civil Society and Judiciary surveys, and recruited additional experts working on Internet and politics specifically.
2. Broken down by year: there were 15 countries in 2009, none in 2010 as there was no FOTN report that year, 37 in 2011, 47 in 2012, 60 in 2013, and 65 in all subsequent years, until 2021 which had 70.
3. See Supplemental Table 4 and Supplemental table 5 in Appendix.
4. n may be less than 676 in cases where the RA was not able to answer the question at all from the available FOTN report, and thus was left null.
References
- Bailard, C. S., & Livingston, S. (2014). Crowdsourcing accountability in a Nigerian election. Journal of Information Technology & Politics, 11(4), 349–367. doi:10.1080/19331681.2014.947056
- Bak, D., Sriyai, S., & Meserve, S. (2018). The internet and state repression: A cross-national analysis of the limits of digital constraint. Journal of Human Rights, 17(5), 642–659. doi:10.1080/14754835.2018.1456914
- Boulianne, S. (2009). Does internet use affect engagement? A meta-analysis of research. Political Communication, 26(2), 193–211. doi:10.1080/10584600902854363
- Boulianne, S. (2015). Social media use and participation: A meta-analysis of current research. Information, Communication & Society, 18(5), 524–538. doi:10.1080/1369118X.2015.1008542
- Brantly, A. F. (2019). From cyberspace to independence square: Understanding the impact of social media on physical protest mobilization during Ukraine’s Euromaidan revolution. Journal of Information Technology & Politics, 16(4), 360–378. doi:10.1080/19331681.2019.1657047
- Bunce, V. J., & Wolchik, S. (2010). Defeating dictators: Electoral change and stability in competitive authoritarian regimes. World Politics, 62(1), 43–86. doi:10.1017/S0043887109990207
- Castells, M. (2009). The information age: Economy, society, and culture. Singapore: Wiley Blackwell.
- Chen, X. (2012). Social protest and contentious authoritarianism in China. New York: Cambridge University Press.
- Coppedge, M., Gerring, J., Knutsen, C. H., Lindberg, S. I., Skaaning, S. … Wilson, S. (2018). “V-Dem methodology v8” varieties of democracy (V-Dem) project. SSRN Electronic Journal. doi:10.2139/ssrn.3172796
- Deibert, R., Palfrey, J. G., Rohozinski, R., & Jonathan, Z. (2008). Access denied: The practice and policy of global internet filtering. Cambridge, MA: MIT Press.
- Diamond, L. (2010). Liberation technology. Journal of Democracy, 21(3), 69–83. doi:10.1353/jod.0.0190
- Dimitrova, D. V., & Bystrom, D. G. (2017). The effects of social media on political participation and candidate image evaluations in the 2012 Iowa caucuses. Journal of Political Marketing, 57(11), 1568–1583. doi:10.1177/0002764213489011
- Dimitrova, D. V., & Jörg, M. (2018). Social media in political campaigning around the world: Theoretical and methodological challenges. Journalism & Mass Communication Quarterly, 95(2), 333–342. doi:10.1177/1077699018770437
- Dowling, M. (2021). Democracy under siege: Foreign interference in a digital era. Australian Journal of International Affairs, 75(4), 383–387. doi:10.1080/10357718.2021.1909534
- Faris, R., & Etling, B. (2008). Madison and the smart mob: The promise and limitations of the internet for democracy. In The fletcher forum of world affairs (pp. 65–85). The Fletcher School of Law and Diplomacy. https://www.jstor.org/stable/45289445
- Farrell, H. (2012). The consequences of the internet for politics. Annual Review of Political Science, 15(1), 35–52. doi:10.1146/annurev-polisci-030810-110815
- Freedom on the net dataset. (2020). https://freedomhouse.org/report/freedom-net.
- Fu, K. W., Chan, C. H., & Chau, M. (2013). Assessing censorship on microblogs in China: Discriminatory keyword analysis and the real-name registration policy. IEEE Internet Computing, 17(3), 42–50. doi:10.1109/MIC.2013.28
- Garrett, R. K., & Resnick, P. (2011). Resisting political fragmentation on the internet. Proceedings of the American Academy of Arts and Sciences, 140(4), 108–120. doi:10.1162/DAED_a_00118
- Gentzkow, M., & Shapiro, J. M. (2011). Ideological segregation online and offline. The Quarterly Journal of Economics, 126(4), 1799–1839. doi:10.1093/qje/qjr044
- Gohdes, A. R. (2018). Reflections on digital technologies, repression, and resistance: Epilogue. State Crime Journal, 7(1), 141–144. doi:10.13169/statecrime.7.1.0141
- Gohdes, A. R. (2020). Repression technology: Internet accessibility and state violence. American Journal of Political Science, 64(3), 488–503. doi:10.1111/ajps.12509
- Goldstein, J. (2007). The role of digital networked technologies in the Ukrainian orange revolution. SSRN Electronic Journal, 14. doi:10.2139/ssrn.1077686
- Hassid, J. (2015). China’s responsiveness to internet opinion: A double-edged sword. Journal of Current Chinese Affairs, 44(2), 39–68. doi:10.1177/186810261504400203
- Henschke, A., Sussex, M., & O’Connor, C. (2020). Countering foreign interference: Election integrity lessons for liberal democracies. Journal of Cyber Policy, 5(2), 180–198. doi:10.1080/23738871.2020.1797136
- Hjortdal, M. (2011). China’s use of cyber warfare: Espionage meets strategic deterrence. Journal of Strategic Security, 4(2), 1–24. doi:10.5038/1944-0472.4.2.1
- Kemp, S. (2019). Digital in 2019. Essential insights into internet, social media, mobile, and ecommerce use around the world. https://wearesocial.com/uk/digital-2019
- Kendall-Taylor, A., Frantz, E., & Wright, J. (2020). The digital dictators: How technology strengthens autocracy. Foreign Affairs, 99, 103.
- King, G., Pan, J., & Roberts, M. J. (2013). How censorship in China allows government criticism but silences collective expression. American Political Science Review, 107(2), 326–343. doi:10.1017/S0003055413000014
- King, G., Pan, J., & Roberts, M. J. (2014). Reverse-engineering censorship in China: Randomized experimentation and participant observation. Science, 345(6199). doi:10.1126/science.1251722
- King, G., Pan, J., & Roberts, M. J. (2017). How the Chinese government fabricates social media posts for strategic distraction, not engaged argument. American Political Science Review, 111(3), 484–501. doi:10.1017/S0003055417000144
- Krekel, B., Adams, P., & Bakos, G. (2014). Occupying the information high ground: Chinese capabilities for computer network operations and cyber espionage. International Journal of Computer Research, 21(4), 333.
- Kyj, M. J. (2006). Internet use in Ukraine’s orange revolution. Business Horizons, 49(1), 71–80. doi:10.1016/j.bushor.2005.06.003
- Manacorda, M., & Tesei, A. (2020). Liberation technology: Mobile phones and political mobilization in Africa. Econometrica, 88(2), 533–567. doi:10.3982/ECTA14392
- Marquardt, K. L., & Pemstein, D. (2018). IRT models for expert-coded panel data. Political Analysis, 26(4), 431–456. doi:10.1017/pan.2018.28
- McGregor, S. C. (2020). “Taking the temperature of the room” how political campaigns use social media to understand and represent public opinion. Public Opinion Quarterly, 84(1), 236–256.
- McMann, K., Pemstein, D., Seim, B., Teorell, J., & Lindberg, S. I. (2021). Assessing data quality: An approach and an application. Political Analysis, 30(3), 426–449. doi:10.1017/pan.2021.27
- Meserve, S. (2018). Why do governments censor? Expanding from state survival to content regulation theories in political science. APSA Comparative Politics Newsletter, 18(2), 55–59.
- Meserve, S. A., & Pemstein, D. (2018). Google politics: The political determinants of internet censorship in democracies. Political Science Research and Methods, 6(2), 245–263. doi:10.1017/psrm.2017.1
- Morozov, E. (2012). The net delusion: The dark side of internet freedom. New York: Public Affairs.
- Murthy, D. (2018). Introduction to social media, activism, and organizations. Social Media + Society, 4(1), 205630511775071. doi:10.1177/2056305117750716
- Page, S. E. (2008). The difference: How the power of diversity creates better groups, firms, schools, and societies. Princeton, NJ: Princeton University Press.
- Pemstein, D., Marquardt, K., Tzelgov, E., Wang, Y., Krusell, J., & Miri, F. (2018). The V-Dem measurement model: Latent variable analysis for cross-national and cross-temporal expert-coded data. SSRN Electronic Journal. doi:10.2139/ssrn.3167764
- Pierskalla, J. H., & Hollenbach, F. M. (2013). Technology and collective action: The effect of cell phone coverage on political violence in Africa. American Political Science Review, 107(2), 207–224. doi:10.1017/S0003055413000075
- Qin, B., Strömberg, D., & Wu, Y. (2017). Why does China allow freer social media? Protests versus surveillance and propaganda. Journal of Economic Perspectives, 31(1), 117–140. doi:10.1257/jep.31.1.117
- Roberts, M. E. (2018). Censored: Distraction and diversion inside China’s great firewall. Princeton: Princeton University Press.
- Schlozman, K. L., Verba, S., & Brady, H. E. (2010). Weapon of the strong? Participatory inequality and the internet. Perspectives on Politics, 8(2), 487–509. doi:10.1017/S1537592710001210
- Shirky, C. (2009). Here comes everybody: The power of organizing without organizations. London: Penguin.
- Smidi, A., & Shahin, S. (2017). Social media and social mobilisation in the middle east: A survey of research on the Arab spring. India Quarterly, 73(2), 196–209. doi:10.1177/0974928417700798
- Stepanova, E. (2011). The role of information communication technologies in the Arab Spring. Ponars Eurasia, 15, 1–6.
- Sunstein, C. R. (2009). Republic.com 2.0. Princeton: Princeton University Press.
- Tucker, J. A., Nagler, J., MacDuffee, M., Metzger, P. B., Penfold-Brown, D., & Bonneau, R. (2016). Big data, social media, and protest. Computational Social Science, 199–225.
- Tufekci, Z. (2017). Twitter and tear gas: The power and fragility of networked protest. New Haven: Yale University Press.
- Vaccari, C., Valeriani, A., Barberá, P., Bonneau, R., Jost, J. T., Nagler, J., & Tucker, J. A. (2015). Political expression and action on social media: Exploring the relationship between lower-and higher-threshold political activities among Twitter users in Italy. Journal of Computer-Mediated Communication, 20(2), 221–239. doi:10.1111/jcc4.12108
- Wahlström, M., & Törnberg, A. (2021). Social media mechanisms for right-wing political violence in the 21st century: Discursive opportunities, group dynamics, and co-ordination. Terrorism and Political Violence, 33(4), 766–787. doi:10.1080/09546553.2019.1586676
- Warren, T. C. (2015). Explosive connections? Mass media, social media, and the geography of collective violence in African states. Journal of Peace Research, 52(3), 297–311. doi:10.1177/0022343314558102
- Wilson, S. L. (2016). Information and revolution [ PhD thesis]. University of Wisconsin-Madison.
- Wilson, S. L. (2017). Detecting mass protest through social media. Journal of Social Media in Society, 6(2), 5–25.
- Wilson, S. L., Lindberg, S. I., & Tronvoll, K. (2021). The best and worst of times: The paradox of social media and ethiopian politics. First Monday, 26(10). https://firstmonday.org/ojs/index.php/fm/article/view/10862
- Zhuo, X., Wellman, B., & Yu, J. (2011). Egypt: The first internet revolt? Peace Magazine, 27, 6–10.
- Zittrain, J. (2003). Internet points of control. Boston College Law Review, 44, 653–688. doi:10.2139/ssrn.388860