ABSTRACT
Chronic wasting disease (CWD), the only known wildlife prion disease, affects deer, elk and moose. The disease is an ongoing and expanding problem in both wild and captive North American cervid populations and is difficult to control in part due to the extreme environmental persistence of prions, which can transmit disease years after initial contamination. The role of exogenous factors in CWD transmission and progression is largely unexplored. In an effort to understand the influence of environmental and dietary constituents on CWD, we collected and analyzed water and soil samples from CWD-negative and positive captive cervid facilities, as well as from wild CWD-endozootic areas. Our analysis revealed that, when compared with CWD-positive sites, CWD-negative sites had a significantly higher concentration of magnesium, and a higher magnesium/copper (Mg/Cu) ratio in the water than that from CWD-positive sites. When cevidized transgenic mice were fed a custom diet devoid of Mg and Cu and drinking water with varied Mg/Cu ratios, we found that higher Mg/Cu ratio resulted in significantly longer survival times after intracerebral CWD inoculation. We also detected reduced levels of inflammatory cytokine gene expression in mice fed a modified diet with a higher Mg/Cu ratio compared to those on a standard rodent diet. These findings indicate a role for dietary Mg and Cu in CWD pathogenesis through modulating inflammation in the brain.
INTRODUCTION
Chronic wasting disease (CWD), the only known wildlife prion disease, is a progressive fatal neurodegenerative disease that is transmitted in the absence of nucleic acids by infectious proteinacious particles that resists protease digestion (PrPRes).Citation1 Efficient transmission occurs directly from animal-to-animal,Citation2 and indirectly via the environment.Citation3 Brain pathology includes PrPCWD plaques, neuroinflammation, and spongiform degeneration Citation4. Since its recognition in the 1960s, CWD has become a persistent problem in both wild and captive populations of North American cervids (deer, elk and moose), has spread to 22 states in the USA and 2 Canadian provinces and shows no sign of stopping. Once established, prevalence rates can be as high as 50% in deer, leading to an overall decrease in cervid populations.Citation5,6 The presence of CWD has been catastrophic to the captive cervid industry, often requiring the culling of entire herds. The disease is difficult to control in part because prions are able to remain infectious in the environment and transmit disease years after contamination, providing an ongoing reservoir for indirect CWD transmission.Citation7-10 There are currently no treatments or preventatives available for CWD or any other prion disease.
Multiple studies have suggested that essential micronutrients, such as copper (CuCitation2+) and manganese (MnCitation2+), may have an influence on the conversion of PrPC to PrPRes,Citation11-14 with Cu2+ chelation resulting in delayed prion disease onset.Citation15 Copper is a normal ligand for PrPC, and Mn2+ has been shown to actively compete for Cu2+ binding sites on PrPC.Citation16-19
To understand the role of environmental and dietary constituents on CWD infection and pathogenesis, we collected and analyzed water and soil samples from CWD-positive and negative captive cervid facilities, as well as from CWD-enzootic wild areas. Our analysis revealed that water from CWD-negative sites had significantly higher magnesium [(Mg)/Cu, Mg/Mn, and Mg/iron (Fe)] ratios than water from CWD-positive sites, with the Mg/Cu ratio having the most significant relevance. The levels Mg in the water were higher on negative sites and Cu, Mn, and Fe were all lower on negative sites, although not statistically significant. To further assess the roles of Mg and Cu in CWD disease progression, a bioassay was conducted in which transgenic mice expressing elk PrP (Tg 12) were fed a custom diet devoid of Mg and Cu in combination with drinking water containing a spectrum of Mg/Cu ratios. Because the environmental Mg/Cu ratio had the highest significance, it was selected to be the focus of this study. Our results demonstrate that after intracerebral CWD inoculation, (1) Tg 12 mice on diets with the highest Mg/Cu ratio and lowest Cu concentration had significantly longer survival times those on lower Mg/Cu rations and higher levels of Cu; (2) Tg 12 mice on a high Cu diet produced significantly higher levels of several inflammatory cytokines when compared to mice on a low Cu diet; (3) Tg 12 mice on a diet with an optimal Mg/Cu ratio showed a lower expression of inflammatory genes when compared with mice on a standard rodent diet. Our findings are consistent with the hypothesis that the observed increase in survival time in mice on diets with high Mg/Cu ratios is due to a decrease in neuroinflammation, a hallmark of prion diseases,Citation20,21 since Mg has been shown to decrease neuroinflammation,Citation22 while copper does the opposite.Citation23,24
RESULTS
Environmental Samples - ICP Soil Analysis
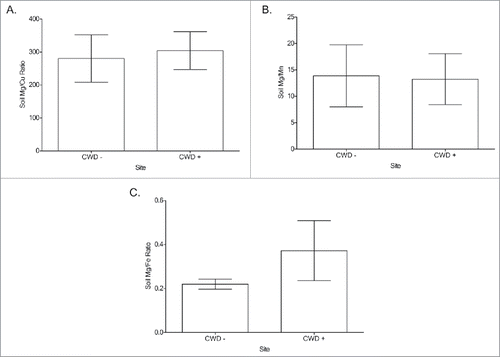
Soil levels of copper (Cu), manganese (Mn), magnesium (Mg), and Iron (Fe) were compared between CWD-positive and CWD-negative locations. No significant difference between sites was found in either the levels of each individual cation () or the ratios of Mg/Cu, Mg/Mn, and Mg/Fe ().
FIGURE 1. ICP-MS soil concentrations (ppb- parts per billion) of Mg (A), Cu (B), Fe (C) and Mn (D) from captive white-tailed deer and elk locations (n =16). No significant difference in cation concentration was detected between CWD-positive and CWD-negative locations (Two-tailed Student's T-test, α = 0.05) Mg (p = 0.719), Cu (p = 0.580), Fe (p = 0.335) and Mn (p = 0.732).
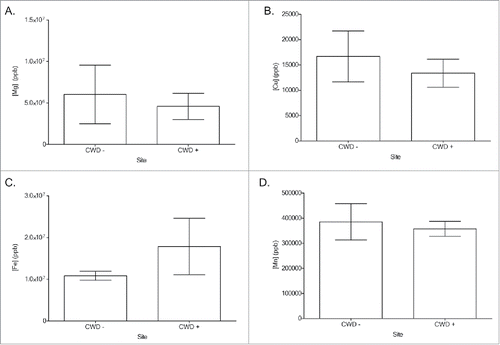
FIGURE 2. Soil Mg/cation ratio comparisons between CWD-positive and CWD-negative locations Mg/Cu (A), Mg/Mn (B), Mg/Fe (C) from captive white-tailed deer and elk locations. No significant difference was detected between any of the groups (Two-tailed Student's T-test, α = 0.05). Mg/Cu (p = 0.803), Mg/Mn (p = 0.936), Mg/Fe (p = 0.304).
Soil Composition Analysis
Analysis was done to determine if soil composition differed between sites, and no significant difference was detected in the relative amount of organic matter, quartz, silt, and clay ().
TABLE 1. Soil composition (by percent) at CWD-positive and negative sites. There was no statistically significant difference in composition between positive and negative sites (2-tailed Student's T-test, α = 0.05).
Environmental Samples - ICP Water Analysis
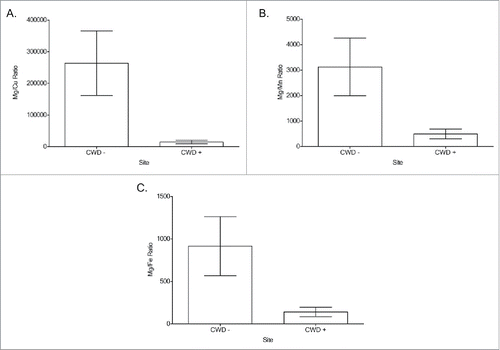
ICP-MS analysis of water from the study locations revealed no statistically significant differences in individual Mg, Cu, Mn and Fe concentrations. However, with the exception of Mg, the metal cation concentrations tended to be higher on CWD-positive sites (). When Mg/Cu, Mg/Mn and Mg/Fe ratios were calculated, CWD-negatives sites all had significantly higher ratios than CWD-positive sites ().
FIGURE 3. ICP-MS water concentrations (ppb = parts per billion) of Mg (A), Cu (B), Mn (C) and Fe (D) from captive white-tailed deer and elk locations. No significant difference in cation concentration was detected between CWD-positive and CWD-negative locations (Two-tailed Student's T-test, α = 0.05). Mg (p = 0.109) Cu (p = 0.227), Mn (p = 0.323), and Fe (p = 0.271).
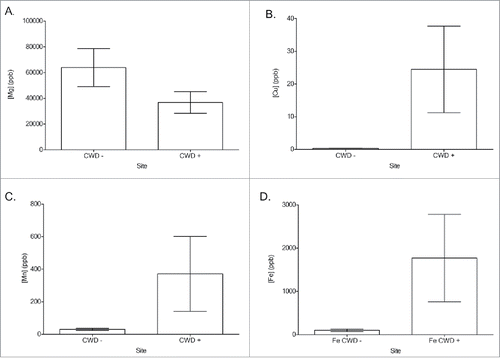
FIGURE 4. Water Mg/cation ratio comparisons between CWD-positive and CWD-negative locations Mg/Cu (A), Mg/Mn (B), Mg/Fe (C) from captive white-tailed deer locations. A significant difference (*) was detected between all groups, with CWD-negative locations having greater Mg/cation ratios (Two-tailed Student's T-test, α = 0.05). Mg/Cu (p = 0.003), Mg/Mn (p = 0.007), Mg/Fe (p = 0.008).
Transgenic Mouse Bioassay - Intracerebral Inoculation
Survival
TG 12 mice IC inoculated with CWD were euthanized when they became symptomatic. Disease status was confirmed by Western blot analysis (data not shown). Mice fed the custom diet with the highest Mg/Cu drinking water ratio and the lowest concentration of Cu in drinking water, (Group D), lived significantly longer (average 136 days) than those on custom diets with more Cu (average 125–128 days) ().
TABLE 2. Survival time comparisons between test groups inoculated intracerebrally (IC) with chronic wasting disease. (A) Median survival times, days post inoculation (DPI) Mg/Cu ratio, and MG and Cu concentration of each CWD-positive treatment group (B). Statistical comparisons between CWD-positive treatment groups. Group D lived significantly longer than several other groups. ppb= parts per billion, * = significantly different. (Log-Rank test, α ≤ 0.05)
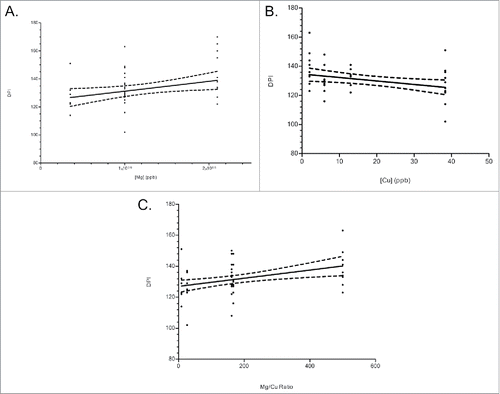
To examine the role of the individual cations and Mg/Cu ratio in increased survival time, survival times were plotted against cation concentration or Mg/Cu ratio. Increased survival time was associated with increased Mg concentration and Mg/Cu ratio, and with decreased Cu concentration (). Although difficult to compare, the Mg/Cu ratio had the greatest slope (0.02600) as compared to Mg alone (0.00007) and Cu (−0.00023).
FIGURE 5. Survival times (DPI-days post inoculation) versus Mg, Cu, or Mg/Cu ratio concentrations in CWD+ mouse diet. (A) Mg concentrations low to high, (B) Cu concentrations, low to high (C) and Mg/Cu expressed as a ratio, low to high. The Mg/Cu ratio showed the most positive influence on survival time (slope: 0.02600), followed by the negative influence of Cu (slope: −0.00023), and a modest increase on survival time by Mg (slope: 0.00007).
Mouse Brain ICP-MS
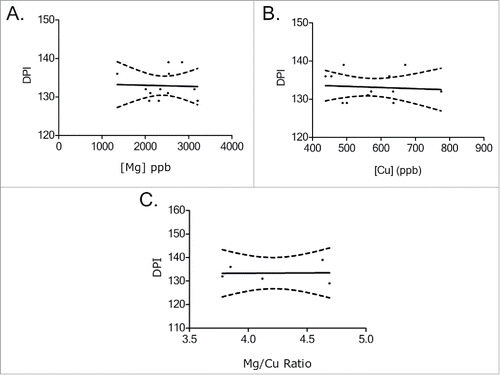
Mass spectrometry analysis showed that the concentration of Cu in the brains of CWD-negative and CWD- positive mice from the same treatment group were not significantly different, demonstrating that CWD status did not affect the amount of detectable Cu in the brain (). In contrast, significantly higher Mg levels were observed in CWD- positive mice from group A (). The Mg/Cu ratio between CWD-negative and CWD-positive mice was significantly different only in group A, with the CWD-positive mice having a higher ratio (). The concentrations of Mg, Cu, and the ratio of Mg/Cu in the brains at terminal stage CWD-positive mice appeared to remain constant, regardless of survival time ().
FIGURE 6. ICP-MS analysis of mouse brains from each group. (A) Cu concentration comparisons between CWD-negative (−) and CWD-positive (+) mice from each treatment group. (B) Mg concentration comparisons between CWD- and CWD+ mice from each treatment group. (C) Mg/Cu ratio comparisons between CWD- and CWD+ mice from each treatment group. ppb = parts per billion. * = significantly different from matched CWD- matches. (Student's one-tailed T-test, α ≤ 0.05.)
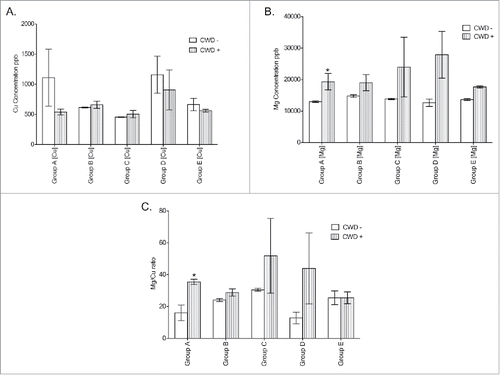
FIGURE 7. Survival times (DPI-days post inoculation) vs. ICP brain concentrations in CWD+ mice. (A) Mg concentrations low to high, (B) Cu concentrations, low to high (C) and Mg/Cu expressed as a ratio, low to high. The concentrations of Mg, Cu, or the Mg/Cu ratio found in study mouse brains did not appear to vary between survival times.
RT-PCR
Mice fed the custom diet with the highest drinking water Cu/Mg ratio, group D, showed differential gene expression (>2 -fold change) from mice fed the standard 5001 diet and water, group E. Both CWD-positive time points (60 DPI and terminal disease) from group D, as well as from CWD-negative animals, were compared to the CWD-negative and positive time points from group E. Comparison of negative controls between each group did not show much differentiation in gene expression, with group D having 2 genes increased, and 3 decreased, as compared to group E (, ). Comparison between group E negative controls and group E, 60 DPI CWD-inoculated mice showed alterations in 14 genes, with 4 up-regulated, and 10 down-regulated (, ) as compared to negative controls. The group E terminal mice had 9 genes upregulated and 6 downregulated, as compared to the group E negative controls (, ). Although the numbers of altered genes is similar, there were only 4 genes in common between the 2 time points. Group D, 60 DPI CWD-inoculated mice showed alterations in 7 genes, with one up-regulated, and 6 down-regulated as compared to group E negative controls (, ). In contrast, the group D terminal mouse comparisons had 13 altered genes, with 4 upregulated and 9 downregulated (, ). The two group D time points had 2 common altered genes. Group D, 60 DPI mice only shared 4 genes in common with group E, 60 DPI. Terminal mice from groups D and E shared 7 genes in common (ccl-19, ccl-3, ccl-9, csf2, IL13, Tnfsf-11, Tnfsf-13). The most striking difference between time points is at 60 DPI, where group D had far fewer gene alterations than group E.
FIGURE 8. RT-PCR differential gene expression comparing CWD-infected mice from treatment groups D and E to CWD-negative control mice from group E. CWD-inoculated animals given higher Cu (ppm), group E, had a greater number of gene expression alterations (14 > 2-fold) at 60 d post inoculation (DPI), and at terminal disease (15 >2-fold) (A) than group D, which had 7 altered genes at 60 DPI and 13 at terminal disease (B). Although similar in number, the genes altered at terminal disease were different between groups E and D.
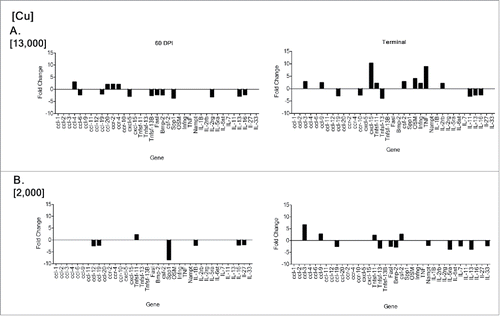
TABLE 3. Gene alterations >2-fold by comparison group. Table shows gene abbreviation and full name. CWD- = CWD-negative animals, CWD+ = CWD-positive animals
To determine if differential gene expression was associated with disease within group D, CWD-negative group D control mice were compared to both 60 DPI and terminal group D mice. This comparison revealed only 2 gene alterations at 60 DPI (, ), but 13 alterations at terminal disease (, ).
FIGURE 9. RT-PCR differential gene expression comparing CWD-infected group D time points to the CWD-negative controls from group D. At 60 DPI, mice showed little differentiation from control animals (A). At terminal disease there was an increase in gene alterations with 13 exhibiting > 2-fold change (B). (20X magnification.)

Immunohistochemistry
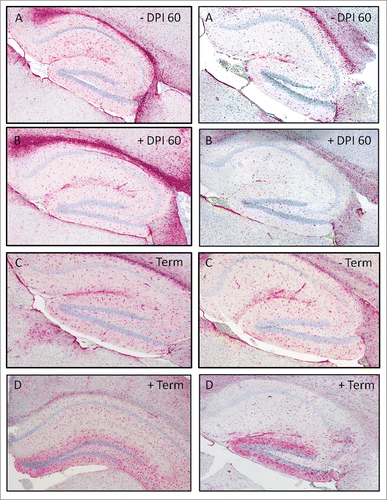
Glial fibrilary acidic protein (GFAP) staining in the hippcampus was compared between groups D and E. The hippocampus was selected for comparison, as it was the most affected brain region in CWD mouse studies conducted in this laboratory. Others have noted the presence of PrPCWD staining in the hippocampus, however the pattern was different possibly due to differences in inoculum.Citation25,26 None of the CWD-negative controls for groups D or E (data not shown) showed any staining for PrPCWD amyloid plaques. Plaques were visible at DPI 60 in both groups (data not shown), with group D appearing to have more staining. At terminal disease plaques could be seen in both groups.
All groups showed GFAP expression in the hippocampus, however group E had more staining at DPI 60 ().
Protein Expression
We next investigated whether the increases in transcripts encoding chemokines and their receptors and inflammatory cytokines in mice fed high Cu diets translated into increased expression of cognate inflammatory cytokines. We simultaneously measured levels of 11 cytokines in brains from mice fed a high Cu diet (E) or low Cu diet (D). Of the inflammatory cytokines analyzed, we detected significant increases of IFNγ and IL-1β in brains of mice fed a high Cu diet and terminally ill with CWD over mock-infected controls, whereas mice fed a high Cu diet and terminally ill with CWD over mock-infected controls, whereas mice fed a low Cu diet exhibited no increase in IFNγ and a significant decrease of IL-1β at 60 DPI and terminal disease (Fig. 11).
FIGURE 11. Dietary Copper potentiates prion-induced neuroinflammation. Brains from prion-infected mice fed a high Cu diet (solid line connecting squares) or low Cu diet (dotted line connecting dots) were analyzed at 60 DPI or terminal disease for the indicated cytokine production compared to mock-infected control mice fed the same diet (A-G). Data are expressed as fold-change ratios compared to mock infected controls. *, p < 0.05 comparing cytokine changes of high versus low Cu-fed mice at the same time point. **, p < 0.01 comparing cytokine changes of high vs. low Cu-fed mice at the same time point. **, p < 0.01 comparing cytokine levels at 60 DPI to terminal disease of mice fed the same diet.
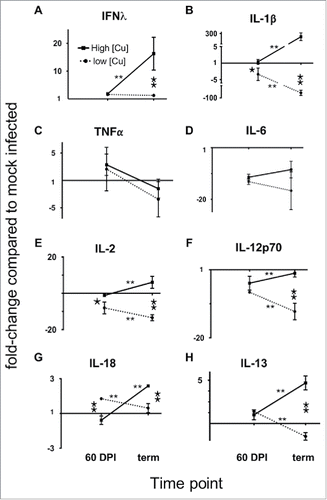
We observed no significant difference in expression of TNFα and IL-6. We detected no granulocyte-monocyte colony stimulating factor (GM-CSF) in any mice from any group. We also observed significant reduction in expression of T cell-activating cytokines IL-2, IL-12p70 and IL-18, as well as the anti-inflammatory Th2 cytokine IL-13, in mice fed low Cu diets compared to mice fed high Cu diets. We detected no IL-4 or IL-5 in any mice from any group.
DISCUSSION
The goal of this work was to determine if differences observed in Mg and Cu water concentrations on CWD-negative and CWD-positive sites could be translated into a transgenic mouse bioassay to assess their effects on CWD progression. Numerous studies have shown that metals such as manganese and copper alter prion protein stability, leading to altered levels in diseased animals.Citation16,27-30 Copper is a common environmental divalent cation and can be found in varying concentrations in soil and water,Citation31 is a normal ligand for PrPC, and increased Cu levels show convincing evidence for being a factor in CWD propagation.Citation19,32-35 However, little work has been done to specifically assess the levels of cations in the environment and their impact on CWD.
Environmental Sampling
Our environmental analysis showed no difference between copper (Cu), manganese (Mn), magnesium (Mg), and iron (Fe) soil levels at CWD-positive and negative locations. However, Mg was significantly higher at CWD-negative sites in the water, and there was a trend toward decreased Cu, Mn and Fe levels at these sites, and increased Cu, Mn and Fe on CWD-positive sites.
Water sources were compared to determine if the origin of the water, well versus surface water, had an impact on the cation levels since metals can leach from pipes into the water. CWD-negative sites had a greater percentage of well water sources than CWD-positive sites, yet had lower levels of Cu indicating that the increased level of Cu, Fe and Mn seen at CWD-positive sites was not a result of leaching from copper supply pipes. A study by Davies and Brown suggests that increased Mn can help protect the prion protein from degradation and increase its infective potential.Citation36 Although not statistically significant, an increase in Mn was seen in water from CWD-positive sites. Although Cu was the cation selected for this study, it is totally within the realm of possibility that similar survival outcomes could be observed by interchanging Mn or Fe with the Cu. If so, it would suggest that redox reactions with divalent cations, in general, could have negative impacts on disease progression, survival, and neuroinflammation.
Several studies have implicated clays in increased environmental prion persistence and even infectivity.Citation37,38 Soil composition was compared between positive and negative sites. The clay fraction levels were similar between sites suggesting that increased clay composition was not responsible for the increased incidence of CWD at the positive locations. A recent study examining the particulars of clay composition revealed that the type of clay present can influence CWD persistence.Citation39 However, that type of analysis was beyond the scope of this study, and would not explain the bioassay results where no clay exposure occurred.
Transgenic Mouse Bioassay
Mice fed the lowest concentration of Cu and highest concentration of Mg, ie the highest Mg/Cu ratio, lived significantly longer than the other treatment groups with custom diets and supplemented drinking water, as well as the standard rodent diet and water group. Mice were inoculated with an infectious dose one order of magnitude lower than what is often utilized in IC studies (0.1% vs. 1% infected brain homogenate). This was done to try to more closely represent a natural dose. However, we readily acknowledge that the very nature of IC inoculation precludes it from being a true model for natural infection. It appears that Cu concentration had the greatest impact on survival, as mice fed the lowest concentration lived the longest. Mice fed ≥6000 ppb had similar survival times indicating a threshold dose between 2000 and 6000 ppb. However, all animals in each group ultimately succumbed to disease. Our results support findings from a previous study using mouse scrapie which demonstrated a neuroprotective effect of dietary copper depletion, but an inability to prevent neuronal death.Citation29 However, a balance is essential, as significant copper depletion can also have detrimental effects such as spongiosis in the brain.Citation40 Copper also has been shown to play a role in Alzheimer's disease (AD), a close cousin of prion diseases. Increased Cu has been found in the brains of AD patients,Citation41 and been shown to increase amyloid precursor protein (APP) expression Citation42 and exacerbate both tau and amyloid β pathology,Citation43,44 while copper chelation slowed Alzheimer's disease progression.Citation45 The presence of redox-active metals, particularly Cu, has been shown to induce oxidative stress in the brain.Citation23,24, 46,47 Oxidative stress, in the form of reactive oxygen species (ROS), hydroxyl radicals, and lipid peroxidation, has been implicated in neurodegenerative disease progression by initiating inflammation.Citation34,48-52 Studies examining the levels of various cations in CWD-positive and negative animal tissues have shown both Cu increases and decreases in the blood and brain in deer, elk, and rodents, complicating interpretation.Citation46,53, 54
Unlike Cu, Mg is not a ligand for binding sites on PrPC. However, it is an important component for over 300 enzymes such as those that polymerize RNA and DNA, phosphorylate molecules, and combat oxidative stress.Citation31 Its presence has been shown to reduce inflammation Citation55,56 and have a beneficial effect on diabetes, metabolic syndrome, and arsenic-induced oxidative stress.Citation57-59 The role of Mg in prion disease has largely been ignored as it does not directly bind to the prion protein like Cu or Mn. However, a study with Alzheimer's disease patients demonstrated that individuals who took Mg supplements, had slower cognitive decline than those that didn't.Citation60
Magnesium ions can reduce inflammatory responses and neuronal death by antagonizing calcium channels thus preventing the release of neurotoxic TNFα and IL-6, and reducing pro-apoptotic proteins.Citation61-63 Both TNFα and IL-6 protein levels were reduced in mice fed lower Cu and higher Mg in this study. Mg levels, overall, are reduced in patients with AD Citation54,64 and Mg supplementation has been suggested as a therapeutic agent Citation59,65, 66 An increase in Mg alone was insufficient to rescue or prevent death from CWD in this study. Group E had very high levels of Mg (2,100,000 ppb), but still did not survive significantly longer than the other groups. However, Mg may have played somewhat of a role in increased survival as there was no significant difference in survival time between group C and groups A and B despite there being over a 6-fold increase in the copper concentration in A and B, but the same level of Mg. More work is warranted to evaluate the effect of magnesium on CWD and other prion diseases.
Mouse Brain ICP-MS
Analysis of the brains from 3 randomly selected mice from each of the 5 treatment groups and inoculation status did not reflect the amount of Cu and Mg ingested in drinking water. Mice consuming higher levels of Cu in their drinking water did not present with higher Cu brain levels than those receiving 19 times less, indicating tightly controlled homeostasis. CWD status did not affect the amount of Cu detected in the brain, however, mice with CWD did have increased Mg levels, with 2 groups having significant differences. Perhaps this reflects an attempt by the body to combat neuroinflammation, which is central to prion disease progression.Citation21,67 Studies have shown both increases and decreases in blood and brain cation levels of prion-positive vs. negative deer, elk and rodents.Citation46,53, 54 In contrast to our findings, a study examining Mg and Cu levels in the brain of CWD-negative and positive elk found decreased brain Mg levels in CWD-positive animals and no difference in Cu.Citation53 This is not terribly surprising, as elk and mice likely process and store minerals differently. Altered brain cation levels do not necessarily provide evidence of a causative effect, but could simply represent a storage or processing dysregulation in the animal.
RT-PCR
To determine if a decrease in neuroinflammation might be responsible for an increase in survival times, we evaluated the expression of an array of inflammatory transcripts. We observed significant changes in the levels of transcripts in the brain associated with inflammation in mice fed a high Cu vs. low Cu diet. Even before onset of clinical prion disease, we detected increased expression of transcripts encoding chemokines and their receptors in high Cu diet mice over mock-infected controls, and no increases in chemotaxis transcripts in low Cu diet mice. At terminal stages of CWD, high Cu diet mice also increased expression of inflammatory transcripts for Oncostatin M, TNFα, and IFNγ. We observed no such increase in low Cu diet mice.
Protein Expression
Increased inflammatory transcripts translated to increased expression of inflammatory proteins IFNγ, IL-1β and IL-18, as well as T cell activating cytokines IL2, IL-12p70 and the anti-inflammatory TH2 cytokine IL-13 in mice fed a high Cu diet. Conversely, we observed decreased expression of these cytokines in brains of mice fed a low Cu diet. Taken together, these data support our hypothesis that lowering Cu levels in mouse diets decreases cerebral inflammation resulting in significantly prolonged survival in prion-infected mice.
Immunohistochemistry
Glial fibrillary acidic protein (GFAP), an intermediate filament protein, staining represents expression of the protein by astrocytes.Citation68 The expression of GFAP is utilized as a marker for reactive gliosis due to disease, CNS injury, or neurodegeneration.Citation69,70 Mice in group D showed less GFAP staining at 60 DPI when compared to group E at the same time point (). When taken into consideration with the neuroinflammatory gene expression data, the reduction may be a physical representation of reduced overall brain inflammation and injury. However, reduction of cellular GFAP expression has been shown to be reduced by intravenous administration of Mg in traumatic brain injury in rats Citation70 and our data indicates higher Mg brain concentrations in CWD-infected mice. Although group E had a considerably higher concentration of Mg than group D, it also has a much higher concentration of Cu, which perhaps overwhelmed any anti-inflammatory effects that Mg might have conveyed.
Little research has been done to evaluate the effect of Mg on neurodegeneration considering its importance in biological functions and its potential to reduce inflammatory processes. An increased Mg/Cu ratio altered disease progression by delaying neuroinflammation, and as a consequence disease progression. The results of this preliminary study suggest a role for dietary constituents in the progression of CWD and the importance of feed composition in disease management. The next step in our research is to test the optimal Mg/Cu ratio in a cervid species for efficacy. It is our hope that these findings may lead toward the development of a cation-modified diet to prevent or reduce CWD susceptibility in captive facilities.
METHODS AND MATERIALS
Environmental Samples and Locations
Soil and water samples were collected from 10 captive white-tailed deer locations (5 CWD- negative, 5 CWD-positive), and water from 4 CWD-positive captive elk locations and 2 from CWD-positive wild sites, totaling 11 CWD-positive sites and 5 CWD-negative sites. All of the negative sites had 2 different water sources providing 10 different samples, and 4 of the positive sites had multiple water sources providing a total of 16 different samples. Water sources included surface sources (streams, ponds, and wallows), and well sources (waterers). The historical prevalence of CWD at the positive captive locations ranged between 5–25% and the cervid CWD incidence rates on the wild sites ranged between 10–30%. There was no history of CWD at negative sites.
Environmental Sample Analysis - Soil and Water by ICP-MS
Approximately 50 g of soil was taken from 10 captive white-tailed deer sites and 30 ml of water was collected from each source and placed in 50 ml conical tubes containing 3 drops of nitric acid (Sigma) for preservation. Upon receipt, soil and water samples were sent to the Colorado State University analytical chemistry laboratory in Pueblo, Colorado for inductively coupled plasma mass spectrometry (ICP-MS) metals analysis. Water samples were analyzed utilizing EPA method 200.8 Citation71 and 6020.Citation72 Soil samples were analyzed utilizing EPA method 3051Citation73 and 6020A.Citation72
Soil Composition Analysis
To determine soil composition, samples were sent to the Colorado State University Soil Laboratory in Fort Collins, Colorado for analysis. Organic matter, (Method 29–3.5.2, Walkely-Black procedure),Citation74 Quartz (Method 3–5.3),Citation74 silt, and clay constituent percentages were identified (Method 15- hydrometer method).Citation75
Transgenic Mouse Bioassay - Intracerebral Inoculation
All procedures involving animals were performed to minimize suffering and were approved by the Institutional Animal Care and Use Committee at the USDA National Wildlife Research Center in accordance with the USDA Animal Welfare Act Regulation. CFR, title 9, chapter 1, subchapter A, parts 1–4. The transgenic mouse line (TG12) utilized in this study expresses the elk prion protein with methionine/methionine at codon 132. Mice were generated as previously described, and generally develop disease-associated ataxia at about 120 d post inoculation (DPI) after intracerebral inoculation (IC) with 1% brain homogenate from CWD-affected cervids.Citation26 For the IC survival portion of the study, 4 groups of mice were placed at weaning on a custom Teklad magnesium (Mg) and copper (Cu)-deficient diet (Harlan/Teklad) and de-ionized Mg and Cu-supplemented drinking water, and one group on Purina 5001 rodent diet (Purina) and normal drinking water containing negligible Mg and Cu levels (90 and 4 ppb respectively) ().
TABLE 4. Dietary constituent values in parts per billion (ppb) for the custom and 5001 diets
TABLE 5. Magnesium (Mg) and Copper (Cu) levels and number of mice per treatment group with (+) and without (−) chronic wasting disease. ppb- parts per billion, Custom-Teklad Mg/Cu deficient diet and supplemented drinking water 5001-standard Purina rodent chow and regular drinking water
Mice were maintained on the diets for 30 d prior to IC inoculation with either CWD-positive brain homogenate from a terminal elk or CWD-negative transgenic mouse brain homogenate (NBH). Inoculum was made by diluting 10% (wt/vol) brain homogenate as previously described Citation76 and diluted to 0.1% in sterile filtered phosphate buffered saline (PBS) containing 100 units/mL penicillin and 100 µg/mL streptomycin (Invitrogen) diluted in inoculum to 1X, then placed at room temperature for 20 min. The 0.1% brain homogenate was selected to more closely resemble a natural dose than the common 1%. Mice were anesthetized with isoflurane gas and inoculated IC with 30 µl of inoculum 3 mm deep through the coronal suture, 3–5 mm lateral of the sagital suture. CWD-positive mice from groups A-C were euthanized at terminal disease when they presented with severe ataxia. Control mice from these groups were euthanized at 200 DPI. Mice from groups D and E were euthanized at 60 DPI, and at terminal disease when they presented with severe ataxia. Control mice from groups D and E were euthanized at 60 DPI and at 200 DPI. Brains were removed at euthanasia, and half frozen at −80° C and half fixed in 10% formalin. Disease presence was assessed in CWD-positive and negative mice by Western blot analysis (data not shown).
Mouse Brain Cation Analysis by ICP-MS
A 10% (wt/vol) brain homogenate (CWD-negative and CWD-positive) was prepared with 100 mg of formalin-fixed brain in de-ionized water, as described above, for 3, randomly selected mice from each test group. Sodium hydroxide (NaOH) (Sigma) was added to each sample to a final concentration of 1M NaOH solution to inactive any prions present. Samples were allowed to sit at room temperature for 10 min and then neutralized to pH 7 by adding nitric acid. Samples were then sent to the Colorado State University analytical chemistry laboratory in Pueblo, Colorado for ICP-MS analysis (method 6020A and 3052 Citation72,Citation77) to determine the Mg and Cu concentrations present.
Quantitative Real-Time Polymerase Chain Reaction (RT-PCR)
Mouse brains from groups D and E DPI 60, and terminal disease (including those utilized in the IHC and protein assay portions), from groups D and E were prepared for RT-PCR inflammatory arrays (). The cost of the RT-PCR arrays prohibited the examination of all mice from these groups. The number of mice used in each group varied, as the quality of some of the RNA samples was poor and generated unusable RT-PCR data. Negative control groups from DPI 60 and terminal mice were combined for each group, and served as Group D and E controls respectively for gene expression analysis. Extraction of RNA for each sample was done by following the instructions in the RNeasy® Mini kit (Qiagen). Prior to extraction, 20 mg of brain, and 350 µl of Qiagen buffer RLT with betamercapturethanol (BME) were added to 1.5 ml tubes with 2.5 mm glass beads, and homogenized with a Blue Bullet homogenizer (NextAdvance) for 2 min on setting 7. Synthesis of cDNA was done by utilizing the RT2 First Strand kit (Qiagen) as per directions, from extracted RNA. Once cDNA was synthesized, it was frozen at −80° C until needed. Pre-made inflammatory RT-PCR 96-well arrays were purchased from SABiosciences (PAMM-011Z format D). Plates were loaded by with 25 µl per well of a 102 µl of cDNA and 1350 µl of RT2 SYBR® Green qPCR mastermix (SABiosciences) mixture. Each plate contained genes for 84 mouse inflammatory cytokines and receptors that mediate the inflammatory response, as well as 5 housekeeping genes, and 7 genomic DNA, reverse transcription, and PCR control wells (see supplemental data section for complete list of genes). One plate per mouse was amplified on a Bio-Rad CFX96 RT-PCR instrument utilizing the following conditions: Hotstart at 95° C for 10 min, then 40 cycles at 95° C for 15 sec, then 60°C for 60 sec with ramp rate set to 1° C/sec. Completed RT-PCR data was exported from the Bio-Rad CFX96 and uploaded to the SABiosciences data analysis website (http://pcrdataanalysis.sabiosciences.com/pcr/arrayanalysis.php) for analysis.
TABLE 6. Number of mice for each group utilized in the inflammatory RT-PCR array and protein expression assay. With chronic wasting disease (+) and without (−). DPI- days post inoculation
Immunohistochemistry (IHC)
One brain hemisphere from each of 3 representative mice from the CWD-positive and negative from groups D and E were examined by IHC at 60 DPI and terminal disease. The three brain hemispheres were formalin-fixed and paraffin-embedded, then sectioned at 5 µm and placed on positively charged microscope slides. The slides were deparaffinized and rehydrated in deionized water.
To prepare for PrPCWD visualization, slides were pre-treated in 95% formic acid (Sigma-Aldrich, St. Louis, MO) for 5 minutes at room temperature, rinsed in deionized water and placed in 0.1 M Tris buffer, pH 7.3. Antigen retrieval was performed in DAKO Target Retrieval Solution (DAKO, Denmark) at 121° C for 20 minutes. Slides were stained with a Leica Bond Max automated immunohistochemistry stainer (Leica Biosystems, UK) using a combination of a Mouse-on-Mouse Polymer IHC kit (Abcam, Cambridge, MA) and the Bond Polymer Refine Detection kit (Leica) and visualized by horseradish peroxidase-DAB chemistry at room temperature. The staining protocol is as follows with appropriate rinses between steps: hydrogen peroxide block (Abcam) 10 minutes, rodent block (Abcam) 30 minutes, mouse anti-prion primary antibody (F99/97.6.1, VMRD, Pullman, WA) 1:250 dilution for 30 minutes, protein block (Background Eraser, Biocare Medical, Concord, CA) 10 min., M.O.M. HRP Polymer secondary antibody (Abcam) 15 minutes, Mixed DAB Refine (Leica) 10 minutes, DAB Enhancer (Leica) 5 minutes. Slides were counterstained with hematoxylin, and PrPCWD was visualized as brownish granular staining.
GFAP
The same mouse brain samples were used as the PrPCWD IHC above. To stain for glial fibrillary acidic protein (GFAP), a marker for astrogliosis, the formalin-fixed paraffin-embedded mouse brain tissue was sectioned at 5 µm and placed on positively charged microscope slides. Slides were heated at 60° C for 30 minutes and loaded onto a Leica Bond Max automated immunohistochemistry stainer (Leica Biosystems, UK). Slides were dewaxed and antigen retrieval with ER2 solution (Leica) at 95° C for 20 minutes. Anti- GFAP rabbit monoclonal primary antibody (clone SP78, Cell Marque, Rocklin CA) 1:100 dilution was incubated at room temperature for 30 minutes. Anti-rabbit secondary antibody (Leica) was incubated at room temperature for 25 minutes. The Bond Polymer Refine Red Detection kit using alkaline phosphatase-fast red visualization was run and the slides were counterstained with hematoxylin. Hippocampal regions of the brain were reviewed for changes in stain intensity as this is the most affected brain region in this transgenic line.
Protein Expression Assay
Mouse brains were homogenized as described above to generate a 10% homogenate with following change: protease inhibitor cocktail (Roche) was added to PMCA buffer 1, as per product instructions, in both steps utilizing PMCA buffer rather than using PMCA buffer 2 for the second part of the protocol. Brain homogenate was then stored at −80°C until used in the BioPlex assay.
A mouse Th1/Th2 Extended ProcartaPlex™ Immunoassay (eBioscience, ref#: EPX110-20820-901) was used to measure 11 cytokines (IL-1β, IL-2, IL-4, IL-5, IL-6, IL-12p70, IL-13, IL-18, IFN-γ, GM-CSF and TNF-α). Brain homogenate samples were subjected to centrifugation (5000 rpm for 10min at 4°C) and supernatant was collected and diluted 1:10 for cytokine analysis. Preparation of samples, along with kit standards, detection antibody and streptavidin-PE, were carried out per the eBioscience magnetic immunoassay protocol. Standards, samples and a control were run in triplicate with CWD-negative and positive samples run on separate 96-well untreated polystyrene microplates (BD Falcon, 353910). Cytokine fluorescence intensity was detected using the BioPlex machine with Luminex Multiplexing Technology and analyzed by BioPlex Manager software version 5.0.
DISCLOSURE OF POTENTIAL CONFLICTS OF INTEREST
No potential conflicts of interest were disclosed.
ACKNOWLEDGMENTS
We would like to thank Dr. Jim McLane for sample collection, Jim Carsella for ICP sample analysis and the NWRC animal care staff for their quality care of study animals.
FUNDING
We would like to thank the North American Deer Farmer's Association for their support in this research effort.
REFERENCES
- Prusiner SB. Prions. Proc Natl Acad Sci U S A 1998; 95:13363-83; PMID:9811807; http://dx.doi.org/10.1073/pnas.95.23.13363
- Miller MW, Williams ES. Prion disease: horizontal prion transmission in mule deer. Nature 2003; 425:35-6; PMID:12955129; http://dx.doi.org/10.1038/425035a
- Miller MW, Williams ES, Hobbs NT, Wolfe LL. Environmental sources of prion transmission in mule deer. Emerg Infect Dis 2004; 10:1003-6; PMID:15207049; http://dx.doi.org/10.3201/eid1006.040010
- Williams ES. Chronic wasting disease. Vet Pathol 2005; 42:530-49; PMID:16145200; http://dx.doi.org/10.1354/vp.42-5-530
- Saunders SE, Bartelt-Hunt SL, Bartz JC. Occurrence, transmission, and zoonotic potential of chronic wasting disease. Emerging infectious diseases 2012; 18:369-76; PMID:22377159; http://dx.doi.org/10.3201/eid1803.110685
- Miller MW, Conner MM. Epidemiology of chronic wasting disease in free-ranging mule deer: spatial, temporal, and demographic influences on observed prevalence patterns. J Wildl Dis 2005; 41:275-90; PMID:16107661; http://dx.doi.org/10.7589/0090-3558-41.2.275
- Rigou P, Rezaei H, Grosclaude J, Staunton S, Quiquampoix H. Fate of prions in soil: adsorption and extraction by electroelution of recombinant ovine prion protein from montmorillonite and natural soils. Environ Sci Technol 2006; 40:1497-503; PMID:16568762; http://dx.doi.org/10.1021/es0516965
- Johnson CJ, Phillips KE, Schramm PT, McKenzie D, Aiken JM, Pedersen JA. Prions adhere to soil minerals and remain infectious. PLoS Pathog 2006; 2:e32; PMID:16617377; http://dx.doi.org/10.1371/journal.ppat.0020032
- Brown P, Gajdusek DC. Survival of scrapie virus after 3 years' interment. Lancet 1991; 337:269-70; PMID:1671114; http://dx.doi.org/10.1016/0140-6736(91)90873-N
- Thomzig A, Kratzel C, Lenz G, Kruger D, Beekes M. Widespread PrP(Sc) accumulation in muscles of hamsters orally infected with scrapie. EMBO Rep 2003; 4:1-4; http://dx.doi.org/10.1038/sj.embor.embor827
- Choi CJ, Kanthasamy A, Anantharam V, Kanthasamy AG. Interaction of metals with prion protein: possible role of divalent cations in the pathogenesis of prion diseases. Neurotoxicology 2006; 27:777-87; PMID:16860868; http://dx.doi.org/10.1016/j.neuro.2006.06.004
- Kim NH, Choi JK, Jeong BH, Kim JI, Kwon MS, Carp RI, Kim YS. Effect of transition metals (Mn, Cu, Fe) and deoxycholic acid (DA) on the conversion of PrPC to PrPres. FASEB J 2005; 19:783-5; PMID:15758042
- Kralovicova S, Fontaine SN, Alderton A, Alderman J, Ragnarsdottir KV, Collins SJ, Brown DR. The effects of prion protein expression on metal metabolism. Mol Cell Neurosci 2009; 41:135-47; PMID:19233277; http://dx.doi.org/10.1016/j.mcn.2009.02.002
- Leach SP, Salman MD, Hamar D. Trace elements and prion diseases: a review of the interactions of copper, manganese and zinc with the prion protein. Anim Health Res Rev 2006; 7:97-105; PMID:17389057; http://dx.doi.org/10.1017/S1466252307001181
- Sigurdsson EM, Brown DR, Alim MA, Scholtzova H, Carp R, Meeker HC, Prelli F, Frangione B, Wisniewski T. Copper chelation delays the onset of prion disease. J Biol Chem 2003; 278:46199-202; PMID:14519758; http://dx.doi.org/10.1074/jbc.C300303200
- Brown DR, Hafiz F, Glasssmith LL, Wong BS, Jones IM, Clive C, Haswell SJ. Consequences of manganese replacement of copper for prion protein function and proteinase resistance. EMBO J 2000; 19:1180-6; PMID:10716918; http://dx.doi.org/10.1093/emboj/19.6.1180
- Pushie MJ, Rauk A, Jirik FR, Vogel HJ. Can copper binding to the prion protein generate a misfolded form of the peptide? Biometals 2009; 22:159-75; PMID:19140013; http://dx.doi.org/10.1007/s10534-008-9196-x
- Stockel J, Safar J, Wallace AC, Chohen FE, Prusiner SB. Prion protein selectively binds copper (II) ions. Biochemistry 1998; 37:7185-93; PMID:9585530; http://dx.doi.org/10.1021/bi972827k
- Viles JH, Cohen FE, Prusiner SB, Goodin DB, Wright PE, Dyson HJ. Copper binding to the prion protein: structural implications of four identical cooperative binding sites. Proc Natl Acad Sci U S A 1999; 96:2042-7; PMID:10051591; http://dx.doi.org/10.1073/pnas.96.5.2042
- Eikelenboom P, Bate C, Van Gool WA, Hoozemans JJ, Rozemuller JM, Veerhuis R, Williams A. Neuroinflammation in Alzheimer's disease and prion disease. Glia 2002; 40:232-9; PMID:12379910; http://dx.doi.org/10.1002/glia.10146
- Crespo I, Roomp K, Jurkowski W, Kitano H, Del Sol A. Gene regulatory network analysis supports inflammation as a key neurodegeneration process in prion disease. BMC Syst Biol 2012; 6:132; PMID:23068602; http://dx.doi.org/10.1186/1752-0509-6-132
- Cowan JA ed. The Biological Chemistry of Magnesium. New York: VCH Publishers Inc, 1995
- Turnbull S, Tabner BJ, Brown DR, Allsop D. Copper-dependent generation of hydrogen peroxide from the toxic prion protein fragment PrP106-126. Neurosci Lett 2003; 336:159-62; PMID:12505617; http://dx.doi.org/10.1016/S0304-3940(02)01254-5
- Bayer TA, Schafer S, Breyhan H, Wirths O, Treiber C, Multhaup G. A vicious circle: role of oxidative stress, intraneuronal Abeta and Cu in Alzheimer's disease. Clinical neuropathology 2006; 25:163-71; PMID:16866297
- Tamguney G, Giles K, Bouzamondo-Bernstein E, Bosque PJ, Miller MW, Safar J, DeArmond SJ, Prusiner SB. Transmission of elk and deer prions to transgenic mice. J Virol 2006; 80:9104-14; PMID:16940522; http://dx.doi.org/10.1128/JVI.00098-06
- Kong Q, Huang S, Zou W, Vanegas D, Wang M, Wu D, Yuan J, Zheng M, Bai H, Deng H, et al. Chronic wasting disease of elk: transmissibility to humans examined by transgenic mouse models. J Neurosci 2005; 25:7944-9; PMID:16135751; http://dx.doi.org/10.1523/JNEUROSCI.2467-05.2005
- Hesketh S, Thompsett AR, Brown DR. Prion protein polymerisation triggered by manganese-generated prion protein seeds. J Neurochem 2012; 120:177-89; PMID:22007749; http://dx.doi.org/10.1111/j.1471-4159.2011.07540.x
- Choi CJ, Anantharam V, Martin DP, Nicholson EM, Richt JA, Kanthasamy A, Kanthasamy AG. Manganese upregulates cellular prion protein and contributes to altered stabilization and proteolysis: relevance to role of metals in pathogenesis of prion disease. Toxicol Sci 2010; 115:535-46; PMID:20176619; http://dx.doi.org/10.1093/toxsci/kfq049
- Bolea R, Hortells P, Martin-Burriel I, Vargas A, Ryffel B, Monzon M, Badiola JJ. Consequences of dietary manganese and copper imbalance on neuronal apoptosis in a murine model of scrapie. Neuropathol Appl Neurobiol 2010; 36:300-11; PMID:20070537; http://dx.doi.org/10.1111/j.1365-2990.2010.01065.x
- Thackray AM, Knight R, Haswell SJ, Bujdoso R, Brown DR. Metal imbalance and compromised antioxidant function are early changes in prion disease. Biochem J 2002; 362:253-8; PMID:11829763; http://dx.doi.org/10.1042/bj3620253
- Cowan JA. Structural and catalytic chemistry of magnesium-dependent enzymes. Biometals 2002; 15:225-35; PMID:12206389; http://dx.doi.org/10.1023/A:1016022730880
- Pushie MJ, Rauk A, Jirik FR, Vogel HJ. Can copper binding to the prion protein generate a misfolded form of the protein? Biometals 2009; 22:159-75; PMID:19140013; http://dx.doi.org/10.1007/s10534-008-9196-x
- Stockel J, Safar J, Wallace AC, Cohen FE, Prusiner SB. Prion protein selectively binds copper(II) ions. Biochemistry 1998; 37:7185-93; PMID:9585530; http://dx.doi.org/10.1021/bi972827k
- Barnham KJ, Cappai R, Beyreuther K, Masters CL, Hill AF. Delineating common molecular mechanisms in Alzheimer's and prion diseases. Trends in biochemical sciences 2006; 31:465-72; PMID:16820299; http://dx.doi.org/10.1016/j.tibs.2006.06.006
- Brown DR. Brain proteins that mind metals: a neurodegenerative perspective. Dalton Trans 2009; (21):4069-76; PMID:19452053; http://dx.doi.org/10.1039/b822135a
- Davies P, Brown DR. Manganese enhances prion protein survival in model soils and increases prion infectivity to cells. PLoS One 2009; 4:e7518; PMID:19844576; http://dx.doi.org/10.1371/journal.pone.0007518
- Johnson CJ, Pedersen JA, Chappell RJ, McKenzie D, Aiken JM. Oral transmissibility of prion disease is enhanced by binding to soil particles. PLoS Pathog 2007; 3:e93; PMID:17616973; http://dx.doi.org/10.1371/journal.ppat.0030093
- Saunders SE, Shikiya RA, Langenfeld K, Bartelt-Hunt SL, Bartz JC. Replication efficiency of soil-bound prions varies with soil type. J Virol 2011; 85:5476-82; PMID:21430062; http://dx.doi.org/10.1128/JVI.00282-11
- Kuznetsova A, McKenzie D, Banser P, Siddique T, Aiken JM. Potential role of soil properties in the spread of CWD in western Canada. Prion 2014; 8:92-99; PMID:24618673; http://dx.doi.org/10.4161/pri.28467
- Hortells P, Monleon E, Acin C, Vargas A, Vasseur V, Salomon A, Ryffel B, Cesbron JY, Badiola JJ, Monzon M. The effect of metal imbalances on scrapie neurodegeneration. Zoonoses Public Health 2010; 57:358-66; PMID:19486493
- Bush AI. Copper, zinc, and the metallobiology of Alzheimer disease. Alzheimer Dis Assoc Disord 2003; 17:147-50; PMID:14512827; http://dx.doi.org/10.1097/00002093-200307000-00005
- Bellingham SA, Lahiri DK, Maloney B, La Fontaine S, Multhaup G, Camakaris J. Copper depletion down-regulates expression of the Alzheimer's disease amyloid-beta precursor protein gene. J Biol Chem 2004; 279:20378-86; PMID:14985339; http://dx.doi.org/10.1074/jbc.M400805200
- Kitazawa M, Cheng D, Laferla FM. Chronic copper exposure exacerbates both amyloid and tau pathology and selectively dysregulates cdk5 in a mouse model of AD. J Neurochem 2009; 108:1550-60; PMID:19183260; http://dx.doi.org/10.1111/j.1471-4159.2009.05901.x
- Huang X, Cuajungco MP, Atwood CS, Hartshorn MA, Tyndall JD, Hanson GR, Stokes KC, Leopold M, Multhaup G, Goldstein LE, et al. Cu(II) potentiation of alzheimer abeta neurotoxicity. Correlation with cell-free hydrogen peroxide production and metal reduction. J Biol Chem 1999; 274:37111-6; PMID:10601271; http://dx.doi.org/10.1074/jbc.274.52.37111
- Ritchie CW, Bush AI, Mackinnon A, Macfarlane S, Mastwyk M, MacGregor L, Kiers L, Cherny R, Li QX, Tammer A, et al. Metal-protein attenuation with iodochlorhydroxyquin (clioquinol) targeting Abeta amyloid deposition and toxicity in Alzheimer disease: a pilot phase 2 clinical trial. Arch Neurol 2003; 60:1685-91; PMID:14676042; http://dx.doi.org/10.1001/archneur.60.12.1685
- Wong BS, Chen SG, Colucci M, Xie Z, Pan T, Liu T, Li R, Gambetti P, Sy MS, Brown DR. Aberrant metal binding by prion protein in human prion disease. J Neurochem 2001; 78:1400-8; PMID:11579148; http://dx.doi.org/10.1046/j.1471-4159.2001.00522.x
- Kim JI, Choi SI, Kim NH, Jin JK, Choi EK, Carp RI, Kim YS. Oxidative stress and neurodegeneration in prion diseases. Annals of the New York Academy of Sciences 2001; 928:182-6; PMID:11795509; http://dx.doi.org/10.1111/j.1749-6632.2001.tb05648.x
- Hinerfeld D, Traini MD, Weinberger RP, Cochran B, Doctrow SR, Harry J, Melov S. Endogenous mitochondrial oxidative stress: neurodegeneration, proteomic analysis, specific respiratory chain defects, and efficacious antioxidant therapy in superoxide dismutase 2 null mice. J Neurochem 2004; 88:657-67; PMID:14720215; http://dx.doi.org/10.1046/j.1471-4159.2003.02195.x
- Behl C, Davis JB, Lesley R, Schubert D. Hydrogen peroxide mediates amyloid beta protein toxicity. Cell 1994; 77:817-27; PMID:8004671; http://dx.doi.org/10.1016/0092-8674(94)90131-7
- Smith DG, Cappai R, Barnham KJ. The redox chemistry of the Alzheimer's disease amyloid beta peptide. Biochim Biophys Acta 2007; 1768:1976-90; PMID:17433250; http://dx.doi.org/10.1016/j.bbamem.2007.02.002
- Tabner BJ, Turnbull S, Fullwood NJ, German M, Allsop D. The production of hydrogen peroxide during early-stage protein aggregation: a common pathological mechanism in different neurodegenerative diseases? Biochem Soc Trans 2005; 33:548-50; PMID:16042541; http://dx.doi.org/10.1042/BST0330548
- Butterfield DA, Bader Lange ML, Sultana R. Involvements of the lipid peroxidation product, HNE, in the pathogenesis and progression of Alzheimer's disease. Biochim Biophys Acta 2010; 1801:924-9; PMID:20176130; http://dx.doi.org/10.1016/j.bbalip.2010.02.005
- White SN, O'Rourke KI, Gidlewski T, VerCauteren KC, Mousel MR, Phillips GE, Spraker TR. Increased risk of chronic wasting disease in Rocky Mountain elk associated with decreased magnesium and increased manganese in brain tissue. Can J Vet Res 2010; 74:50-3; PMID:20357959
- Vural H, Demirin H, Kara Y, Eren I, Delibas N. Alterations of plasma magnesium, copper, zinc, iron and selenium concentrations and some related erythrocyte antioxidant enzyme activities in patients with Alzheimer's disease. J Trace Elem Med Biol 2010; 24:169-73; PMID:20569929; http://dx.doi.org/10.1016/j.jtemb.2010.02.002
- Pan HC, Sheu ML, Su HL, Chen YJ, Chen CJ, Yang DY, Chiu WT, Cheng FC. Magnesium supplement promotes sciatic nerve regeneration and down-regulates inflammatory response. Magnes Res 2011; 24:54-70; PMID:21609904
- Kim DJ, Xun P, Liu K, Loria C, Yokota K, Jacobs DR, Jr., He K. Magnesium intake in relation to systemic inflammation, insulin resistance, and the incidence of diabetes. Diabetes Care 2010; 33:2604-10; PMID:20807870; http://dx.doi.org/10.2337/dc10-0994
- Cilliler AE, Ozturk S, Ozbakir S. Serum magnesium level and clinical deterioration in Alzheimer's disease. Gerontology 2007; 53:419-22; PMID:17992016; http://dx.doi.org/10.1159/000110873
- Srivastava D, Subramanian RB, Madamwar D, Flora SJ. Protective effects of selenium, calcium, and magnesium against arsenic-induced oxidative stress in male rats. Arh Hig Rada Toksikol 2010; 61:153-9; PMID:20587388; http://dx.doi.org/10.2478/10004-1254-61-2010-1993
- Yu J, Sun M, Chen Z, Lu J, Liu Y, Zhou L, Xu X, Fan D, Chui D. Magnesium modulates amyloid-beta protein precursor trafficking and processing. J Alzheimers Dis 2010; 20:1091-106; PMID:20413885
- Glick JL. Dementias: the role of magnesium deficiency and an hypothesis concerning the pathogenesis of Alzheimer's disease. Med Hypotheses 1990; 31:211-25; PMID:2092675; http://dx.doi.org/10.1016/0306-9877(90)90095-V
- Sugimoto J, Romani AM, Valentin-Torres AM, Luciano AA, Ramirez Kitchen CM, Funderburg N, Mesiano S, Bernstein HB. Magnesium decreases inflammatory cytokine production: a novel innate immunomodulatory mechanism. J Immunol 2012; 188:6338-46; PMID:22611240; http://dx.doi.org/10.4049/jimmunol.1101765
- Lee M, Jantaratnotai N, McGeer E, McLarnon JG, McGeer PL. Mg2+ ions reduce microglial and THP-1 cell neurotoxicity by inhibiting Ca2+ entry through purinergic channels. Brain Res 2011; 1369:21-35; PMID:21040713; http://dx.doi.org/10.1016/j.brainres.2010.10.084
- Huang CY, Liou YF, Chung SY, Lin WY, Jong GP, Kuo CH, Tsai FJ, Cheng YC, Cheng FC, Lin JY. Role of ERK signaling in the neuroprotective efficacy of magnesium sulfate treatment during focal cerebral ischemia in the gerbil cortex. Chin J Physiol 2010; 53:299-309; PMID:21793341; http://dx.doi.org/10.4077/CJP.2010.AMK063
- Barbagallo M, Belvedere M, Di Bella G, Dominguez LJ. Altered ionized magnesium levels in mild-to-moderate Alzheimer's disease. Magnes Res 2011; 24:S115-21; PMID:21951617
- Cherny RA, Legg JT, McLean CA, Fairlie DP, Huang X, Atwood CS, Beyreuther K, Tanzi RE, Masters CL, Bush AI. Aqueous dissolution of Alzheimer's disease Abeta amyloid deposits by biometal depletion. J Biol Chem 1999; 274:23223-8; PMID:10438495; http://dx.doi.org/10.1074/jbc.274.33.23223
- Ozturk S, Cillier AE. Magnesium supplementation in the treatment of dementia patients. Med Hypotheses 2006; 67:1223-5; PMID:16790324; http://dx.doi.org/10.1016/j.mehy.2006.04.047
- Soto C, Satani N. The intricate mechanisms of neurodegeneration in prion diseases. Trends Mol Med 2011; 17(1):14-24; http://dx.doi.org/10.1016/j.molmed.2010.09.001
- Chiu FC, Goldman JE. Regulation of glial fibrillary acidic protein (GFAP) expression in CNS development and in pathological states. J Neuroimmunol 1985; 8:283-92; PMID:2989328; http://dx.doi.org/10.1016/S0165-5728(85)80067-9
- Middeldorp J, Hol EM. GFAP in health and disease. Progress in neurobiology 2011; 93:421-43; PMID:21219963; http://dx.doi.org/10.1016/j.pneurobio.2011.01.005
- Hoane MR. Treatment with magnesium improves reference memory but not working memory while reducing GFAP expression following traumatic brain injury. Restorative neurology and neuroscience 2005; 23:67-77; PMID:15990413
- EPA US. Method 200.8. DETERMINATION OF TRACE ELEMENTS IN WATERS AND WASTES BY INDUCTIVELY COUPLED PLASMA - MASS SPECTROMETRY
- EPA US. Method 6020A. INDUCTIVELY COUPLED PLASMA-MASS SPECTROMETRY
- EPA US. Method 3052. MICROWAVE ASSISTED ACID DIGESTION OF SILICEOUS AND ORGANICALLY BASED MATRICES
- Nelson DW, Sommers LE. Total carbon, organic carbon and organic matter digestion of organic matter and dissolution of silicates for total element analysis. Methods of Soil Analysis part 2 Chemical and Microbiological Properties. Madison: Soil Science Society of America Inc, 1982:570-1
- Gee GW, Bauder JW. Particle Size Analysis. In: Klute A, ed. Methods of Soil Analysis Part 1 Physical and Mineralogic Methods. Madison: Soil Science of America, 1986
- Nichols TA, Pulford B, Wyckoff AC, Meyerett C, Michel B, Gertig K, Hoover EA, Jewell JE, Telling GC, Zabel MD. Detection of protease-resistant cervid prion protein in water from a CWD-endemic area. Prion 2009; 3:171-83; PMID:19823039; http://dx.doi.org/10.4161/pri.3.3.9819
- EPA U. Method 3052 MICROWAVE ASSISTED ACID DIGESTION OF SILICEOUS ANDORGANICALLY BASED MATRICES

