ABSTRACT
Neuroblastomas are highly invasive tumors that occur in pediatric patients and treatment of invasive disease remains a challenge. The study of cells invading in 3-dimensional (3D) hydrogels has revealed morphologically distinct modes of invasion by which cancer cells adapt to the local tissue environment in order to invade local tissue. Specifically, the small G protein Rac GTPase has been implicated as regulating the elongated/mesenchymal mode of cell invasion. In the present study we demonstrate an inverse association between Rac expression and amplification of MYCN, a well-established prognostic indicator in neuroblastoma. Moreover, the association further tracks with previously described morphological variants of neuroblastoma. Importantly, while MYCN amplification is associated with universally poor prognosis, the clinical course of patients whose tumors lack MYCN amplification are more difficult to predict. Therefore, we analyzed the role that Rac plays in regulating the invasive behavior of neuroblastoma cells lacking MYCN amplification. Using siRNA targeting Rac in single cell suspensions in 3D collagen gels and Rac inhibition of multicellular spheroids (MCS) embedded in collagen gels, we find that the high Rac-expressing lines differ in their morphological response to Rac depletion and inhibition. Live cell imaging of embedded MCS reveals distinct individual and collective modes of invasion between the cell lines. Critically, Rac inhibition blocked both individual and collective invasion in 2 of the 3 high Rac expressing cell lines. Our study suggests that Rac activity may be an important determinant of metastatic capability in subsets of neuroblastoma cells lacking MYCN amplification.
Introduction
Neuroblastoma is the most common extra-cranial solid tumor diagnosed in children and metastatic neuroblastoma remains a challenging clinical problem. The tumors are derived from neural crest cells and are highly heterogeneous.Citation1 Neuroblastomas can occur anywhere along the sympathetic nervous system, but most frequently arise in the adrenal gland. They then spread and invade locally to other tissues in the peritoneal cavity and further disseminate through the lymph or blood vessels, with bony metastases the most commonly occurring secondary tumors.Citation2 In common with most cancers, metastatic neuroblastoma is associated with poor patient survival and therefore it is important to understand the mechanisms that underpin neuroblastoma dissemination.
One marker long known to be associated with neuroblastoma outcomes is the amplification status of the MYCN gene.Citation1 Approximately 1/3rd of patient tumors display high level MYCN amplification and these patients have a universally poor prognosis with highly aggressive tumors. By contrast, metastatic tumors that lack MYCN amplification have variable clinical outcome and there is little known to distinguish the likely survival for these patients.Citation3 In addition to MYCN status, neuroblastomas have also been classified into 3 discrete cell-type categories that reflect their morphology and differentiation phenotypes: N for neuroblastic, S for non-neuronal and substrate adherent and I for cells that have a morphology that is intermediate between N and S and can differentiate to either of these phenotypes.Citation4 Analysis of cancer cells embedded in 3-dimensional (3D) collagen gels has underscored the relationship between cellular morphologies and invasion through a 3D environment, including elongated/mesenchymal and amoeboid/rounded invasion.Citation5,6 Studies of elongated invasion in a range of cancer cell types have high-lighted the role of Rac GTPase activity.Citation7,8 Rac-dependent invasion is associated with elongated cell shapes and adhesion-mediated cell invasion in 3D environments. We have previously shown that Rac regulates elongated morphologies in 3D cultures in S-type, non MYCN amplified, SHEP human neuroblastoma cells.Citation9 This therefore suggested the possibility that the S-type neuroblastomas may employ a Rac-mediated invasion mechanism. In the present study we have analyzed the morphology and migration of neuroblastoma cell lines, representing different morphological sub-types and MYCN amplification status, in 3D collagen.
Results
Rac1 activity and expression is highest in S-type neuroblastomas lacking MYCN amplification
The neuroblastoma lines selected for analysis included 3 non MYCN amplified lines (SHEP, SK-N-AS and SK-N-SH) and 3 MYCN amplified lines (BE2C, IMR32, CHP134) that further represent different neuroblastoma morphology sub-types (summarized in ). We first analyzed Rac GTPase activity using a pull-down assay. Strikingly, the highest levels of Rac activity were consistently detected in the lines lacking MYCN amplification (). Moreover, total levels of Rac1 were also highest in these cells (), suggesting a potential correlation between MYCN status and Rac expression. To more robustly address this association, we analyzed Rac1 expression in a cohort of neuroblastoma patient samples, using publicly available data from the OncoGenomics website (https://pob.abcc.ncifcrf.gov/cgi-bin/JK). This analysis revealed that a significantly greater proportion of patient tumors lacking MYCN amplification express high levels of Rac (). Collectively, these data suggest that Rac activity may play an important role in neuroblastomas lacking MYCN amplification.
Figure 1. Rac GTPase expression and activity is higher in neuroblastoma lacking MYCN amplification. (A) Active Rac levels detected by western blot in the indicated neuroblastoma cell lines. Positive (GTPγS) and negative (GDP) controls of the activity assay are shown. The black vertical line between the controls and samples indicates that controls are from a different part of the same gel. (B) Quantification of active Rac levels in indicated neuroblastoma cell lines (intensity of active Rac divided by total Rac, n = 4 independent experiments). (C) Comparison of Rac1 expression and MYCN amplification status reveals that high level Rac expression is significantly associated with non MYCN amplified tumors. Data were accessed from the OncoGenomics database of the National Cancer Institute (https://pob.abcc.ncifcrf.gov/cgi-bin/JK).Citation32 Patients were divided into high and low Rac1 expression groups by median-centered log 2 ratios. Statistical significance was determined by Fisher's exact test comparing the numbers of tumors in each category.
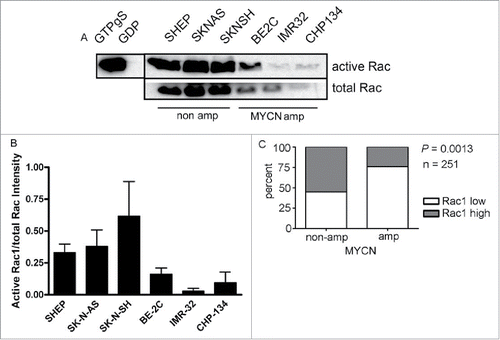
Table 1. Cell line characteristics.
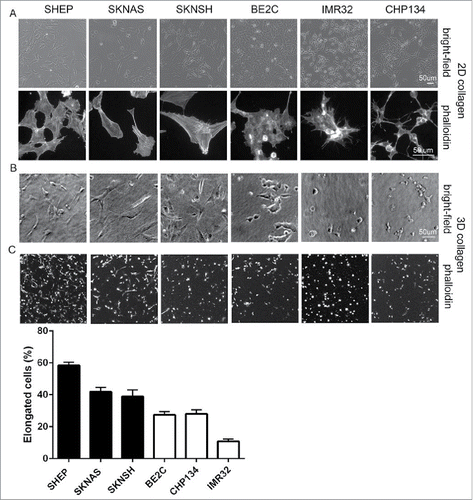
Rac GTPase activity is associated with an elongated cell invasive morphology in 3-dimensional (3D) environments.Citation7,8,10 Notably, S-type cells generally lack MYCN amplificationCitation11 and their morphological characteristics of tight adherence to the substrate, flattened polygonal shape and prominent actin stress fibersCitation4 are reminiscent of features that define mesenchymal cell morphologies.Citation12 As the morphological classifications of neuroblastoma have only previously been described for cells plated on flat 2D planar surfaces, we compared cellular morphologies in 2D versus 3D conditions by examining cells plated onto coverslips coated with collagen Type I vs. cells suspended in 3D collagen Type I hydrogels, respectively. We first confirmed that the cultures exhibited the expected morphologies in 2D culture based on their sub-types. Thus, the S-type SHEP and SK-N-AS cells have a flattened polygonal shape with prominent stress fibers, the N-type IMR32 and CHP134 cells have small, rounded cell bodies and are clumped together with short neurites, while the I-type BE2C cells and mixed N/S-type SK-N-SH have mixed features of both the N- and S-type cells (). Therefore, under 2D conditions the cells with the highest level Rac activity were predominantly of the S-type morphology. Importantly, a similar morphological trend was seen when cells were suspended in 3D collagen gels. Thus, a greater fraction of the population in the 3 non-MYCN amplified lines had an elongated phenotype in 3D collagen gels, compared with more cells having a rounded shape in the MYCN amplified lines (). These observations were borne out by quantitative assessment of cell shapes. The proportions of elongated cells were greatest in the cells lacking MYCN amplification and least in the MYCN amplified lines ().
Figure 2. Morphology of single neuroblastoma cells in 2D versus 3D collagen environments. (A) Representative images of the indicated cell lines grown on collagen coated coverslips (2D). Shown are bright-field images (top panels) and cells fixed and stained with fluorescently-tagged phalloidin (bottom panels). (B) Bright-field images of single cell suspensions in 3D collagen. (C) Phalloidin-stained cells in 3D collagen gels. Histogram below shows the percentages of elongated cells for each cell line, data for cells lacking MYCN amplification represented in the black bars and MYCN amplified in the white bars.
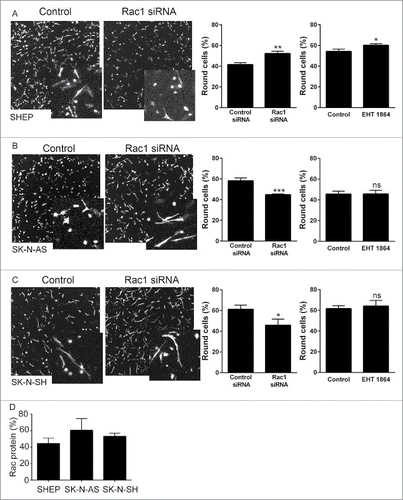
We have previously demonstrated that a Rac-dependent morphology switch is active in the SHEP cells, evidenced by an increase in rounded cells in the population following depletion of Rac1.Citation9 We therefore questioned whether this same Rac-mediated morphological switch is also active in the other lines with high Rac activity. First, we established siRNA conditions for Rac1 depletion and demonstrated robust depletion of Rac protein expression in the 3 lines lacking MYCN amplification (). Agreeing with our previously published data, depletion of Rac1 from SHEP cells led to a significant increase in rounded cells (). However, this same effect was not observed in either of the other cell lines. The SK-N-AS and SK-N-SH cells instead displayed a significant decrease in rounded cells following Rac1 depletion (). We considered that the differences between the cell lines might represent differences in efficiency of Rac1 depletion between the cell lines. Comparison of the percentage of Rac protein remaining following Rac1 siRNA revealed that depletion was equally efficient between cell lines (). To independently confirm the morphological responses, we next assessed morphologies of cells treated with the potent Rac inhibitor EHT 1864.Citation20,21 This treatment caused an increase in the percentage of rounded SHEP cells, but did not affect the morphology of either the SK-N-AS or the SK-N-SH cells (). Thus, while SHEP cells undergo a Rac1-mediated switch to rounded morphology, neither the SK-N-AS nor the SK-N-SH exhibit the same Rac-dependent morphology switch.
Figure 3. Rac1 depletion. A–C. Western blots showing total Rac expression in (A) SHEP, (B) SK-N-AS and (C) SK-N-SH cells, following treatment with Rac1 siRNA. HSP70 expression is shown to confirm equal protein loading. Histograms show the corresponding quantification of total Rac protein expression after siRNA, as indicated. Data shown are the average fold change relative to control siRNA from triplicate biological repeats. * p < 0.05; ** p < 0.01, *** p < 0.001, Students' t-test.
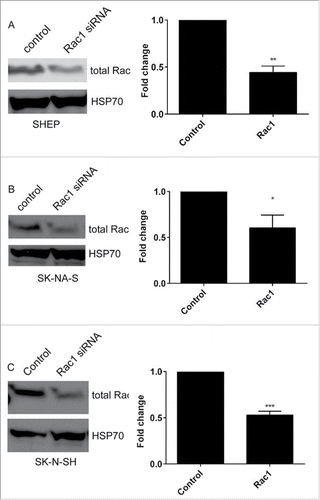
Figure 4. Rac1-dependent morphological switch. A–C. Representative confocal images (maximum projections) show cell morphology following Rac1 siRNA in (A) SHEP, (B) SK-N-AS and (C) SK-N-SH cells. Cells were fixed and stained with phalloidin. Insets show magnified images. Histograms show the corresponding quantification of the percentage of round cells in 3D collagen gels following Rac1 siRNA, or treatment with the Rac inhibitor EHT 1864. * p < 0.05, ** p < 0.01, *** p < 0.001, NS = not significant, Students' t-test. Data shown are the averages of the circularity of individual cells from 9 individual collagen gels, from 3 independent experiments. (D) Percentage of Rac1 protein remaining following Rac1 siRNA in the indicated cell lines. There was no significant difference in the efficiency of knockdown between the cell lines. p = 0.5175, one-way ANOVA.
Rac inhibition and multicellular spheroid invasion
The differential responses to Rac inhibition raised the question of the role Rac might play in the invasive behavior of these 3 cell lines. Consideration of both single- and collective- cell migration mechanisms is particularly relevant for neuroblastoma given that neural crest cells, the highly motile cell of origin for neuroblastoma, exhibit both individual and collective invasion.Citation13 Since the key biological features of collective invasion are recapitulated by culture of multicellular spheroids (MCS) embedded in 3D collagen,Citation14-19 we established and analyzed neuroblastoma MCS. Immediately after embedding, the SHEP and SK-N-SH MCS formed dense, regular balls of cells (). By contrast the SK-N-AS MCS were less regularly shaped (). We then examined collagen-embedded MCS after 48 hours to determine whether the cells invaded into the surrounding collagen gels (). This revealed distinct behaviors between the cell lines. The SHEP cells and SK-N-AS cells were scattered throughout the surrounding matrix. By contrast, the SK-N-SH spheroids retained a visible central core after 48 hours, but multicellular sheets of cells were observed extending out from the core. Immunofluorescence analysis of SK-N-SH MCS revealed a mix of collective sheet invasion, evidenced by prominent actin localization at the cell-cell boundaries of cells in the invasive sheets, and individual elongated cells (). In some cases small colonies that had broken off from the central spheroid also exhibited cell-cell actin boundary (). In contrast, cells that were further dispersed from the main colony were more elongated in shape and displayed prominent F-actin cables ().
Figure 5. MCS invasion. A. MCS embedded in 3D collagen gels. Bright field images showing example spheroids for the indicated cell lines are shown upon initial plating (0 time) and 48 hours after plating. Data represents > 10 spheroids, over > 4 individual experiments. B. Merged image of phalloidin (red) and Hoechst Blue (blue) stained SK-N-SH MCS 48 hours after plating. Lower panel shows magnified image of boxed region in the top panel. Arrow points to collectively invading island of cells, asterisks highlight examples of individually invading cells. C-E. Representative time-lapse montages of MCS from the indicated cell lines over a 24 hour time period. Colored images on the right-hand side display paths traced by individual cells as they invade away from the MCS (refer to Supplementary movie 1 to see the paths traced over time). (C) Arrows indicate cells displaying the typical invasion morphology of the long leading edge and rounded cell body, asterisks indicate paused polygonal-shaped cells. (D) Arrows point to highly round cells and asterisks highlight polygonal-shaped cells. (E) Arrow heads in 8 hr panel indicate the first individual, elongated leader cells to appear. Arrows indicate individual elongated cells. The area between white circular lines indicates area of collective migration. Representative spheroids for all cell lines were selected from > 5 spheroids over 3 individual experiments.
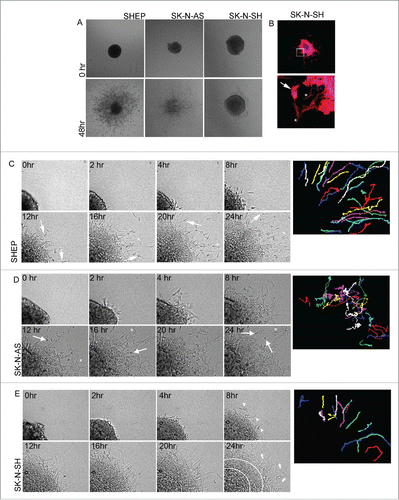
In order to analyze cellular morphologies during invasion, we performed time-lapse imaging of embedded spheroids from each of the high Rac expressing cell lines. Invasive SHEP cells extended long, thin protrusions in the direction of migration followed by a rounded cell body (Supplementary movie 1 and ). As the invasive SHEP cells move forward, a thin trailing edge is frequently seen that subsequently retracts into the cell body. Periodically the cells slow and adopt a polygonal shape (). The SHEP cells spread radially out from the main spheroid as demonstrated by the paths traced by the invading cells, where the cells move with high persistence into the cell-free areas of the gel ( and Supplementary movie 1). Invading SK-N-AS cells are either predominantly polygonal in shape () or have a highly rounded cell shape (). Interestingly the SK-N-AS cells have a highly random migration pattern, with cells frequently changing direction and some cells turning back and merging into the expanding spheroid mass (and Supplementary movie 1). Interestingly, although individual SK-N-AS cells escape the primary MCS earlier than either of the other cultures (compare the movies of each shown in Supplementary movie 1), the lack of directionality in their movement means that they do not move as far away from the main MCS and indeed many of the cells become incorporated into the expanding spheroid. Individual invasive cells from the SK-N-SH spheroids have a mesenchymal cell shape () and like the SHEP cells, radiate out into the cell-free matrix (and Supplementary movie 1). Behind the individual cells the leading edge of the expanding spheroid mass consists of loosely associated cells that extend long thin membrane projections into the surrounding matrix (). Thus although these cell lines are all characterized by high levels of Rac activity, they each exhibit unique invasive features in the 3D MCS invasion assay, with the SK-N-AS having the most distinctive behavior.
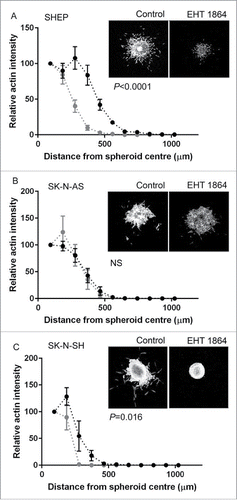
We next examined the effect of Rac inhibition on MCS invasion, through addition of the Rac inhibitor EHT 1864.Citation20,21 SHEP MCS treated with EHT 1864 were smaller than their control counterparts (). The treated MCS were both less dense in cell number and individual cells had invaded shorter distances. Thus Rac inhibition affected both proliferation and invasion of SHEP cells. Quantitatively, the total area covered by the SHEP MCS was significantly less following EHT 1864 treatment (). In contrast, the SK-N-AS MCS were unaffected by treatment with the Rac inhibitor () and this was confirmed by measurement of the distances covered by the spheroid (). Finally, Rac inhibition strongly blocked invasion by the SK-N-SH MCS. In this case, treatment with the inhibitor resulted in complete loss of the invasive cell fraction and instead the treated spheroids became regular in shape, with little evidence of either individual or collectively invading cells (). Confirming this, the distance covered by the EHT 1864-treated SK-N-SH MCS was significantly less than that of the control MCS (). In summary, these data reveal differential effects of Rac inhibition on the proliferation and invasion of the high Rac expressing cell lines and suggest that while SHEP and SK-N-SH require Rac activity for invasion the SK-N-AS MCS invade independently of Rac activation.
Figure 6. Rac GTPase regulation of MCS invasion. (A–C) Line graphs showing quantification of spheroid invasion, measured by relative actin intensity over the distance from the spheroid center for the indicated cell lines. Black dots and lines show data for control spheroids, gray dots and lines show data for MCS treated with EHT 1864 to inhibit Rac activity. Statistical comparisons performed using 2-way ANOVA. Also shown are representative confocal images (maximum projection) for spheroids embedded in collagen, after 48 hours of incubation under the indicated conditions.
Discussion
Our study has revealed that high levels of Rac expression are associated with the clinically heterogeneous class of neuroblastoma that lacks MYCN amplification. We examined Rac regulated morphologies in 3 neuroblastoma lines that have high Rac expression and lack MYCN amplification. We show that while the 3 lines exhibit elongated morphologies in 3D collagen (matching their 2D morphologies), they have different requirements for Rac in maintaining this elongated morphology and also in regulating MCS invasion.
It has previously been reported that S-type neuroblastoma cells lack MYCN amplificationCitation11 and the mesenchymal morphology that typifies S-type cells is highly consistent with the elongated single cell Rac-dependent 3D invasion mode.Citation7,8,22 This suggested the possibility of a functional relationship between MYCN status and Rac expression and indeed we find high Rac expression predominates in cells lacking MYCN amplification and of the S-type neuroblastoma subclass. An important question following this observation is to understand the signaling pathways that regulate Rac activity. Previous work has suggested a role for the focal adhesion docking protein NEDD9 in the Rac-dependent morphological switch.Citation7,23,24 However, our previous data has established that this is not the case in the SHEP cells.Citation9 Thus our findings suggests that there must be additional pathways that can regulate Rac activity, to determine elongated cell invasion and that this might be cell-type specific.
The SHEP cells maintained their elongated invasive morphology when cultured as MCS. The invasive cells generally oriented at 90° angles to the matrix surrounding the MCS, leading to a starburst-like appearance of the MCS embedded in 3D collagen. Interestingly, while mesenchymal cells are generally described as using an individual mode of cell invasion, it has previously been suggested that mesenchymal cells of the neural crest may exhibit a “cooperative” mode of invasion.Citation25 In this cooperative mode, contact inhibition between cells is proposed to restrict cellular protrusive activity toward the cell-free space, resulting in a front-to-back polarity that is therefore oriented toward the cell-free space. Since neuroblastoma cells are derived from neural crest cells, future work directed at understanding whether contact inhibition of locomotion plays a role in neuroblastoma invasion will be an important avenue of investigation. Notably, following Rac inhibition with EHT 1864 the SHEP MCS maintained their starburst appearance, however there were fewer cells and the distance traveled into the matrix was much reduced. Therefore while Rac appears to regulate the proliferation and invasion extent of the SHEP cells it does not appear to be required for invasion persistence.
In contrast to our findings with SHEP cells, Rac inhibition was shown to reduce cell rounding in the SK-N-AS cells. This surprising finding suggests that the same Rac-mediated morphological switch that occurs in SHEP —and other—cells is not present in the SK-N-AS cells. Thus our data has highlighted a diverse morphological response to Rac inhibition, beyond those that have previously been described.Citation5 Interestingly, Rac inhibition had no effect on the invasion or growth of SK-N-AS MCS. Given their overall elongated morphologies with prominent actin-stress fibers suggestive of an S-type/mesenchymal cell phenotype it is surprising that Rac inhibition had no effect on invasion of these cells. Rac is considered important for the extension of the leading edge membrane that is required for elongated/mesenchymal cell invasion.Citation12 However, clearly the SK-N-AS cells are still able to invade through the surrounding matrix, even in the presence of the Rac inhibitor. Together, these results suggest that the SK-N-AS cells invade in a Rac-independent manner. Notably, in contrast to the other cells, these cells moved with a highly random pattern of invasion.
The SK-N-SH cells exhibited different behavior from either of the other lines. Their morphology was not affected by Rac inhibition in the single cell cultures, but this was contrasted by a strong inhibitory effect of EHT 1864 treatment on SK-N-SH MCS invasion. Interestingly, the SK-N-SH cells constitute a mix of S-type and N-type cells.Citation26 Cells with S-type morphology were scattered individually around the periphery of the spheroid, while the rest of the colony consisted of cells that were tightly adhered to each other indicated by the cobblestone appearance of the actin filaments. This suggests that these adherent cells may represent the N-type proportion of the population. Importantly, there is considerable data now to suggest that when mixed, populations of cells may influence invasive behavior. Thus one cell type may induce the invasion of a second cell type.Citation27-29 Rac is an important regulator of this cooperative cell invasion. Potentially therefore the mixed N-type and S-type cells may be influencing each other, resulting in a Rac-dependent invasion.
Our study has revealed that high level Rac activity is associated with S-type neuroblastomas that lack MYCN amplification. Despite the observation that Rac inhibition differentially affected the 3 cell lines examined, it is important to note that invasion of 2 out of 3 of the cell lines was inhibited by treatment with EHT 1864, using a spheroid model that recapitulates important components of the in vivo invasion environment. Collectively, therefore, the data suggest that Rac GTPase may be an important player in metastatic, neuroblastomas lacking MYCN amplification.
Materials and methods
Cell lines and cell culture
Cultured neuroblastoma cell lines (SHEP, SK-N-AS, SK-N-SH, BE2C, IMR-32, CHP134) were kindly provided by Dr. Loretta Lau (Kids Research Institute, Sydney, Australia). Cell lines were maintained in Dulbecco's modified eagle's medium (DMEM) supplemented with 10% FBS. CHP134 cells were maintained in RPMI medium 1640 supplemented with 10% FBS and 1% L-Glutamine. Growth of single cell suspensions in 3D collagen gels was based on previously published protocols.Citation22 Briefly, cells were resuspended in 1.7mg/ml collagen solution (Collagen type I, rat tail [Corning #354236]; Neutralising Buffer [PBS, 100 mM HEPES], appropriate cell medium), and allowed to polymerise at 37°C, 5% CO2 for 1 hour. Complete medium with or without pharmacological agents, was added after gel polymerisation, and cultures then incubated for 24 hours.
Antibodies and reagents
The following antibodies were used: anti-pan-Rac (BD Bioscience), HSP70 (Sigma-Aldrich), TRITC-phalloidin (Sigma-Aldrich), and horseradish peroxidase-conjugated anti-mouse and anti-rabbit (Amersham and Biorad). Rac inhibition was achieved with 25µM EHT-1864 (Tocris). Isolation of active GTP-bound Rac GTPase was achieved with GST pulldowns as per manufacturer's instructions (Cell Biolabs Rac1 activation Assay Kit #STA-401-1). Levels were quantified by densitometry in ImageJ.
siRNA knockdown
Custom-designed Rac siRNAs were purchased from Invitrogen comprising sequences targeting human Rac1 (5'-GAGGCCUCAAGACAGUGUUUGACGA-3'). Control sequences for Rac knockdown experiments were Qiagen Allstar Non-targeting Control siRNA (Qiagen). Rac1 siRNAs were used at a final concentration of 10 nmol/L. Rac knockdown was achieved through siRNA transfection with Lipofectamine 2000 (Life Technologies), as per the manufacturer's instructions. Successful Rac knockdown was confirmed independently for all experiments.
Protein extraction, immunoblotting and immunofluorescence
Protein lysates were prepared by extraction with PTY lysis buffer, protein concentration measured using the Biocinchoninic acid (BCA) Protein Assay Kit (Pierce Biotechnology) and SDS-PAGE and immunoblotting were performed as previous described.Citation30 For immunofluorescence of cells grown on coverslips, 0.5 × 10⁵-1 × 10⁵ cells were plated onto collagen (50 µg/ml) coated glass coverslips and cultured for 24 hours. Cells were then fixed in 4% paraformaldehyde (PFA) and permeabilised in 0.2% Triton X-100 in PBS. Following blocking in PBS containing 1% Bovine Serum Albumin (BSA), cells were incubated with TRITC-phalloidin (Sigma-Aldrich) and Hoescht Blue Nuclear stain. Coverslips were mounted using Calbiochem fluorsave reagent (Merck Millipore). Fluorescent imaging was performed on an Olympus BX50 with a QImaging ExiBlue camera (QImaging) operated by Image Pro Plus 7 software (Media Cybernetics) with a 60x oil objective. Cells embedded in 3D collagen gels were fixed with 4% PFA, and treated with 0.15M Glycine in PBS to quench background fluorescence. Collagen gels were then permeabilised in 0.2% Triton X-100 in PBS and blocked in PBS containing 1% BSA and 1% Donkey Serum. Collagen gels were incubated with TRITC-phalloidin and Hoescht Blue nuclear stain and stored in PBS for imaging. Confocal z-stack imaging was performed on a Leica SP5 II confocal microscope with a 10x air objective, and maximum projection and analyses were performed using Leica LAS software, and Metamorph (v7.7) software.
Multicellular spheroid preparation and embedding in collagen
In order to generate spheroids, cells were first seeded on 0.8% agarose coated 96-well plates in media and incubated at 37°C for 48 hours. The non-adhesive surface of the agarose induces the cells to compact together to form a spheroid. Following 48 hours of compaction, spheroids were washed in PBS and embedded in 1.7 mg/ml collagen gels. After 1 hour of gel polymerization at 37°C, complete media with or without pharmacological agents was added, and spheroids were incubated for 48 hours. To facilitate comparison between cells lines, initial experiments were carried out to determine the numbers of each cell line required to provide similar sized spheroids at the time of initial plating (data not shown). Resulting spheroids were then embedded in collagen gels. After 1 hour of gel polymerization, media or media plus inhibitors was added and cultures incubated for a further 48 hours.
Time-lapse imaging of spheroids
After 1 hour of gel polymerization, collagen embedded spheroids were treated with CO2-independent media supplemented with 10% FBS (v/v). Brightfield time lapse images were captured every 5 minutes for 24 hours, using an ORCA ERG cooled CCD camera (Hamamatsu, SDR Clinical Technology) and a 20x air objective on an Olympus IX81 inverted microscope equipped with an environmental heat chamber maintained at 37°C, and operated by Metamorph v6.3 software (Molecular Devices), as previously described.Citation31
Analysis of morphology and invasion and image preparation
Integrated morphometry analysis of cell morphology was carried out with Metamorph (v7.7) software). Cell shape was determined by measuring the shape factor (values of 1 indicating a perfect circle) of cells from maximum z-projections of confocal slices taken of phalloidin-stained cells. Cell shape factors were grouped into bins of 0.25 intervals using Graph Pad Prism (V6) and cells with shape factors greater than 0.875 were classified as round, all other cells were elongated. For analysis of spheroid invasion, concentric circle analysis was carried out with ImageJ software. A series of concentric circles (16 circles, inner radius of 30, outer radius of 484) was overlayed on spheroid images, and the average pixel intensity along the perimeter of each circle was calculated. All spheroids were normalized to the average pixel intensity of the inner circle. The resulting data were then plotted relative to the distance from the center of the spheroid. Densitometry analysis was achieved with ImageJ. Statistical analyses were performed in Graphpad Prism (V6). Final images and gray level adjustments were prepared in Adobe Photoshop.
Disclosure of potential conflicts of interest
No potential conflicts of interest were disclosed.
KCAM_A_1183868_Supplement.zip
Download Zip (5.5 MB)Funding
This work was generously supported by a Childhood Cancer Cytoskeleton Consortium (C4) Fellowship from The Kids' Cancer Project to C.M.
References
- Brodeur GM. Neuroblastoma: biological insights into a clinical enigma. Nature Rev Cancer 2003; 3:203-16; PMID:12612655; http://dx.doi.org/10.1038/nrc1014
- Castleberry RP. Neuroblastoma. Eur J Cancer 1997; 33:1430-7; PMID:9337686; http://dx.doi.org/10.1016/S0959-8049(97)00308-0
- Asgharzadeh S, Pique-Regi R, Sposto R, Wang H, Yang Y, Shimada H, Matthay K, Buckley J, Ortega A, Seeger RC. Prognostic significance of gene expression profiles of metastatic neuroblastomas lacking MYCN gene amplification. J Natl Cancer Inst 2006; 98:1193-203; PMID:16954472; http://dx.doi.org/10.1093/jnci/djj330
- Ross RA, Biedler JL, Spengler BA. A role for distinct cell types in determining malignancy in human neuroblastoma cell lines and tumors. Cancer Lett 2003; 197:35-9; PMID:12880957; http://dx.doi.org/10.1016/S0304-3835(03)00079-X
- Sanz-Moreno V, Marshall CJ. The plasticity of cytoskeletal dynamics underlying neoplastic cell migration. Curr Opin Cell Biol 2010; 22:690-6; PMID:20829016; http://dx.doi.org/10.1016/j.ceb.2010.08.020
- Friedl P, Wolf K. Plasticity of cell migration: a multiscale tuning model. J Exp Med 2010; 207:11-9; PMID:19951899; http://dx.doi.org/10.1084/JEM2071OIA4
- Sanz-Moreno V, Gadea G, Ahn J, Paterson H, Marra P, Pinner S, Sahai E, Marshall CJ. Rac activation and inactivation control plasticity of tumor cell movement. Cell 2008; 135:510-23; PMID:18984162; http://dx.doi.org/10.1016/j.cell.2008.09.043
- Yamazaki D, Kurisu S, Takenawa T. Involvement of Rac and Rho signaling in cancer cell motility in 3D substrates. Oncogene 2009; 28:1570-83; PMID:19234490; http://dx.doi.org/10.1038/onc.2009.2
- Zhong J, Bach CT, Shum MS, O'Neill GM. NEDD9 Regulates 3D Migratory Activity Independent of the Rac1 Morphology Switch in Glioma and Neuroblastoma. Mol Cancer Res 2014; 12:264-73; PMID:24337070; http://dx.doi.org/10.1158/1541-7786.MCR-13-0513
- Sahai E, Marshall CJ. Differing modes of tumour cell invasion have distinct requirements for Rho/ROCK signalling and extracellular proteolysis. Nat Cell Biol 2003; 5:711-9; PMID:12844144; http://dx.doi.org/10.1038/ncb1019
- Spengler BA, Lazarova DL, Ross RA, Biedler JL. Cell lineage and differentiation state are primary determinants of MYCN gene expression and malignant potential in human neuroblastoma cells. Oncol Res 1997; 9:467-76; PMID:9495452
- O'Neill GM. The coordination between actin filaments and adhesion in mesenchymal migration. Cell Adh Migr 2009; 3:355-7; PMID:19684475; http://dx.doi.org/10.4161/cam.3.4.9468
- Theveneau E, Mayor R. Neural crest delamination and migration: from epithelium-to-mesenchyme transition to collective cell migration. Dev Biol 2012; 366:34-54; PMID:22261150; http://dx.doi.org/10.1016/j.ydbio.2011.12.041
- Wiercinska E, Naber HP, Pardali E, van der Pluijm G, van Dam H, ten Dijke P. The TGF-beta/Smad pathway induces breast cancer cell invasion through the up-regulation of matrix metalloproteinase 2 and 9 in a spheroid invasion model system. Breast Cancer Res Treat 2011; 128:657-66; PMID:20821046; http://dx.doi.org/10.1007/s10549-010-1147-x
- Pettee KM, Dvorak KM, Nestor-Kalinoski AL, Eisenmann KM. An mDia2/ROCK signaling axis regulates invasive egress from epithelial ovarian cancer spheroids. PloS One 2014; 9:e90371; PMID:24587343; http://dx.doi.org/10.1371/journal.pone.0090371
- Haeger A, Krause M, Wolf K, Friedl P. Cell jamming: collective invasion of mesenchymal tumor cells imposed by tissue confinement. Biochim Biophys Acta 2014; 1840:2386-95; PMID:24721714; http://dx.doi.org/10.1016/j.bbagen.2014.03.020
- Friedl P, Wolf K. Tube travel: the role of proteases in individual and collective cancer cell invasion. Cancer Res 2008; 68:7247-9; PMID:18794108; http://dx.doi.org/10.1158/0008-5472.CAN-08-0784
- Wolf K, Wu YI, Liu Y, Geiger J, Tam E, Overall C, Stack MS, Friedl P. Multi-step pericellular proteolysis controls the transition from individual to collective cancer cell invasion. Nat Cell Biol 2007; 9:893-904; PMID:17618273; http://dx.doi.org/10.1038/ncb1616
- Albrengues J, Meneguzzi G, Gaggioli C. Analysis of collective invasion of carcinoma cells in a 3D organotypic model. Methods Mol Biol (Clifton, NJ) 2013; 961:243-52; PMID:23325648; http://dx.doi.org/10.1007/978-1-62703-227-8_15
- Onesto C, Shutes A, Picard V, Schweighoffer F, Der CJ. Characterization of EHT 1864, a novel small molecule inhibitor of Rac family small GTPases. Methods Enzymol 2008; 439:111-29; PMID:18374160; http://dx.doi.org/10.1016/S0076-6879(07)00409-0
- Shutes A, Onesto C, Picard V, Leblond B, Schweighoffer F, Der CJ. Specificity and mechanism of action of EHT 1864, a novel small molecule inhibitor of Rac family small GTPases. J Biol Chem 2007; 282:35666-78; PMID:17932039; http://dx.doi.org/10.1074/jbc.M703571200
- Lees JG, Bach CTT, Bradbury P, Paul A, Gunning PW, O'Neill GM. The actin-associating protein Tm5NM1 blocks mesenchymal motility without transition to amoeboid motility. Oncogene 2011; 30:1241-51; PMID:21076470; http://dx.doi.org/10.1038/onc.2010.516
- Ahn J, Sanz-Moreno V, Marshall CJ. The metastasis gene NEDD9 product acts through integrin beta3 and Src to promote mesenchymal motility and inhibit amoeboid motility. J Cell Sci 2012; 125:1814-26; PMID:22328516; http://dx.doi.org/10.1242/jcs.101444
- Zhong J, Baquiran JB, Bonakdar N, Lees J, Ching YW, Pugacheva E, Fabry B, O'Neill GM. NEDD9 stabilizes focal adhesions, increases binding to the extra-cellular matrix and differentially effects 2D versus 3D cell migration. PloS One 2012; 7:e35058; PMID:22509381; http://dx.doi.org/10.1371/journal.pone.0035058
- Theveneau E, Mayor R. Can mesenchymal cells undergo collective cell migration? The case of the neural crest. Cell Adh Migr 2011; 5:490-8; PMID:22274714; http://dx.doi.org/10.4161/cam.5.6.18623
- Thiele CJ. Neuroblastoma cell lines. In: Masters J (eds). Human Cell Culture 1998; vol. 1. Kluwer Academic Publishers: Lancaster, UK:21-53.
- Carey SP, Starchenko A, McGregor AL, Reinhart-King CA. Leading malignant cells initiate collective epithelial cell invasion in a three-dimensional heterotypic tumor spheroid model. Clin Exp Metastasis 2013; 30:615-30; PMID:23328900; http://dx.doi.org/10.1007/s10585-013-9565-x
- Gaggioli C, Hooper S, Hidalgo-Carcedo C, Grosse R, Marshall JF, Harrington K, Sahai E. Fibroblast-led collective invasion of carcinoma cells with differing roles for RhoGTPases in leading and following cells. Nat Cell Biol 2007; 9:1392-400; PMID:18037882; http://dx.doi.org/10.1038/ncb1658
- Shimada H, Chatten J, Newton WA, Jr., Sachs N, Hamoudi AB, Chiba T, Marsden HB, Misugi K. Histopathologic prognostic factors in neuroblastic tumors: definition of subtypes of ganglioneuroblastoma and an age-linked classification of neuroblastomas. J Natl Cancer Inst 1984; 73:405-16; PMID:6589432
- Cowell LN, Graham JD, Bouton AH, Clarke CL, O'Neill GM. Tamoxifen treatment promotes phosphorylation of the adhesion molecules, p130Cas/BCAR1, FAK and Src, via an adhesion-dependent pathway. Oncogene 2006; 25:7597-607; PMID:16799644; http://dx.doi.org/10.1038/sj.onc.1209747
- Bach CT, Creed S, Zhong J, Mahmassani M, Schevzov G, Stehn J, Cowell LN, Naumanen P, Lappalainen P, Gunning PW, et al. Tropomyosin isoform expression regulates the transition of adhesions to determine cell speed and direction. Mol Cell Biol 2009; 29:1506-14; PMID:19124607; http://dx.doi.org/10.1128/MCB.00857-08
- Oberthuer A, Berthold F, Warnat P, Hero B, Kahlert Y, Spitz R, Ernestus K, Konig R, Haas S, Eils R, et al. Customized oligonucleotide microarray gene expression-based classification of neuroblastoma patients outperforms current clinical risk stratification. J Clinical Oncol 2006; 24:5070-8; PMID:17075126; http://dx.doi.org/10.1200/JCO.2006.06.1879
- Shang X, Burlingame SM, Okcu MF, Ge N, Russell HV, Egler RA, David RD, Vasudevan SA, Yang J, Nuchtern JG. Aurora A is a negative prognostic factor and a new therapeutic target in human neuroblastoma. Mol Cancer Ther 2009; 8:2461-9; PMID:19671766; http://dx.doi.org/10.1158/1535-7163.MCT-08-0857
- Khanna C, Jaboin JJ, Drakos E, Tsokos M, Thiele CJ. Biologically relevant orthotopic neuroblastoma xenograft models: primary adrenal tumor growth and spontaneous distant metastasis. In vivo (Athens, Greece) 2002; 16:77-85; PMID:12073775
- Schwankhaus N, Gathmann C, Wicklein D, Riecken K, Schumacher U, Valentiner U. Cell adhesion molecules in metastatic neuroblastoma models. Clin Exp Metastasis 2014; 31:483-96; PMID:24549749; http://dx.doi.org/10.1007/s10585-014-9643-8
- Byrne FL, Yang L, Phillips PA, Hansford LM, Fletcher JI, Ormandy CJ, McCarroll JA, Kavallaris M. RNAi-mediated stathmin suppression reduces lung metastasis in an orthotopic neuroblastoma mouse model. Oncogene 2014; 33:882-90; PMID:23396365; http://dx.doi.org/10.1038/onc.2013.11
- Yoshihara T, Esumi N, Humphries MJ, Imashuku S. Unique expression of integrin fibronectin receptors in human neuroblastoma cell lines. Int J Cancer 1992; 51:620-6; PMID:1534785; http://dx.doi.org/10.1002/ijc.2910510419
- Shusterman S, Grupp SA, Barr R, Carpentieri D, Zhao H, Maris JM. The angiogenesis inhibitor tnp-470 effectively inhibits human neuroblastoma xenograft growth, especially in the setting of subclinical disease. Clin Cancer Res 2001; 7:977-84; PMID:11309349
