
ABSTRACT
Voltage-gated proton channels (VSOP/Hv1) reportedly promote reactive oxygen species (ROS) production in several immune cell types. However, we recently reported that primary microglia from VSOP/Hv1-deficient mice show higher ROS production than those from WT mice. Microglia may show a distinct activation status between WT and VSOP/Hv1-deficient cells, leading to a distinct level of ROS production between them. This is unlikely, however, because ROS production in VSOP/Hv1-deficient microglia remained higher than in WT microglia when the cells were exposed to LPS. Further, this increase in ROS production in VSOP/Hv1-deficient cells was not observed in macrophages, which suggests microglia have a unique mechanism of VSOP/Hv1-dependent ROS regulation. The mechanism underlying this unconventional ROS regulation by VSOP/Hv1 in microglia is discussed.
Introduction
VSOP/Hv1, which is encoded by the gene Hvcn1, is a voltage gated proton channel consisting of a voltage-sensor domain without the pore domain characteristic of other ion channels.Citation1,2 The voltage-sensor domain plays a dual role as both a proton permeation pathway and voltage sensor. VSOP/Hv1 has diverse biological functions, but its role in the regulation of reactive oxygen species (ROS) production in various immune cell types, including neutrophils, eosinophils, B lymphocytes, T lymphocytes, macrophages and microglia,Citation3-12 has been the most intensively studied. VSOP/Hv1 is thought to support ROS production in these cells by exporting excess intracellular protons that accumulate during respiratory bursts, as intracellular acidification and membrane depolarization inhibit nicotinamide adenine dinucleotide phosphate (NADPH) oxidase activity.Citation6,13 On the other hand, we recently reported that extracellular ROS production is markedly higher in primary cultures of Hncn1−/− microglia than in WT microglia, which suggests VSOP/Hv1 also exerts suppressive effects on ROS production in microglia.Citation14 Moreover, our findings indicated that the impact of VSOP/Hv1-mediated ROS regulation on neuronal damage during brain ischemia appears to depend on the age of the animals, indicating that the effect of VSOP/Hv1 on microglial ROS levels is dependent on the state of the microglia. Considering the potential significance of VSOP/Hv1 as a therapeutic target for ischemic stroke or other neuropathology,Citation12,14,15 it is important to fully understand the mechanisms by which VSOP/Hv1 affects ROS production. In the present study, we performed several experiments to gain insight into the mechanism of the suppressive ROS regulation by VSOP/Hv1.
Results
Analysis of gp91 expression and ROS production in WT and Hvcn1−/− microglia with and without LPS treatment
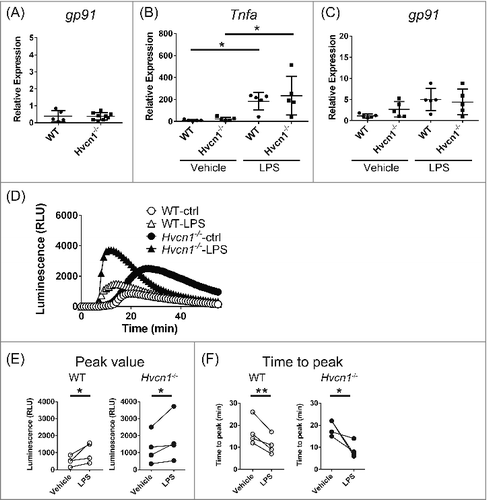
In microglia, the NADPH oxidase complex plays a crucial role in respiratory bursts.Citation16-19 There are several possible mechanisms that could account for the upregulated ROS generation in Hvcn1−/− microglia. For example, because the assembly of NADPH oxidase from membrane-bound and cytosolic subunits is essential for enzyme function, ROS production could be enhanced by promoting translocation of cytosolic subunits to the membrane or by phosphorylating subunits.Citation17-19 We recently reported that altered actin dynamics, which governs trafficking of the subunits to the membrane,Citation20-23 accounts at least in part for the increased ROS production in Hvcn1−/− microglia.Citation14 Nevertheless, it is likely that factors other than actin dynamics also contribute to the enhanced ROS production in Hvcn1−/− microglia. Specifically, the expression of NADPH oxidase subunits is frequently upregulated upon activation of microglia,Citation24,25 which could contribute to the enhanced ROS production seen in Hvcn1−/− microglia. We therefore compared levels of gp91 mRNA, which encodes the transmembrane component of NADPH oxidase, between WT and Hvcn1−/− microglia. However, we found that there was no significant difference in gp91 expression between WT and Hvcn1−/− microglia (; P = 0.9308, unpaired t-test). We then examined the effect of microglial activation on gp91 expression and ROS production by treating WT and Hvcn1−/− microglia with 100 ng/ml LPS for 2 days. The pro-inflammatory response of microglia was observed in both genotypes, as evidenced by the significant upregulation of Tnfa (; P < 0.05 for both, Bonferroni multiple comparisons, multiplicity adjusted P-values). On the other hand, we saw no difference in the levels of Tnfa expression between WT and Hvcn1−/− microglia in either the vehicle or LPS treatment groups (; P>0.9999 for both, Bonferroni multiple comparisons, multiplicity adjusted P-values). We also analyzed gp91 expression in the same groups used to assess Tnfa expression. Consistent with an earlier report that inflammatory responses upregulate gp91 expressionCitation24,25, cells treated with LPS tended to show greater gp91 expression than vehicle-treated groups (; in WT, P = 0.0564, Bonferroni multiple comparisons, multiplicity adjusted P-value). However, we detected no difference in gp91 expression between WT and Hvcn1−/− microglia in the LPS treatment group (; P>0.9999, Bonferroni multiple comparisons, multiplicity adjusted P-values). When we then measured extracellular ROS induced by 1 μM PMA in the LPS and vehicle treatment groups (), we consistently observed that LPS accelerates and strengthens the ROS production in both WT and Hvcn1−/− microglia, as evidenced by the increase in peak amplitude () and decrease in the time to peak (). Notably, we also found that ROS production by Hvcn1−/− microglia remains higher than the production by WT microglia in the LPS treatment groups (, ).
Figure 1. Comparison of gene expression and ROS production between WT and Hvcn1−/− microglia in LPS-treated or untreated groups. (A) Using quantitative PCR, gp91 mRNA levels were compared between WT and Hvcn1−/− microglia. There was no obvious difference between them (P = 0.9308, unpaired t-test, n = 5 for WT, n = 9 for Hvcn1−/−). (B, C) Tnfa and gp91 mRNA levels in WT and Hvcn1−/− microglia with or without LPS treatment for 2 days. (B) Both WT and Hvcn1−/− microglia showed obvious increases in Tnfa expression, confirming the inflammatory responses in these cells. There was no significant difference in Tnfa expression between WT and Hvcn1−/− microglia in either vehicle or LPS treatment groups (P > 0.9999). (C) LPS treatment moderately upregulated gp91 expression (in WT, P = 0.0564), but there was no difference between WT and Hvcn1−/− microglia in either the vehicle or LPS treatment groups (P > 0.9999). *P < 0.05, Bonferroni multiple comparisons, multiplicity adjusted P-values, n = 5 for each. (D) Representative chemiluminescence signals showing the time course of extracellular superoxide anion production by WT or Hvcn1−/− microglia in vehicle and LPS treatment groups; 1 μM PMA was applied at 5 min. LPS treatment obviously accelerated the response and increased its magnitude in both WT and Hvcn1−/− microglia. ROS production was enhanced in Hvcn1−/− microglia. (E, F) Statistical data showing that LPS increases and accelerates ROS production in WT and Hvcn1−/− microglia. (E) Peak values of PMA responses are significantly upregulated by LPS in both WT and Hvcn1−/− microglia. *P<0.05, ratio paired t-test. (F) Time to peak of the PMA response is significantly reduced by LPS both in WT and Hvcn1−/− microglia. *P<0.05 and **p<0.01, ratio paired t-test.
Enhanced ROS production in the absence of VSOP/Hv1 is observed in microglia but not in macrophages
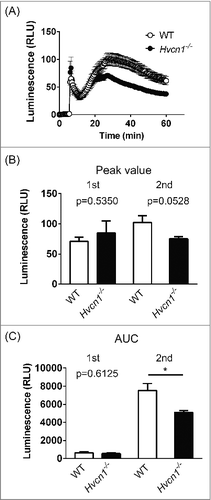
Because we observed enhanced ROS production in Hvcn1−/− microglia, irrespective of their activation status, we examined whether a similar phenomenon also occurs in Hvcn1−/− macrophages, which share multiple features in common with microglia. In contrast to microglia, Hvcn1−/− macrophages showed weaker ROS production in response to PMA than did WT macrophages (, P<0.01, two-way ANOVA, n = 5 for each). When peritoneal macrophages were stimulated with PMA, bimodal responses were observed both in WT and Hvcn1−/− cells that had also been observed in neutrophils and T-cells.Citation8,14 At the second peak, the response of Hvcn1−/− macrophages was about 30% smaller than in WT macrophages ( and , in WT vs Hvcn1−/−: for peak value, 102.2 ± 11.34 vs 75.25 ± 3.469, P = 0.0528; for area under the response curve (AUC), 7533 ± 763.0 vs 5117 ± 181.4, P<0.05, n = 5 for both). The temporal pattern of the difference was similar to that in neutrophils and T-cells, though the magnitude of the difference in macrophages was smaller than in neutrophils or T-cells, which showed around a 3-fold difference between WT and Hvcn1−/− cells.Citation8,14 Collectively then, ROS production in Hvcn1−/− animals is enhanced in microglia but reduced in macrophages, suggesting that microglia have a unique mechanism governing ROS production.
Figure 2. Comparison of ROS production in WT and Hvcn1−/− peritoneal macrophages. (A) Time course of extracellular superoxide anion production in WT (open circles) and Hvcn1−/− (filled circles) macrophages after stimulation with 1 μM PMA. After PMA was applied at 5 min, bimodal responses were observed. Data are means ± SEM. P<0.05, two-way ANOVA, n = 5 for each. (B) Luminescence at the first and second peaks in WT and Hvcn1−/− macrophages. There was a moderate difference at the second peak (P = 0.0528; unpaired t-test). (C) Area under the response curve (AUC) calculated for first and second peaks. For the first peak, the calculation goes from the onset to the valley in the bimodal responses. For second peak, the calculation goes from the valley to the end of recording. At the second peak, there was a significant difference between WT and Hvcn1−/− macrophages. *P<0.05, unpaired t-test.
Comparison of ROS production in primary cultured microglia and neutrophils
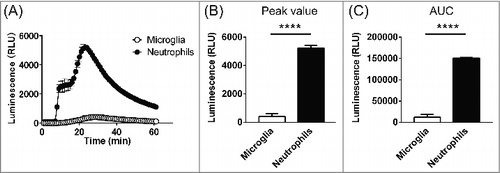
Finally, the levels of ROS production were compared between microglia and neutrophils stimulated using 1μM PMA. Neutrophils exhibited bimodal responses to PMA stimulation (). Moreover, ROS production by neutrophils was much greater than by microglia (P<0.0001, two-way ANOVA, n = 3 for each), with neutrophils showing about 12-fold greater peak ROS production (426.0 ± 197.6 vs 5,240 ± 170.1; n = 3, P<0.0001) and AUC (12,078 ± 6,059, n = 3 vs 150,427 ± 1,623; n = 3, P<0.0001).
Figure 3. Comparison of ROS production in microglia and neutrophils. (A) Time course of the extracellular superoxide anion signal in microglia (open circles) and neutrophils (filled circles) after stimulation with 1 μM PMA (5 min). The responses correspond to the signal from 1000 cells from both cell types under identical conditions. Data are means ± SEM. P<0.0001, two-way ANOVA, n = 3 for each. (B) Peak luminescent signals in microglia and neutrophils. P<0.0001, unpaired t-test. (C) AUCs calculated by summing the values from the onset of stimulation to the end of recording. P<0.0001, unpaired t-test.
Discussion
Activation does not account for the enhanced ROS production in Hvcn1−/− microglia
In the present study, we compared the expression of gp91 between WT and Hvcn1−/− microglia to test the idea that the enhanced ROS production in Hvcn1−/− microglia is attributable to a difference in the expression of NADPH oxidase subunits. However, we observed no obvious difference between the two genotypes in that regard. In addition, when we applied LPS, which is known to activate microglia by inducing a pro-inflammatory response,Citation26 similar levels of Tnfa expression, a widely used inflammatory marker, were detected in WT and Hvcn1−/− microglia. Thus, LPS strongly induces activation in both WT and Hvcn1−/− microglia. In the present study, microglial activation upregulated gp91 expression (), as previously reported.Citation24,25 However, there was no obvious difference in gp91 expression between WT and Hvcn1−/− microglia in LPS-treated cells (). This is consistent with our recent immunohistochemical results showing that expression of p67, a cytosolic NADPH oxidase subunit, is upregulated by microglial activation and that expression of p67 is similar in WT and Hvcn1−/− microglia treated with LPS.Citation14 On the other hand, enhanced ROS production in Hvcn1−/− microglia was still observed in LPS-treated cells. Furthermore, it is noteworthy that ROS production was even higher in vehicle-treated Hvcn1−/− microglia than LPS-treated WT microglia (), though expression of gp91 is relatively lower in vehicle-treated Hvcn1−/− microglia than LPS-treated WT microglia (). These results indicate that expression levels of NADPH oxidase subunits cannot account for the enhanced ROS production in Hvcn1−/− microglia.
In addition, while microglial activation by LPS increased ROS production in parallel with shortening of time to peak (), the enhancement in ROS production seen in Hvcn1−/− microglia in the absence of LPS was not accompanied by shortening of time to peak ( and our recent studyCitation14). These observations indicate that the activation status of microglia also does not account for the enhanced ROS production in Hvcn1−/− microglia.
Enhanced ROS production related to Hvcn1 deficiency is unique to microglia
We found that the effect of Hvcn1 deficiency in macrophages was opposite that of microglia – i.e., ROS production was lower in Hvcn1−/- than WT macrophages, though the difference was more moderate than in neutrophils or T-cells. Thus, microglia have a unique mechanism for ROS production that is differently regulated by VSOP/Hv1 than in other cell types. It is noteworthy in that regard that the bimodal response observed in macrophages is common to neutrophils and T-cells, but is not observed in microglia. As shown in and our recent study,Citation14 microglia exhibit a single-peaked response to both PMA and zymosan. When we focused on the bimodal responses observed in macrophages, neutrophils and T-cells, the suppression of ROS production caused by Hvcn1 deficiency was only observed in the second phase (second peak in the present study; and our other studiesCitation8,14). While the mechanism underlying these separate responses is not completely understood, some studies suggest that the two responses are triggered by separate signaling cascades in, perhaps, adhesion-dependent or -independent phases.Citation27-30 It is therefore possible that the supportive function of VSOP/Hv1 in ROS production is limited to specific conditions, and microglia lack that supportive function during respiratory bursts.
Insight into the difference in ROS production between microglia and neutrophils
VSOP/Hv1 supports NADPH oxidase activity by exporting excess protons generated during ROS production. In our recent study,Citation14 we suggested the level of ROS production in microglia may be too small to affect membrane potential of these cells,Citation31 reducing the need for charge compensation. We based that idea on our observation that PMA did not affect the membrane potential in either WT or Hvcn1−/− microglia (Fig S4B in our recent studyCitation14). By contrast, PMA induces strong depolarization in neutrophils.Citation6,14 In the present study, therefore, we quantitatively compared extracellular superoxide anion production between microglia and neutrophils (). As expected, both the peak and integrated (AUC) luminescence signals were an order of magnitude greater with neutrophils than microglia ( and ). Considering the smaller size of neutrophils, it may make sense that microglia do not show as prominent depolarization during respiratory bursts. Thus, the requirement for charge compensation in microglia should not be as high as in neutrophils during respiratory bursts. Nonetheless, in peritoneal macrophages, whose ROS production was also much lower than in neutrophils, ROS production was reduced in Hvcn1−/− cells, though the difference was moderate compared to neutrophils (). It thus appears that the charge compensation function of VSOP/Hv1 during respiratory bursting plays some role in macrophages. It will be also important to consider the possibility that other charge compensatory mechanisms suggested by other studies (voltage-gated K+ channels, Ca2+-activated K+ channels and Cl− channels)Citation32-36 function during respiratory burst, reducing the necessity of VSOP/Hv1 for charge compensation.
Overall, the present work and our recent studyCitation14 shed light on the unexpected function of VSOP/Hv1 in microglial ROS regulation. In the future, it will be important to determine the molecular mechanism underlying this unconventional regulation of ROS production in microglia as well as its relationship with neuropathology, which has been suggested by studies of mice deficient in VSOP/Hv1.Citation12,14,15
Materials and Methods
Reagents
Phorbol myristate acetate (PMA) and lipopolysaccharide (LPS) were purchased from Sigma (St Louis, MO). PMA was dissolved in DMSO at 1.6 mM, and LPS was dissolved in H2O at 10 mg/mL. They were kept in −30 ºC.
Animals
The Hvcn1−/− mice used in this study were previously described in detail.Citation14 In these animals, exon 5 of Hvcn1 is flanked by two loxP sites and is completely deleted from the entire body by crossing with CAG-cre transgenic mice.Citation37 The elimination of VSOP/Hv1 activity in these mice was confirmed in our earlier study.Citation14 All animal procedures were approved by the Animal Care and the Use Committee of Osaka University and Niigata University.
Preparation of primary microglia
Primary microglia were prepared as described previously.Citation14 Briefly, minced cerebral cortices from newborn mice were treated with trypsin and DNaseI. Dissociated and filtered cells were suspended in Dulbecco's modified Eagle medium supplemented with 0.1% penicillin/streptomycin and 10% heat-inactivated fetal bovine serum and then seeded into poly-L-lysine-coated 75 cm2 cell culture flasks. The medium was changed appropriately. The floating microglia were collected by gently shaking the flask.
Measurement of extracellular ROS production by microglia, neutrophils and peritoneal macrophages
Extracellular ROS production by microglia and neutrophils was measured as described previously.Citation14 Cells were suspended in balanced salt solution containing (in mM) NaCl 150, KCl 5.0, CaCl2 1.8, MgCl2 1.2, HEPES 25, and D-glucose 10 (pH 7.4). Superoxide anion was monitored using a luminol-based assay, Diogenes (National Diagnostics, Atlanta, GA). The signal was detected as luminescence using a SH-9000Lab microplate reader (Corona Electric, Ibaraki, Japan). For microglia, data were normalized to the number of microglial cells; for neutrophils, all experiments were performed with 1000 cells. For measurement of extracellular ROS production by macrophages, peritoneal macrophages were harvested after injecting ice-cold phosphate buffered saline into the peritoneum and then collecting it.Citation38 We calculated the superoxide anion production by subtracting the data obtained after treatment with 100 U/mL superoxide dismutase from the original data.
Real-time quantitative reverse transcription PCR with cultured microglia
After total RNA was prepared from cultured microglia using TRIzol (Invitrogen Carlsbad, CA) according to the manufacturer's protocol, cDNA was synthesized using a SuperScript III First-Strand Synthesis System (Invitrogen Carlsbad, CA). Gene expression levels were analyzed using the following gene-specific primers: for gp91, 5′-CCAACTGGGATAACGAGTTCA-3′ (SE) and 5′-GAGAGTTTCAGCCAAGGCTTC-3′ (AS); for Tnfa, 5′-CCACCACGCTCTTCTGTCTAC-3′ (SE) and 5′- GGCTACAGGCTTGTCACTCG-3′ (AS); for Gapdh, 5′-TCCTACCCCCAATGTGTCC-3′ (SE) and 5′-ACCTGGTCCTCAGTGTAGCC-3′ (AS). Real-time quantitative reverse transcription PCR was performed using KOD SYBR qPCR Mix (TOYOBO, Tokyo, Japan) and ABI PRISM 7900HT (Applied Biosystems, Foster City, CA). The gene expression level of interest was normalized to that of Gapdh.
Statistical analyses
Statistical analyses were performed using Prism 6 (GraphPad Software, San Diego, CA). All the data are represented as means ± SEM.
Acknowledgments and conflict of interest disclosure
We thank Dr. Yoshifumi Okochi, Ms. Yuko Furukawa and Ms. Yuka Miyoshi (Osaka University) for their advice, animal care and technical support. This work was supported by Grants-in-Aids from JSPS (12J01957, 15K18575) (to T.K.), Grants-in-Aids from Ministry of Education, Culture, Sports, Science, and Technology (MEXT) and JSPS (15H05901, 24111529, 26111712, 21229003, 25253016, 16H02617 to Y.O.) and Core Research for Evolutional Science and Technology, Japan Science and Technology Agency (CREST, JST) (JPMJCR14M3 to Y.O.). The authors declare no competing financial interests.
Related Research Data
References
- Sasaki M, Takagi M, Okamura Y. A voltage sensor-domain protein is a voltage-gated proton channel. Science. 2006;312:589-92. doi:10.1126/science.1122352. PMID:16556803.
- Ramsey IS, Moran MM, Chong JA, Clapham DE. A voltage-gated proton-selective channel lacking the pore domain. Nature. 2006;440:1213-16. doi:10.1038/nature04700. PMID:16554753.
- DeCoursey TE. Voltage-gated proton channels: molecular biology, physiology, and pathophysiology of the H(V) family. Physiol Rev. 2013;93:599-652. doi:10.1152/physrev.00011.2012. PMID:23589829.
- Ramsey IS, Ruchti E, Kaczmarek JS, Clapham DE. Hv1 proton channels are required for high-level NADPH oxidase-dependent superoxide production during the phagocyte respiratory burst. Proc Natl Acad Sci U S A. 2009;106:7642-7. doi:10.1073/pnas.0902761106. PMID:19372380.
- Okochi Y, Sasaki M, Iwasaki H, Okamura Y. Voltage-gated proton channel is expressed on phagosomes. Biochem Biophys Res Commun. 2009;382:274-9. doi:10.1016/j.bbrc.2009.03.036. PMID:19285483.
- El Chemaly A, Okochi Y, Sasaki M, Arnaudeau S, Okamura Y, Demaurex N. VSOP/Hv1 proton channels sustain calcium entry, neutrophil migration, and superoxide production by limiting cell depolarization and acidification. J Exp Med. 2010;207:129-39. doi:10.1084/jem.20091837. PMID:20026664.
- Capasso M, Bhamrah MK, Henley T, Boyd RS, Langlais C, Cain K, Dinsdale D, Pulford K, Khan M, Musset B, et al. HVCN1 modulates BCR signal strength via regulation of BCR-dependent generation of reactive oxygen species. Nat Immunol. 2010;11:265-72. doi:10.1038/ni.1843. PMID:20139987.
- Sasaki M, Tojo A, Okochi Y, Miyawaki N, Kamimura D, Yamaguchi A, Murakami M, Okamura Y. Autoimmune disorder phenotypes in Hvcn1-deficient mice. Biochem J. 2013;450:295-301. doi:10.1042/BJ20121188. PMID:23231444.
- Zhu X, Mose E, Zimmermann N. Proton channel HVCN1 is required for effector functions of mouse eosinophils. BMC Immunol. 2013;14:24. doi:10.1186/1471-2172-14-24. PMID:23705768.
- Petheo GL, Orient A, Barath M, Kovacs I, Rethi B, Lanyi A, Rajki A, Rajnavölgyi E, Geiszt M. Molecular and functional characterization of Hv1 proton channel in human granulocytes. PloS One. 2010;5:e14081. doi:10.1371/journal.pone.0014081. PMID:21124855.
- El Chemaly A, Nunes P, Jimaja W, Castelbou C, Demaurex N. Hv1 proton channels differentially regulate the pH of neutrophil and macrophage phagosomes by sustaining the production of phagosomal ROS that inhibit the delivery of vacuolar ATPases. J Leukoc Biol. 2014;95:827-39. doi:10.1189/jlb.0513251. PMID:24415791.
- Wu LJ, Wu G, Akhavan Sharif MR, Baker A, Jia Y, Fahey FH, Luo HR, Feener EP, Clapham DE. The voltage-gated proton channel Hv1 enhances brain damage from ischemic stroke. Nat Neurosci. 2012;15:565-73. doi:10.1038/nn.3059. PMID:22388960.
- DeCoursey TE, Morgan D, Cherny VV. The voltage dependence of NADPH oxidase reveals why phagocytes need proton channels. Nature. 2003;422:531-4. doi:10.1038/nature01523. PMID:12673252.
- Kawai T, Okochi Y, Ozaki T, Imura Y, Koizumi S, Yamazaki M, Abe M, Sakimura K, Yamashita T, Okamura Y. Unconventional role of voltage-gated proton channels (VSOP/Hv1) in regulation of microglial ROS production. J Neurochem. 2017;142:686-99. doi:10.1111/jnc.14106. PMID:28628214.
- Liu J, Tian D, Murugan M, Eyo UB, Dreyfus CF, Wang W, Wu LJ. Microglial Hv1 proton channel promotes cuprizone-induced demyelination through oxidative damage. J Neurochem. 2015;135:347-56. doi:10.1111/jnc.13242. PMID:26173779.
- Wilkinson BL, Landreth GE. The microglial NADPH oxidase complex as a source of oxidative stress in Alzheimer's disease. J Neuroinflammation. 2006;3:30. doi:10.1186/1742-2094-3-30. PMID:17094809.
- Chanock SJ, el Benna J, Smith RM, Babior BM. The respiratory burst oxidase. J Biol Chem. 1994;269:24519-22. PMID:7929117.
- Dinauer MC. The respiratory burst oxidase and the molecular genetics of chronic granulomatous disease. Crit Rev Clin Lab Sci. 1993;30:329-69. doi:10.3109/10408369309082591. PMID:8110374.
- Segal AW. How neutrophils kill microbes. Annu Rev Immunol. 2005;23:197-223. doi:10.1146/annurev.immunol.23.021704.115653. PMID:15771570.
- Chen J, He R, Minshall RD, Dinauer MC, Ye RD. Characterization of a mutation in the Phox homology domain of the NADPH oxidase component p40phox identifies a mechanism for negative regulation of superoxide production. J Biol Chem. 2007;282:30273-84. doi:10.1074/jbc.M704416200. PMID:17698849.
- Rasmussen I, Pedersen LH, Byg L, Suzuki K, Sumimoto H, Vilhardt F. Effects of F/G-actin ratio and actin turn-over rate on NADPH oxidase activity in microglia. BMC Immunol. 2010;11:44. doi:10.1186/1471-2172-11-44. PMID:20825680.
- Tamura M, Kai T, Tsunawaki S, Lambeth JD, Kameda K. Direct interaction of actin with p47(phox) of neutrophil NADPH oxidase. Biochem Biophys Res Commun. 2000;276:1186-90. doi:10.1006/bbrc.2000.3598. PMID:11027608.
- Zhan Y, He D, Newburger PE, Zhou GW. p47(phox) PX domain of NADPH oxidase targets cell membrane via moesin-mediated association with the actin cytoskeleton. J Cell Biochem. 2004;92:795-809. doi:10.1002/jcb.20084. PMID:15211576.
- Qin L, Crews FT. NADPH oxidase and reactive oxygen species contribute to alcohol-induced microglial activation and neurodegeneration. J Neuroinflammation. 2012;9:5. doi:10.1186/1742-2094-9-5. PMID:22240163.
- Dohi K, Ohtaki H, Nakamachi T, Yofu S, Satoh K, Miyamoto K, Song D, Tsunawaki S, Shioda S, Aruga T. Gp91phox (NOX2) in classically activated microglia exacerbates traumatic brain injury. J Neuroinflammation. 2010;7:41. doi:10.1186/1742-2094-7-41. PMID:20659322.
- Nakamura Y, Si QS, Kataoka K. Lipopolysaccharide-induced microglial activation in culture: temporal profiles of morphological change and release of cytokines and nitric oxide. Neurosci Res. 1999;35:95-100. doi:10.1016/S0168-0102(99)00071-1. PMID:10616913.
- Nathan CF. Neutrophil activation on biological surfaces. Massive secretion of hydrogen peroxide in response to products of macrophages and lymphocytes. J Clin Invest. 1987;80:1550-60. doi:10.1172/JCI113241. PMID:2445780.
- Berton G, Laudanna C, Sorio C, Rossi F. Generation of signals activating neutrophil functions by leukocyte integrins: LFA-1 and gp150/95, but not CR3, are able to stimulate the respiratory burst of human neutrophils. J Cell Biol 1992;116:1007-17. doi:10.1083/jcb.116.4.1007. PMID:1346398.
- Berton G, Lowell CA. Integrin signalling in neutrophils and macrophages. Cell Signal. 1999;11:621-35. doi:10.1016/S0898-6568(99)00003-0. PMID:10530871.
- Fumagalli L, Campa CC, Germena G, Lowell CA, Hirsch E, Berton G. Class I phosphoinositide-3-kinases and SRC kinases play a nonredundant role in regulation of adhesion-independent and -dependent neutrophil reactive oxygen species generation. J Immunol. 2013;190:3648-60. doi:10.4049/jimmunol.1201951. PMID:23447687.
- Nathan C, Shiloh MU. Reactive oxygen and nitrogen intermediates in the relationship between mammalian hosts and microbial pathogens. Proc Natl Acad Sci U S A. 2000;97:8841-48. doi:10.1073/pnas.97.16.8841. PMID:10922044.
- Fordyce CB, Jagasia R, Zhu X, Schlichter LC. Microglia Kv1.3 channels contribute to their ability to kill neurons. The Journal of neuroscience: the official journal of the Society for Neuroscience. 2005;25:7139-49. doi:10.1523/JNEUROSCI.1251-05.2005. PMID:16079396.
- De Simoni A, Allen NJ, Attwell D. Charge compensation for NADPH oxidase activity in microglia in rat brain slices does not involve a proton current. Eur J Neurosci. 2008;28:1146-56. doi:10.1111/j.1460-9568.2008.06417.x. PMID:18783372.
- Thomas MP, Chartrand K, Reynolds A, Vitvitsky V, Banerjee R, Gendelman HE. Ion channel blockade attenuates aggregated alpha synuclein induction of microglial reactive oxygen species: relevance for the pathogenesis of Parkinson's disease. J Neurochem. 2007;100:503-19. doi:10.1111/j.1471-4159.2006.04315.x. PMID:17241161.
- Khanna R, Roy L, Zhu X, Schlichter LC. K+ channels and the microglial respiratory burst. Am J Physiol Cell Physiol. 2001;280:C796−806. PMID:11245596.
- Nguyen HM, Blomster LV, Christophersen P, Wulff H. Potassium channel expression and function in microglia: Plasticity and possible species variations. Channels (Austin). 2017;11:305-15. doi:10.1080/19336950.2017.1300738. PMID:28277939.
- Sakai K, Miyazaki J. A transgenic mouse line that retains Cre recombinase activity in mature oocytes irrespective of the cre transgene transmission. Biochem Biophys Res Commun. 1997;237:318-24. doi:10.1006/bbrc.1997.7111. PMID:9268708.
- Zhang X, Goncalves R, Mosser DM. The isolation and characterization of murine macrophages. Current protocols in immunology. 2008; 83:14.1.1-14.1.14. doi:10.1002/0471142735.im1401s83. PMID:19016445.