
ABSTRACT
Recently, we and others identified somatic and germline de novo gain-of-function mutations in CACNA1D, the gene encoding the α1-subunit of voltage-gated Cav1.3 Ca2+-channels. While somatic mutations identified in aldosterone producing adenomas (APAs) underlie treatment-resistant hypertension, germline CACNA1D mutations are associated with a neurodevelopmental disorder characterized by a wide symptomatic spectrum, including autism spectrum disorder. The number of newly identified CACNA1D missense mutations is constantly growing, but their pathogenic potential is difficult to predict in silico, making functional studies indispensable to assess their contribution to disease risk.
Here we report the functional characterization of previously identified CACNA1D APA mutations F747L and M1354I using whole-cell patch-clamp electrophysiology upon recombinant expression in tsA-201 cells. We also investigated if alternative splicing of Cav1.3 affects the aberrant gating of the previously characterized APA mutation R990H and two mutations associated with autism spectrum disorder (A479G and G407R). Splice-variant dependent gating changes are of particular interest for germline mutations, since the relative expression of Cav1.3 splice variants differs across different tissues and within brain regions and might therefore result in tissue-specific phenotypes. Our data revealed a complex gain-of-function phenotype for APA mutation F747L confirming its pathogenic role. Furthermore, we found splice-variant dependent gating changes in R990H, A749G and G407R. M1354I did not change channel function of Cav1.3 splice variants and should therefore be considered a rare non-pathogenic variant until further proof for its pathogenicity is obtained. Our new findings together with previously published data allow classification of pathogenic CACNA1D mutations into four categories based on prototypical functional changes.
Introduction
Different classes of voltage-gated Ca2+ channels serve a central role for key physiological processes by generating inward Ca2+ currents in response to changes in membrane potentials in electrically excitable cells [Citation1–Citation3]. Ca2+ influx through these channels drives not only membrane depolarization but, through Ca2+ ions as universal second messenger, also regulates a large variety of intracellular Ca2+ dependent processes. These include muscle contraction, gene transcription, hormone secretion, neurotransmitter release, synaptic excitability and plasticity [Citation1–Citation3]. Their subcellular targeting as well as the dynamics of Ca2+ entry need to be tightly controlled by accessory subunits, post-translational modification, lipid- and protein interactions, as well as alternative splicing [Citation1,Citation2]. The occurrence of human channelopathies resulting from even minor changes in Ca2+ channel activity [Citation4–Citation8] further emphasizes the importance of strictly regulated channel gating and targeting for normal physiological function.
We [Citation9–Citation12] and others [Citation13–Citation16] have recently described de novo missense mutations in CACNA1D encoding the pore-forming α1-subunit of Cav1.3 L-type channels. These included somatic mutations identified in aldosterone-producing adenomas [APAs, 11,12,15], as well as germline mutations from patients with neurodevelopmental disorders characterized by autism spectrum disorder (ASD) and/or intellectual disability with or without seizures [Citation9,Citation10,Citation13–Citation15]. Three of these patients further displayed primary aldosteronism or hyperinsulinism [Citation13,Citation15]. All so far functionally characterized mutations – both from germline and somatic mutations – induced pronounced gating changes, evident either as robust shifts in activation and inactivation voltage to more negative potentials and/or strong reductions of ICa inactivation, thus permitting enhanced Ca2+ entry through the channel. This suggests that Cav1.3 gain-of-function cannot only drive excessive aldosterone production in APAs [Ca2+ is the critical steroidogenic second messenger in zona glomerulosa cells, 17] but might also confer high risk for neuropsychiatric and neurological disorders [Citation18].
Due to the known physiological role of Cav1.3 for brain development and function [Citation2,Citation18] and the recent findings of recurrent de novo germline CACNA1D mutations in patients with neuropsychiatric and neurological symptoms this gene has been incorporated in custom genetic panels for clinical diagnosis, including autism/intellectual disability (Autism/ID Xpanded Panel).
Based on findings in Cav1.3-deficient mice [Citation19] and humans [Citation20] heterozygous de novo loss-of-function mutations are expected to be clinically silent and only missense mutations with gating changes permitting enhanced Ca2+ signaling are likely to be disease relevant. However, the functional consequences of such mutations are difficult to predict in silico. Therefore, newly identified rare missense variants have to be functionally characterized in heterologous expression systems to confirm their disease causing potential. So far this has been accomplished for seven patients with germline CACNA1D mutations [six different mutations, 9,10,13–15] and six somatic mutations occurring in APAs [Citation11,Citation12,Citation15,Citation21]. Interestingly, several of the functionally verified germline mutations causing a neurodevelopmental disorder are also found in APAs [I750M, G403D, V401L, 18]. Therefore, if a germline mutation in patients with a neurodevelopmental syndrome is also reported in APAs this would be strong support for its pathogenic role and guide genetic and clinical diagnosis. The number of CACNA1D mutations in APAs in precursor lesions (aldosterone producing cell clusters, APCCs,) is constantly growing [>40, 18,22,23]. All these mutations are highly likely to allow enhanced Ca2+ signaling though Cav1.3 channels because they are selected by their ability to drive Ca2+ -dependent aldosterone production. However, despite this selection pressure not all predicted high confidence CACNA1D APA and APCC mutations may strongly contribute to disease risk because other, yet unknown mechanisms could be responsible. Notably, a substantial fraction of excessive aldosterone production in APAs is due to mechanisms not explained by somatic variants in known genes [Citation24]. This emphasizes the need for further functional characterization of CACNA1D APA mutations to verify their causative roles.
Here we report the analysis of three APA mutations (F747L, R990H, M1354I) which we have previously reported together with other CACNA1D mutations in a cohort of 152 subjects [Citation11]. We also investigated if alternative splicing of Cav1.3 α1 can affect mutational effects on channel function in R990H, M1354I and in two previously reported ASD mutations A749G and G407R. Indeed, we found splice-variant dependent gating changes in R990H, A749G and G407R. Our data confirm a gain-of function phenotype also for F747L but not for M1354I. Finally, our experiments support our previous hypothesis that an ω-current through mutant R990H rather than altered gating explains its pathogenic potential.
Experimental procedures
Complementary DNA constructs
Human wild-type Cav1.3α1-subunits (reference sequence EU363339) comprising alternative exons 8a and 42 (long C-terminal splice variant) or 43s [short C-terminal splice variant, 25] were previously cloned into the pGFPminus vector (no GFP tag, CMV promoter) [Citation25]. Mutations were introduced into Cav1.3 splice variants using standard polymerase chain reaction approaches and verified by Sanger sequencing (Eurofins Genomics, Ebersberg, Germany). When co-expressed with auxiliary β3 and α2δ-1 subunits in tsA-201 cells, all mutant α1-subunits were detected with the expected molecular mass in Western blots and at densities comparable to wild-type (n ≥ 3 transfections for each mutant).
Cell culture and transfection
tsA-201 cells were maintained in culture and transiently transfected with wild-type (WT) or mutant Cav1.3 α1- and auxiliary β3- (NM_012828) and α2δ-1- (NM_001082276) subunits as previously described [Citation9,Citation26]. GFP was co-transfected to visualize transfected cells.
Electrophysiological recordings in tsA-201 cells
For whole-cell patch-clamp recordings borosilicate glass electrodes (203-776-0664 Warner Instruments and 64-0792, Harvard Apparatus, USA) with a final resistance of 1.5–3.0 MΩ were pulled using a micropipette puller (Sutter instruments, P-97) and fire polished afterwards (Microforge, Narishinge MF-830). All recordings were performed at room temperature (21–23 °C) in whole-cell configuration using the Axopatch 200B amplifier (Axon instruments), digitized at 50 kHz (Digitizer 1322A, Axon instruments), low-pass filtered at 5 kHz and compensated for 60–90 % of the series resistance. The recording solutions contained in mM: bath: 15 CaCl2, 10 HEPES, 150 choline-Cl and 1 MgCl2, adjusted to pH 7.4 with CsOH; intracellular: 135 CsCl, 10 HEPES, 10 Cs-EGTA, 1 MgCl2, 4 Na2ATP adjusted to pH 7.4 with CsOH. The holding potential (HP) was set to −80 mV. To determine the current-voltage (I-V) relationship, a 30 ms (short splice variants) or 50 ms (long splice variants) square pulse protocol to different voltages was applied. Resulting I-V curves were fitted from −80 mV to + 40 mV to the following equation:
where Vrev is the extrapolated reversal potential, V the test potential, I the peak current, Gmax the maximum conductance, V0.5 the half maximal activation voltage and k the slope factor. The voltage-dependence of Ca2+ conductance was fitted according to a Boltzman distribution:
Estimates for changes in channel open probability and/or single channel conductance were obtained as described [Citation25] by normalizing the ionic tail current to the amplitude of the integrated ON-gating current (QON) of the same pulse at the Vrev. The QON at the Vrev was also used to determine the surface expression of the channel complexes.
For analysis of current densities, surface expression and estimation of the open probability only recordings from the same transfections were compared.
Steady-state inactivation was measured by applying a control test pulse (20 ms to the voltage of maximal inward current, Vmax) followed by 5-s conditioning steps to various potentials and a subsequent 20-ms test pulse to Vmax (30-s recovery between protocols). Inactivation was calculated as the ratio between the current amplitudes of the test versus control pulse. Steady-state inactivation parameters were obtained by fitting the data to a modified Boltzmann equation:
To investigate inactivation kinetics, cells were depolarized for 5 s to the Vmax, normalized (I/Imax) and the remaining current (R) at different time points was determined. Recovery from inactivation was determined by a 10 ms test pulses to Vmax at the indicated time after a 1-s conditioning pulse to Vmax. Differences in the inactivation after repeated stimuli were determined after applying 100-ms square pulses to Vmax at a frequency of 3 Hz. Holding potential between the steps was −60 mV.
Leak subtraction was performed either offline (steady-state inactivation, 5-s inactivation, recovery from inactivation and pharmacological experiments) or online using P/4 protocol. Recordings were junction potential corrected by −9.3 mV for Ca2+ and by −8.6 for Ba2+ as charge carrier, as previously described [Citation27].
Statistics
Data were analyzed using Clampfit 10.2 (Axon Instruments), Microsoft Excel, SigmaPlot 8 (Systat Software, Inc) and GraphPad Prism 5 software (GraphPad software, Inc). All values are presented as mean ± S.E.M. for the indicated number of experiments (n) unless stated otherwise. Data were analyzed by unpaired Student’s t-test, Mann-Whitney test, and one-way ANOVA followed by Bonferroni post-hoc test. Statistical significance was set at p < 0.05.
Results
Splice-variant dependent effects of ASD mutations G407R and A749G
We have recently shown that two de novo missense mutations, G407R and A749G (), found in two patients with ASD cause severe gating changes that are expected to result in aberrant Cav1.3-mediated Ca2+ signaling in the brain. Together with three other mutations (V401L, G407D, I750M) that cause an even more severe neurodevelopmental syndrome [Citation9,Citation15], this strongly suggests that these mutations confer a high risk for these diseases [Citation18]. Cav1.3 also undergoes extensive alternative splicing, giving rise to a major C-terminal long splice variant (Cav1.3L) and a number of C-terminal short splice variants, with Cav1.343s (Cav1.3S) being the most abundant one in the brain [Citation25,Citation28–Citation30]. C-terminal splicing removes a modulatory domain allowing channels to undergo major changes in voltage-and Ca2+-dependent gating resulting in activation at lower voltages, enhanced Ca2+-dependent inactivation and increased channel open probability [Citation25,Citation27,Citation28,Citation31]. We have previously reported gating effects of the germline mutations A749G and G407R (situated at the intracellular end of IS6 and IIS6, respectively) only in the human C-terminally long (Cav1.3L) isoform [Citation10]. To test for potential splice-variant dependent effects we now introduced both mutations into human Cav1.3S to compare their functional consequences with those in Cav1.3L under identical experimental conditions.
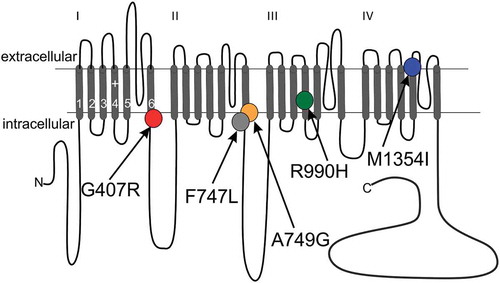
Figure 1. Transmembrane topology of the Cav1.3 α1-subunit. The pore-forming subunit of voltage gated Ca2+ channels consist of four transmembrane repeats each comprising six membrane spanning helices connected by intra- and extracellular linkers. Segments (S) 1–4 of each repeat comprise the voltage- sensing domain, whereas segments 5–6 line the pore. The positions of missense mutations identified in ASD (G407R, A749G) and APAs (F747L, R990H, M1354I) are indicated. Mutations G407R (IS6), F747L (IIS6) and A749G (IIS6) reside within the so-called activation gate at the distal part of the S6 segment. Mutation R990H affects the third of the five gating charges within the IIIS4 helix of the voltage sensing domain and M1354I is localized at the distal part of segment IVS5 facing the extracellular side. For references see text.
Mutation A749GS resulted in a similarly strong negative shift of the voltage dependence of activation and steady-state inactivation as the long splice variant (, ; historical data for long splice variants measured under identical conditions are given for comparison). Since wild-type Cav1.3S activates and inactivates at more negative voltages than Cav1.3L [, , 26], a substantial fraction of A749GS inactivated already at negative voltages unable to activate channels (closed-state inactivation), as evident from the steady-state activation and inactivation curves (). At −50 mV, where channels were not activated, only 1.13 ± 0.01 % and 2.51 ± 0.01 % of WTL and WTS channels are inactivated, whereas for A749GL 19.2 ± 0.03 % and for A749GS even 41.8 ± 0.07 % were already unavailable (p < 0.0001 for A749GL vs. WTL, A749GS vs. WTS and A749GL vs. A749GS, one-way ANOVA followed by Bonferroni post hoc test). Since our measurements require recordings with 15 mM Ca2+ as a charge carrier, voltage-dependent activation and inactivation curves would be shifted by about −18 mV at physiological Ca2+ concentrations [2 mM Ca2+; 25]. Therefore, about half of the A749GS channels are predicted to be already inactivated at membrane potentials close to resting potentials. In the heterozygous individuals this would decrease the availability of A749Gs in comparison to wild-type channels in neurons with more positive membrane potentials, such as for example substantia nigra and ventral tegmental area dopamine neurons. This reveals both, gain- and loss of function properties of these mutations depending not only on the activity patterns of different neurons but also strongly affected by the relative abundance of long and short splice variants.
Table 1. Activation and inactivation parameters for ASD mutations A749G and G407R.
Table 2. Remaining current upon 5-s depolarization for ASD mutations A749G and G407R.
Table 3. Activation and inactivation parameters for APA mutations F747L and M1354I.
Table 4. Remaining current upon 5-s depolarization for APA mutations F747L and M1354I.
Table 5. Activation and inactivation parameters for APA mutation R990H.
Figure 2. Biophysical properties of Cav1.3 mutant A749GS. (a) Current-voltage relationships (ICa, mean ± S.E.M.; 50-ms depolarizations to indicated voltages) of WTS and A749GS. Only WT data recorded in parallel on the same days (> 3- different transfections) were included. Inset (upper): Box plots of WTS and A749GS peak current densities. In contrast to the long splice variant, no significant difference was observed in the current amplitudes (median, 5/95 percentile, [pA/pF]): WTS: −8.74 (−22.4/-5.54) n = 10; A749GS: −6.18 (−26.4/-4.94), n = 12; p = 0.339, Mann Whitney test). Inset (lower): Representative ICa traces from WTS and A749GS during depolarizations to Vmax. (b) Steady-state activation (circles, solid lines) and inactivation (squares, dashed lines) of WTS (black symbols) and A749GS (orange symbols). For statistics and n-numbers see . Lines without symbols represent the corresponding voltage-dependence of activation and inactivation for full length WTL and A749GL recorded under identical conditions (taken from reference Citation10). (c) Inactivation time course of WTS (n = 35) and A749GS (n = 9) during depolarization to Vmax for 5 s. Normalized traces are shown as mean ± S.E.M. Inactivation was best described by a bi-exponential decay. The faster inactivation of the mutant resulted from a slightly larger contribution of the fast inactivating component (WTS: 79.1 ± 1.11 %, n = 26, A749GS: 84.3 ± 2.21 %, p = 0.036, n = 8) and faster inactivation of the slow component (WTS: τslow = 602 ± 21.8 ms, A749GS: 420 ± 59.6 ms, p = 0.0012), despite a moderately slower fast inactivation (WTS: τfast = 36.5 ± 1.8 ms, A749GS: 57.9 ± 7.99 ms, p = 0.0004). Additionally, inactivation was more complete in the mutant (remaining current: WTS: 14.6 ± 2.5 %, A749GS: 5.65 ± 1.19 %, p = 0.061, for statistics see ). Statistical significance has been determined by unpaired Student’s t-test.
![Figure 2. Biophysical properties of Cav1.3 mutant A749GS. (a) Current-voltage relationships (ICa, mean ± S.E.M.; 50-ms depolarizations to indicated voltages) of WTS and A749GS. Only WT data recorded in parallel on the same days (> 3- different transfections) were included. Inset (upper): Box plots of WTS and A749GS peak current densities. In contrast to the long splice variant, no significant difference was observed in the current amplitudes (median, 5/95 percentile, [pA/pF]): WTS: −8.74 (−22.4/-5.54) n = 10; A749GS: −6.18 (−26.4/-4.94), n = 12; p = 0.339, Mann Whitney test). Inset (lower): Representative ICa traces from WTS and A749GS during depolarizations to Vmax. (b) Steady-state activation (circles, solid lines) and inactivation (squares, dashed lines) of WTS (black symbols) and A749GS (orange symbols). For statistics and n-numbers see Table 1. Lines without symbols represent the corresponding voltage-dependence of activation and inactivation for full length WTL and A749GL recorded under identical conditions (taken from reference Citation10). (c) Inactivation time course of WTS (n = 35) and A749GS (n = 9) during depolarization to Vmax for 5 s. Normalized traces are shown as mean ± S.E.M. Inactivation was best described by a bi-exponential decay. The faster inactivation of the mutant resulted from a slightly larger contribution of the fast inactivating component (WTS: 79.1 ± 1.11 %, n = 26, A749GS: 84.3 ± 2.21 %, p = 0.036, n = 8) and faster inactivation of the slow component (WTS: τslow = 602 ± 21.8 ms, A749GS: 420 ± 59.6 ms, p = 0.0012), despite a moderately slower fast inactivation (WTS: τfast = 36.5 ± 1.8 ms, A749GS: 57.9 ± 7.99 ms, p = 0.0004). Additionally, inactivation was more complete in the mutant (remaining current: WTS: 14.6 ± 2.5 %, A749GS: 5.65 ± 1.19 %, p = 0.061, for statistics see Table 2). Statistical significance has been determined by unpaired Student’s t-test.](/cms/asset/69d567c2-4165-4698-8cff-48874e201a6e/kchl_a_1546518_f0002_oc.jpg)
Mutation A749G slightly accelerated inactivation kinetics of both splice variants (). Bi-exponential inactivation over a 5-s time course of A749GS was faster (), due to a significant decrease of τslow and an increase of the contribution of the fast inactivating component (), see legend for statistics). τfast was slightly prolonged, which was also evident from a trend to more remaining current after 50 ms (). Although we made no attempts to separate the contribution of CDI and VDI for inactivation, the decrease of τslow must reflect a slowing of VDI by the mutation, whereas the increase in τfast suggests a slowing of CDI. This agrees with the observation of reduced CDI and enhanced VDI of this mutation in a rat Cav1.3 splice variant [Citation16]. The authors predicted that the increase in VDI by the mutation may act in opposition to the reduced of CDI. Our data provide direct experimental support for their prediction.
As described previously [Citation12,Citation25] ON-gating currents (QON) were very small or absent for WTS preventing measurements of the ratio of maximal tail current amplitude vs. integrated ON-gating current as an estimate for changes in open probability. Whereas A749GL significantly enhanced peak current amplitudes [Citation10] this was not observed for A749GS. Instead, depolarization to voltages causing maximal activation (Vmax) of WT channels resulted in smaller current amplitudes in the mutant ()). This indicated reduced A749GS current compared to WT, which was compensated by a higher driving force at peak current amplitudes due to its more negative activation voltage range. Since analysis of the QON in the long splice variants revealed reduced surface expression of A749GL [Citation10], this suggests that the smaller current at WT Vmax observed with A749GS might also be due to a reduction in channel numbers at the cell surface.
Splicing-dependent differences were also found for ASD mutation G407R. G407R reduced maximal current amplitudes in both C-terminally long [, 10] and short Cav1.3 splice variants (, ). However, in contrast to G407RL, the voltage dependence of activation was significantly shifted in G407RS to more negative voltages (). Like for G407RL the inactivation time course during 5-s depolarizations was also dramatically slowed for G407RS (, ). G407RS, in contrast to G407RL [Citation10] retained an initial fast inactivating component, most likely representing residual CDI (), which is more pronounced in short Cav1.3 splice variants [Citation25,Citation31,Citation32]. Despite reduced maximal current amplitudes, the slow inactivation resulted in larger absolute current amplitudes during prolonged depolarization than in WTS channels (). The fraction of ICa became larger after about 200 ms and was remarkably enhanced at the end of a 5-s pulse to Vmax for G407RS (59.9 ± 5.62 %, n = 8), compared to WTS (13.5 ± 2.09 %, n = 35) (, ). The failure of G407R currents to inactivate prevented the measurement of steady-state inactivation parameters. Together with the more negative activation voltage range of G407RS, this predicts persistent inward current at even more negative (subthreshold) potentials than for G407RL ().
Figure 3. Biophysical properties of Cav1.3 mutant G407RS. (a) Current-voltage relationships (ICa, mean ± S.E.M.) from WTS and G407RS recorded in parallel on the same days (>3-different transfections). Inset (upper): Box plots showing significantly reduced peak current densities for G407RS (median (5/95 percentile) [pA/pF]: WTS: −6.68 (−17.1/-3.09), n = 17; G407RS: −2.82 (−4.36/-1.46), n = 13; *** p < 0.0001, Mann Whitney test). Inset (lower): Representative ICa traces of WTS and G407RS upon depolarization to Vmax. (b) Voltage dependence of WT (black circles) and G407RS (red circles) activation. Lines without symbols depict the corresponding voltage-dependence of activation for full length WTL (black) and G407RL (red) recorded under identical conditions (taken from reference Citation10). Statistics for gating parameters are given in . (c) Normalized inactivation time course of ICa after 5-s depolarization to Vmax (mean ± S.E.M.). The fast inactivating component is reduced in G407RS (n = 8) as compared to WT (n = 35) leading to slower inactivation of the mutant (for statistics see ). (d) Although G407RS maximal current density is significantly smaller than WTS, absolute G407RS current is larger than WTS after about 200 ms.
![Figure 3. Biophysical properties of Cav1.3 mutant G407RS. (a) Current-voltage relationships (ICa, mean ± S.E.M.) from WTS and G407RS recorded in parallel on the same days (>3-different transfections). Inset (upper): Box plots showing significantly reduced peak current densities for G407RS (median (5/95 percentile) [pA/pF]: WTS: −6.68 (−17.1/-3.09), n = 17; G407RS: −2.82 (−4.36/-1.46), n = 13; *** p < 0.0001, Mann Whitney test). Inset (lower): Representative ICa traces of WTS and G407RS upon depolarization to Vmax. (b) Voltage dependence of WT (black circles) and G407RS (red circles) activation. Lines without symbols depict the corresponding voltage-dependence of activation for full length WTL (black) and G407RL (red) recorded under identical conditions (taken from reference Citation10). Statistics for gating parameters are given in Table 1. (c) Normalized inactivation time course of ICa after 5-s depolarization to Vmax (mean ± S.E.M.). The fast inactivating component is reduced in G407RS (n = 8) as compared to WT (n = 35) leading to slower inactivation of the mutant (for statistics see Table 2). (d) Although G407RS maximal current density is significantly smaller than WTS, absolute G407RS current is larger than WTS after about 200 ms.](/cms/asset/9d16fadd-aada-4211-8052-21cc72d5288e/kchl_a_1546518_f0003_oc.jpg)
APA mutations F747L and R990H – but not M1354I – alter channel gating
We next determined if APA mutations F747L, R990H and M1354I () also interfere with proper channel function in a similar manner as described above. F747L resides at the intracellular end of IIS6 just 2 amino acids upstream of A749G. When introduced into the long splice variant F747LL also strongly shifted the voltage dependence of activation (about −17 mV) to more negative potentials, while the voltage dependence of inactivation remained unaltered (, ). This dramatically broadened the voltage range in which the channel is active and increases the window current. Moreover, F747LL currents inactivated more slowly and showed a significantly higher fraction of non-inactivating ICa even after prolonged depolarizations (; for statistics). F747LL also significantly slowed the time course of activation (time to peak at Vmax [ms]: WTL: 6.66 ± 0.44, n = 35; F747LL: 30.1 ± 1.76, n = 21, p < 0.0001, unpaired Student’s t-test; traces in , inset). Like for A749GS, current amplitudes were smaller at positive voltages suggesting overall reduced current through the mutated channel. Unfortunately, quantification of the surface expression of functional F747LL was not possible because the mutation eliminated measurable QON gating charge movement. As evident from the current traces in (inset, arrows), in 27 out of 30 recordings the QON voltage sensor movement, which is present in WTL in all cells, was not detectable. We have obtained a similar decrease in QON relative to ionic current previously for APA mutations I750M, V259D and P1336R [Citation11] and ASD mutation A749G [Citation10] when introduced into the long splice variant. Taken together, F747LL exhibits the typical gating changes observed for previously studied mutations clearly identifying this mutation as the cause for excess aldosterone production in APAs.
Figure 4. Biophysical properties of Cav1.3 mutant F747LL. (a) Current-voltage relationships (ICa, mean ± S.E.M.) of WTL and F747LL recorded in parallel on the same days (>3-different transfections). Inset (upper): Box plots of peak current densities (median, 5/95 percentile, [pA/pF]): WTL: −12.7 (−66.1/-5.96), n = 47; F747LL: −13.3 (−40.3/-3.97), n = 27). Black circles represent extreme values. Peak values were not statistically different (Mann Whitney test, p = 0.97). Inset (lower): Representative ICa traces of WTL and F747LL upon depolarization to Vmax. Note the slower activation time course and the absence of QON gating charge in F747LL (arrows). (b) Steady-state activation (circles, solid lines) and inactivation (squares, dashed lines) of WTL (black symbols) and F747LL (gray symbols). Gating parameters and statistics are given in . (c) Normalized inactivation time course of ICa after 5-s depolarization to Vmax (mean ± S.E.M.) illustrating pronounced slowing of inactivation by F747L.(n = 10) as compared to WTL (n = 28). For statistics, see .
![Figure 4. Biophysical properties of Cav1.3 mutant F747LL. (a) Current-voltage relationships (ICa, mean ± S.E.M.) of WTL and F747LL recorded in parallel on the same days (>3-different transfections). Inset (upper): Box plots of peak current densities (median, 5/95 percentile, [pA/pF]): WTL: −12.7 (−66.1/-5.96), n = 47; F747LL: −13.3 (−40.3/-3.97), n = 27). Black circles represent extreme values. Peak values were not statistically different (Mann Whitney test, p = 0.97). Inset (lower): Representative ICa traces of WTL and F747LL upon depolarization to Vmax. Note the slower activation time course and the absence of QON gating charge in F747LL (arrows). (b) Steady-state activation (circles, solid lines) and inactivation (squares, dashed lines) of WTL (black symbols) and F747LL (gray symbols). Gating parameters and statistics are given in Table 3. (c) Normalized inactivation time course of ICa after 5-s depolarization to Vmax (mean ± S.E.M.) illustrating pronounced slowing of inactivation by F747L.(n = 10) as compared to WTL (n = 28). For statistics, see Table 4.](/cms/asset/7e63e110-05ac-4407-aa59-d40cecbf25b9/kchl_a_1546518_f0004_b.gif)
Unlike previously described APA mutations, R990H and M1354I are not located within the activation gate or the S4-S5 linkers [Citation18,Citation21] and may therefore induce different functional changes.
R990H replaces the third (R3) of the five S4 positive charges of the domain III voltage sensing S4 helix [Citation21]. We have recently shown that, when introduced into the long splice variant, R990HL causes gating changes compatible with a loss-of-function phenotype: it tended to reduce inward current at all voltages, and slightly but significantly shifted activation (by about 3 mV) to more positive rather than negative voltages as in all other mutations studied so far (). For this mutation we have previously provided experimental and molecular modeling evidence for an ω-current through the voltage-sensor. This can be explained by a water wire formed in the voltage-sensor of the R990H mutation, which enables cationic leak current at hyperpolarized resting membrane potentials and therefore can indirectly trigger depolarization-induced Ca2+ entry in APAs [Citation21]. However, it is also possible that a gain-of-function phenotype is absent when introduced into the long but present in the short splice variant. We therefore tested this possibility by analyzing R990HS (). Like R990HL, R990HS shifted activation voltage to more positive voltages by about 4 mV (, ). However, when introduced into the short splice variant R990H also significantly shifted steady-state inactivation by about 6 mV to more negative voltages thus even reducing window current by decreasing channel availability at negative voltages. Current density () and the time course of inactivation () were not affected by the mutation in neither of the splice variants. In the absence of any other significant changes observed in R990HS these findings provide additional evidence for a loss-of-function phenotype of this mutation for Ca2+ entry through the canonical ion pore of both long and short variants of the channel. This further strengthens the view that the pathogenic gain-of-function phenotype results from its ω-current.
Table 6. Remaining current upon 5-s depolarization for APA mutation R990H.
Figure 5. Biophysical properties of Cav1.3 mutant R990HS. (a) Current-voltage relationships (ICa, mean ± S.E.M.) from WTS and R990HS recorded in parallel on the same days (>3-different transfections). Inset (upper): Box plots of peak current densities (median (5/95 percentile, [pA/pF]): WTS: −7.96 (−39.2/-3.03), n = 10; R990HS: −10.8 (−29.8/-4.65), n = 11; p = 0.549, Mann Whitney test). Inset (lower): Representative ICa traces of WTS and R990HS upon depolarization to Vmax. (b) Steady-state activation (circles, solid lines) and inactivation (squares, dashed lines) of WTS and R990HS. For statistics and n-numbers see . Lines without symbols depict the corresponding voltage-dependence of activation and inactivation for full length WTL and R990HL for comparison [Citation21] (c) Normalized inactivation time course of ICa after 5-s depolarization to Vmax (mean ± S.E.M.) for WTS (n = 35) and R990HS (n = 9). For statistics, see .
![Figure 5. Biophysical properties of Cav1.3 mutant R990HS. (a) Current-voltage relationships (ICa, mean ± S.E.M.) from WTS and R990HS recorded in parallel on the same days (>3-different transfections). Inset (upper): Box plots of peak current densities (median (5/95 percentile, [pA/pF]): WTS: −7.96 (−39.2/-3.03), n = 10; R990HS: −10.8 (−29.8/-4.65), n = 11; p = 0.549, Mann Whitney test). Inset (lower): Representative ICa traces of WTS and R990HS upon depolarization to Vmax. (b) Steady-state activation (circles, solid lines) and inactivation (squares, dashed lines) of WTS and R990HS. For statistics and n-numbers see Table 5. Lines without symbols depict the corresponding voltage-dependence of activation and inactivation for full length WTL and R990HL for comparison [Citation21] (c) Normalized inactivation time course of ICa after 5-s depolarization to Vmax (mean ± S.E.M.) for WTS (n = 35) and R990HS (n = 9). For statistics, see Table 6.](/cms/asset/94b11069-6097-48b2-85c6-f1cde3128f0d/kchl_a_1546518_f0005_oc.jpg)
Mutation M1354I is located in a highly conserved region at the extracellular end of segment IVS5 closely interacting with segment IIIS1 and the pore loop in domain IV [Citation33], interactions that may be involved in coupling the voltage sensing domain to the pore domain [Citation34]. However, in contrast to the other mutations, M1354I neither altered the voltage dependence of activation or inactivation (, ) nor the time course of inactivation during 5-s depolarizing pulses to Vmax (, ). In addition M1354IL did not change the Itail/QON ratio as an indirect measure of open probability ((Itail/QON [ms−1]: WTL: 15.8 ± 1.77, n = 16; M1354IL: 18.3 ± 1.70, n = 17, p = 0.3067, unpaired Student’s t-test). Current densities were reduced at all voltages in both long ()) and short Cav1.3 variants ()), which could be explained by less surface expression of the mutant as evident from a significantly lower QON as compared to WTL ((QON [pA*ms]: WTL: 144.7 ± 29.8, n = 16; M1354IL: 60.0 ± 7.38, n = 17, p = 0.008, unpaired student’s t-test).
Figure 6. Biophysical properties of Cav1.3 mutant M1354I. (a) Current-voltage relationships (ICa, mean ± S.E.M.) of WTL and M1354IL recorded in parallel on the same days (>3-different transfections). Inset (upper): Box plots of peak current densities (median, 5/95 percentile, [pA/pF]): WTL: −10.9 (−72.3/-5.86) n = 38; M1354IL: −8.33 (−25.3/-4.44), n = 40) were significantly smaller for the mutant (Mann Whitney test, p = 0.029). Inset (lower): Representative ICa traces of WTL and M1354IL upon depolarization to Vmax. (b) Current-voltage relationships (ICa, mean ± S.E.M.) of WTS and M1354IS recorded in parallel on the same days (>3-different transfections). Inset (upper): peak current densities (median, 5/95 percentile, [pA/pF]): WTS: −7.50 (−28.5/-3.63), n = 30; M1354IS: −5.89 (−12.6/-3.00), n = 19) were significantly smaller for the mutant (Mann Whitney test, p = 0.037). Inset (lower): Representative ICa traces of WTS and M1354IS upon depolarization to Vmax. (c) M1354I steady-state activation (circles, solid lines) and inactivation (squares, dashed lines) of WTL (filled black symbols), M1354IL (filled blue symbols), WTS (open black symbols), and M1354IS (open blue symbols). No significant changes were observed in mutant channels. Gating parameters and statistics are given in . (d) Recovery from ICa inactivation (mean ± S.E.M.) of WTL and M1345IL. First 300 ms are magnified in the inset. Curves were fitted using a mono-exponential function; there was no difference in the time constants (τ as mean ± S.E.M [ms]: WTL: 166.1 ± 20.6, n = 5; M1354IL: 154.5 ± 42.5, n = 5; unpaired Student’s t-test). E: Fraction of Imax remaining after repetitive depolarizations to Vmax at 3 Hz (mean ± S.E.M.) of WTL (n = 10) versus M1345IL (n = 5). (f) Normalized inactivation time course of ICa after 5-s depolarization to Vmax (mean ± S.E.M.) of WTL (n = 35) and M1354IS (n = 9). For statistics, see .
![Figure 6. Biophysical properties of Cav1.3 mutant M1354I. (a) Current-voltage relationships (ICa, mean ± S.E.M.) of WTL and M1354IL recorded in parallel on the same days (>3-different transfections). Inset (upper): Box plots of peak current densities (median, 5/95 percentile, [pA/pF]): WTL: −10.9 (−72.3/-5.86) n = 38; M1354IL: −8.33 (−25.3/-4.44), n = 40) were significantly smaller for the mutant (Mann Whitney test, p = 0.029). Inset (lower): Representative ICa traces of WTL and M1354IL upon depolarization to Vmax. (b) Current-voltage relationships (ICa, mean ± S.E.M.) of WTS and M1354IS recorded in parallel on the same days (>3-different transfections). Inset (upper): peak current densities (median, 5/95 percentile, [pA/pF]): WTS: −7.50 (−28.5/-3.63), n = 30; M1354IS: −5.89 (−12.6/-3.00), n = 19) were significantly smaller for the mutant (Mann Whitney test, p = 0.037). Inset (lower): Representative ICa traces of WTS and M1354IS upon depolarization to Vmax. (c) M1354I steady-state activation (circles, solid lines) and inactivation (squares, dashed lines) of WTL (filled black symbols), M1354IL (filled blue symbols), WTS (open black symbols), and M1354IS (open blue symbols). No significant changes were observed in mutant channels. Gating parameters and statistics are given in Table 3. (d) Recovery from ICa inactivation (mean ± S.E.M.) of WTL and M1345IL. First 300 ms are magnified in the inset. Curves were fitted using a mono-exponential function; there was no difference in the time constants (τ as mean ± S.E.M [ms]: WTL: 166.1 ± 20.6, n = 5; M1354IL: 154.5 ± 42.5, n = 5; unpaired Student’s t-test). E: Fraction of Imax remaining after repetitive depolarizations to Vmax at 3 Hz (mean ± S.E.M.) of WTL (n = 10) versus M1345IL (n = 5). (f) Normalized inactivation time course of ICa after 5-s depolarization to Vmax (mean ± S.E.M.) of WTL (n = 35) and M1354IS (n = 9). For statistics, see Table 4.](/cms/asset/2d8f9ead-aab0-4bca-b1ef-e92ea5cc1410/kchl_a_1546518_f0006_oc.jpg)
A more detailed characterization of its gating properties further revealed no changes in recovery from inactivation determined by 10-ms test pulses to Vmax at different time-points after a 5-s conditioning pulse to Vmax (). Accumulation of M1354IL in inactivated states induced by repetitive 3-Hz stimulation (30 100-ms steps to Vmax) did also not differ from WT ().
Taken together, our data clearly show that APA mutations F747L and R990H can lead to functional changes permitting enhanced voltage-dependent Ca2+ entry into APAs through different molecular mechanisms. They can therefore explain the excessive aldosterone production in these tumors. In contrast, a pathogenic role of mutation M1354I was not evident from our study.
Discussion
We and others, have previously discovered an important pathophysiological role of gating changes of de novo CACNA1D mutations, which are capable of enhancing Ca2+ influx through Cav1.3 channels. Such mutations occur as somatic mutations in APAs (resulting in treatment-resistant hypertension) and, if present germline, cause a neurodevelopmental disorder with a wide symptomatic spectrum. From a diagnostic point of view, it is important to distinguish pathogenic mutations causing the disease from other rare polymorphisms with low disease risk or no disease relevance at all.
Here we further expand our collection of functionally verified pathogenic mutations by demonstrating that APA mutation F747L exhibits very similar gating changes as previously observed for other mutations [9–12,15, ], all characterized by a strong negative shift of activation and inactivation voltage. This facilitates channel opening by weaker depolarizations from negative resting membrane potentials and enables window current at subthreshold voltages. Although the time course of ICa inactivation during long depolarizations is variable, several of the mutants (G403D, G403R, G407R) are characterized by a very strong loss of slow inactivation giving rise to a large fraction of non-inactivated current even after 5-s depolarizations to Vmax. Interestingly, in contrast to G403D and G403R [Citation15], G407R caused no negative shift in activation voltage when introduced into the C-terminally long Cav1.3 α1 splice variant [Citation10]. However, our present data show that such a negative shift (of about −6 mV) is observed when introduced into the short splice variant. Thus, more negative activation voltage range seems to be the common hallmark of the majority of pathogenic gating-modifying CACNA1D mutations analyzed so far.
Table 7. Classification of CACNA1D missense mutations by characteristic functional changes.
Splice-variant dependent gating changes are of particular interest for germline mutations, since the relative expression of Cav1.3 splice variants differs across different tissues and within brain regions and might therefore result in tissue-specific phenotypes. For example, a particularly high relative expression of short splice variants is observed in dopamine neurons in the Substantia nigra [Citation35]. Splice-variant dependent mutational effects have also been reported for other voltage-gated Ca2+ channels. A single missense mutation in exon 24 (III-IV cytoplasmic linker) in the α1-subunit of Cav3.2 T-type channels (CACNA1H), which confers part of the risk for epilepsy in GAERS rats, speeds recovery from inactivation and thereby increases Ca2+ currents during repetitive depolarizations [Citation36]. This phenotype was only observed in channels also containing a short exon 25. The inclusion of this exon slowed recovery from inactivation as compared to channels devoid of exon 25, and the mutation offset this effect. Likewise, alternative splicing in the C-terminal tail of Cav2.1 α1-subunits of P/Q-type channels (CACNA1A) affected the functional changes of several gain-of-function missense mutations causing Familial Hemiplegic Migraine Type 1 [Citation8], including S218L. It is possible that this mechanism also contributes to the differential effects of this mutation on neurotransmission at cortical pyramidal (gain-of-function of excitatory neurotransmission) and multipolar interneurons (unaltered inhibitory neurotransmission) in S218L knockin mice [Citation37].
In addition, our data further strengthen our previous finding that ω-currents through the voltage sensor could represent an alternative molecular mechanism how CACNA1D mutations could drive depolarization and subsequent activation of voltage-gated Ca2+-entry [Citation21]. APA mutation R990H affects the basic charge R3 in the voltage-sensor of domain III of the Cav1.3 α1-subunit and allows permeation of cation flux at resting membrane potentials compatible with the formation of a water wire as predicted by molecular dynamics simulations [Citation21]. However, to support the hypothesis of a pathogenic role of this mechanism the absence of typical gating changes as described for other mutations needs to be demonstrated. While we have shown this earlier for the long splice variant of Cav1.3 (R990HL), we here complement our findings by also demonstrating that gain-of function gating changes are also absent in R990HS.
We were unable to demonstrate any functional consequences for APA mutation M1354I despite an extensive analysis of its gating properties and characterization of the mutation in both splice variants. The only significant change was a small reduction in maximal current amplitude compared to WT in both splice variants. However, based on findings in Cav1.3 knockout mice and humans with CACNA1D mutations [Citation19,Citation20], a loss-of-function phenotype by a heterozygous de novo mutation is unlikely to be pathogenic. At present, we cannot rule out the possibility that a special combination of accessory β- and α2δ-subunits, other splice variants or a yet unknown molecular mechanism not active in our expression system can unmask functional changes in M1354I channels. An alternative possibility is that this rare variant is not responsible for excess aldosterone production in APAs. This is supported by the fact that high-confidence somatic nonsynonymous CACNA1D variants that passed stringent in silico filtering have recently been described in APCCs [Citation22] that are also unlikely to be pathogenic. This includes two premature stop codons. One of these (R510X) must result in a truncated non-functional channel. Another APA mutation, V728I, reported previously only once in an APA of a Chinese patient [Citation18,Citation38] is frequently present germline in healthy individuals [39 heterozygous alleles in EXAC database]. This also questions if it alone can account for excessive aldosterone production. Since this mutation is located on the extracellular end of helix IIS6 it is outside the regions highly vulnerable to mutational gating defects [S4, S4-S5-linker, cytoplasmic end of S6; 18]. Functional characterization of this mutation must therefore address its potential pathogenic role.
Our work also has important diagnostic consequences. First, by extending the list of APA mutations for which we can demonstrate functional changes compatible with a pathogenic phenotype, we facilitate future genetic diagnosis in patients with neurodevelopmental syndromes of unknown cause. If any of these APA mutations were identified germline in such patients, this would provide robust evidence for a causal role in their disease, even if endocrine symptoms were absent. Although APA mutations can drive excess aldosterone production in these benign tumors, hyperaldosteronism has so far only been reported for two mutations in three (two with G403D, one with I750M) of the patients with germline missense mutations. No endocrine abnormalities were reported in the clinically well-studied patient carrying the V401L APA mutation [Citation9]. At present the overall number of patients with germline mutations is too small for a reliable genotype-phenotype correlation.
Second, we show that the typical (“diagnostic”) gating changes, despite significant differences, are found in long and short Cav1.3 splice variants. Therefore, for further routine diagnostics, analysis in one of the splice variants is sufficient if the diagnostic hallmarks can be demonstrated therein. Characterization of a larger set of mutations now allows us to propose four different characteristic types based on functional criteria (): Type 1 are the inactivation-deficient mutations, in which most of the Cav1.3 current fails to inactivate in Cav1.3L. These comprise G403D, G403R, G407R. They could also be classified as “Timothy Syndrome- like” mutations because they are very similar to the Cav1.2 α1-subunit (CACNA1C) mutations diagnostic for Timothy Syndrome [Citation40,Citation41]. Type 2 mutations still inactivate to variable extents but are characterized by pronounced negative shifts of activation voltage with or without a strong negative shift also of inactivation voltage (A749G, I750M, V401L, V1153G, V259D and, as reported here, F747L). Type 3 is characterized only by slower and less complete inactivation after 3–5 s at Vmax, which should favor persistent current in cells during prolonged depolarizations. Type 4 are mutations in the voltage sensor (e.g. S4 helix positive charges), which enable depolarizing ω-currents as described in several other voltage-gated Ca2+-channels [Citation39,Citation42–Citation44]. Mutations without a functional phenotype in vitro as shown here for M1354I should be considered rare non-pathogenic variants until further functional or clinical proof for their pathogenicity can be obtained.
Disclosure statement
No potential conflict of interest was reported by the authors.
Additional information
Funding
References
- Striessnig J, Pinggera A, Kaur G, et al. L-type calcium channels in heart and brain. Wiley Interdiscip Rev Membr Transp Signal. 2014;3:15–38.
- Zamponi GW, Striessnig J, Koschak A, et al. The physiology, pathology, and pharmacology of voltage-gated calcium channels and their future therapeutic potential. Pharmacol Rev. 2015;67:821–870.
- Nanou E, Catterall WA. Calcium Channels, Synaptic Plasticity, and Neuropsychiatric Disease. Neuron. 2018;98:466–481.
- Tottene A, Pivotto F, Fellin T, et al. Specific kinetic alterations of human CaV2.1 calcium channels produced by mutation S218L causing familial hemiplegic migraine and delayed cerebral edema and coma after minor head trauma. J Biol Chem. 2005;280:17678–17686.
- van Den Maagdenberg AM, Pietrobon D, Pizzorusso T, et al. A Cacna1a knockin migraine mouse model with increased susceptibility to cortical spreading depression. Neuron. 2004;41:701–710.
- Kraus RL, Sinnegger MJ, Glossmann H, et al. Familial hemiplegic migraine mutations change alpha1A calcium channel kinetics. J Biol Chem. 1998;273:5586–5590.
- Kraus RL, Sinnegger MJ, Koschak A, et al. Three New Familial Hemiplegic Migraine Mutants Affect P/Q-type Calcium Channel Kinetics. J Biol Chem. 2000;275:9239–9243.
- Adams PJ, Garcia E, David LS, et al. Ca(V)2.1 P/Q-type calcium channel alternative splicing affects the functional impact of familial hemiplegic migraine mutations: implications for calcium channelopathies. Channels (Austin). 2009;3:110–121.
- Pinggera A, Mackenroth L, Rump A, et al. New gain-of-function mutation shows CACNA1D as recurrently mutated gene in autism spectrum disorders and epilepsy. Hum Mol Genet. 2017;26:2923–2932.
- Pinggera A, Lieb A, Benedetti B, et al. CACNA1D De Novo Mutations in Autism Spectrum Disorders Activate Cav1.3 L-Type Calcium Channels. Biol Psychiatry. 2015;77:816–822.
- Azizan EAB, Poulsen H, Tuluc P, et al. Somatic mutations in ATP1A1 and CACNA1D underlie a common subtype of adrenal hypertension. Nat Genet. 2013;45:1055–1060.
- Tan GC, Negro G, Pinggera A, et al. Aldosterone-Producing Adenomas: histopathology-Genotype Correlation and Identification of a Novel CACNA1D Mutation. Hypertension. 2017;70:129–136.
- Flanagan SE, Vairo F, Johnson MB, et al. A CACNA1D mutation in a patient with persistent hyperinsulinaemic hypoglycaemia, heart defects, and severe hypotonia. Pediatr Diabetes. 2017;18:320–323.
- Garza-Lopez E, Lopez JA, Hagen J, et al. Role of a conserved glutamine in the function of voltage-gated Ca(2+) channels revealed by a mutation in human CACNA1D. J Biol Chem. 2018;293:14444–14454.
- Scholl UI, Goh G, Stolting G, et al. Somatic and germline CACNA1D calcium channel mutations in aldosterone-producing adenomas and primary aldosteronism. Nat Genet. 2013;45:1050–1054.
- Limpitikul WB, Dick IE, Ben-Johny M, et al. An autism-associated mutation in Cav1.3 channels has opposing effects on voltage- and Ca2+-dependent regulation. Sci. Rep. 2016;6:27235.
- Barrett PQ, Guagliardo NA, Klein PM, et al. Role of voltage-gated calcium channels in the regulation of aldosterone production from zona glomerulosa cells of the adrenal cortex. J Physiol. 2016;594:5851–5860.
- Pinggera A, Striessnig J. Cav1.3 (CACNA1D) L-type Ca2+ channel dysfunction in CNS disorders. J Physiol. 2016;594:5839–5849.
- Platzer J, Engel J, Schrott-Fischer A, et al. Congenital deafness and sinoatrial node dysfunction in mice lacking class D L-type calcium channels. Cell. 2000;102:89–97.
- Baig SM, Koschak A, Lieb A, et al. Loss of Cav1.3 (CACNA1D) function in a human channelopathy with bradycardia and congenital deafness. Nat Neurosci. 2011;14:77–84.
- Monteleone S, Lieb A, Pinggera A, et al. Mechanisms Responsible for ω-Pore Currents in Cav Calcium Channel Voltage-Sensing Domains. Biophys J. 2017;113:1485–1495.
- Omata K, Anand SK, Hovelson DH, et al. Aldosterone-Producing Cell Clusters Frequently Harbor Somatic Mutations and Accumulate With Age in Normal Adrenals. J Endocr Soc. 2017;1:787–799.
- Nishimoto K, Tomlins SA, Kuick R, et al. Aldosterone-stimulating somatic gene mutations are common in normal adrenal glands. Proc Natl Acad Sci U S A. 2015;112:E4591–E4599.
- Monticone S, Buffolo F, Tetti M, et al. GENETICS IN ENDOCRINOLOGY: the expanding genetic horizon of primary aldosteronism. Eur J Endocrinol. 2018;178:R101–R11.
- Bock G, Gebhart M, Scharinger A, et al. Functional properties of a newly identified C-terminal splice variant of Cav1.3 L-type Ca2+ channels. J Biol Chem. 2011;286:42736–42748.
- Ortner NJ, Bock G, Dougalis A, et al. Lower Affinity of Isradipine for L-Type Ca2+ Channels during Substantia Nigra Dopamine Neuron-Like Activity: implications for Neuroprotection in Parkinson’s Disease. J Neurosci. 2017;37:6761–6777.
- Lieb A, Ortner N, Striessnig J. C-terminal modulatory domain controls coupling of voltage-sensing to pore opening in Cav1.3 L-type calcium channels. Biophys J. 2014;106:1467–1475.
- Tan BZ, Jiang F, Tan MY, et al. Functional characterization of alternative splicing in the C terminus of L-type Cav1.3 channels. J Biol Chem. 2011;286:42725–42735.
- Lieb A, Scharinger A, Sartori SB, et al. Structural determinants of Ca(V)1.3 L-type calcium channel gating. Channels. 2012;6:197–205.
- Ortner NJ, Striessnig J. L-type calcium channels as drug targets in CNS disorders. Channels (Austin). 2016;10:7–13.
- Singh A, Gebhart M, Fritsch R, et al. Modulation of voltage- and Ca2+-dependent gating of Cav1.3 L-type calcium channels by alternative splicing of a C-terminal regulatory domain. J Biol Chem. 2008;283:20733–20744.
- Liu X, Yang PS, Yang W, et al. Enzyme-inhibitor-like tuning of Ca2+ channel connectivity with calmodulin. Nature. 2010;463:968–972.
- Wu J, Yan Z, Li Z, et al. Structure of the voltage-gated calcium channel Cav1.1 at 3.6 Å resolution. Nature. 2016;537:191–196.
- Long SB, Tao X, Campbell EB, et al. Atomic structure of a voltage-dependent K+ channel in a lipid membrane-like environment. Nature. 2007;450:376–382.
- Dragicevic E, Poetschke C, Duda J, et al. Cav1.3 channels control D2-autoreceptor responses via NCS-1 in substantia nigra dopamine neurons. Brain. 2014;137:2287–2302.
- Powell KL, Cain SM, Ng C, et al. A Cav3.2 T-type calcium channel point mutation has splice-variant-specific effects on function and segregates with seizure expression in a polygenic rat model of absence epilepsy. J Neurosci. 2009;29:371–380.
- Vecchia D, Tottene A, van Den Maagdenberg AM, et al. Abnormal cortical synaptic transmission in Cav2.1 knockin mice with the S218L missense mutation which causes a severe familial hemiplegic migraine syndrome in humans. Front Cell Neurosci. 2015;9:8.
- Wang B, Li X, Zhang X, et al. Prevalence and characterization of somatic mutations in Chinese aldosterone-producing adenoma patients. Medicine (Baltimore). 2015;94:e708.
- Jiang D, Gamal El-Din TM, Ing C, et al. Structural basis for gating pore current in periodic paralysis. Nature. 2018;557:590–594.
- Splawski I, Timothy KW, Decher N, et al. Severe arrhythmia disorder caused by cardiac L-type calcium channel mutations. Proc Natl Acad Sci U S A. 2005;102:8089–8096, discussion 6–8
- Splawski I, Timothy KW, Sharpe LM, et al. Cav1.2 calcium channel dysfunction causes a multisystem disorder including arrhythmia and autism. Cell. 2004;119:19–31.
- Striessnig J, Bolz HJ, Koschak A. Channelopathies in Cav1.1, Cav1.3, and Cav1.4 voltage-gated L-type Ca2+ channels. Pflugers Arch. 2010;460:361–374.
- Jurkat-Rott K, Groome J, Lehmann-Horn F. Pathophysiological role of omega pore current in channelopathies. Front Pharmacol. 2012;3:112.
- Cannon SC. Voltage-sensor mutations in channelopathies of skeletal muscle. J Physiol. 2010;588:1887–1895.