


Lesson overview
This lesson introduces students to principles of GPS coordinates and data collection through smartphone applications as well as use of open source software to map phenomena. In this specific lesson we focus on sound. This lesson plan has been adapted from a previous Science Saturday activity delivered in 2019 to junior high and high school students.
Time required
Initially, this lesson was designed to cover two class periods of 1 hour and 15 minutes, for a total of 2 hours 30 minutes. Later, it was adapted for a 4-hour period, where data gathering and database preparation were given more time. Instructors will be able to tweak the lesson according to their students’ needs.
Preparation
Equipment
Computer
Access to Internet
Microsoft Excel or Google Sheets
Smartphone
Internal GPS
Access to Google Play Store (or Apple iTunes) to download the specific application
Standards
National Geography Standards
Essential Element: The World in Spatial Terms
1. How to use maps and other geographic representations, geospatial technologies, and spatial thinking to understand and communicate information.
3. How to analyze the spatial organization of people, places, and environments on Earth’s surface.
Essential Element: The Uses of Geography
18. How to apply geography to interpret the present and plan for the future.
Objectives
Students will describe the use of geospatial technology
Students will apply geospatial technology available in smartphones
Students will integrate spreadsheet into ArcGIS online
Students will analyze variation of noise across the selected study area
Instructions
Lecture: The teacher begins by discussing how everyday tools, like smartphones and open source software, contribute to the democratization of geographic knowledge. In doing so, the teacher can explain how these available technologies could be used to uncover patterns of any given phenomenon, such as sound. Here, the teacher continues the discussion by reviewing the concepts and tools of GPS and GIS. The teacher may explain how a GPS receiver works and why absolute location is important for GIS analysis.
Demonstration: In addition, the teacher introduces students to the phenomenon or variable (i.e., sound). Students may be asked a series of questions related to this phenomenon. What is sound? What is noise pollution? How does noise pollution affect our health? What is a decibel (dB)? How can sound be measured? Here, the teacher demonstrates the use of a GPS receiver, a sound meter, and spreadsheets.
Demonstration: Following this, the teacher introduces students to smartphone applications. The teacher could present applications that capture different phenomena and those applications for GPS and sound. (This teaching lesson uses the My GPS Coordinates and Sound Meter applications, but different applications can be used.) In addition, the teacher should provide a demonstration of these two applications.
Fieldwork: After the demonstration, students should be ready for fieldwork and data collection (geographic coordinates and dB: minimum, maximum, and average.) The teacher could encourage students to collect data on specific days and/or during specific times. This will enable students to analyze the phenomenon at a different scale ().
Laboratory: Coming back from the field, students will build a database with the GPS and dB data using the spreadsheet application ().
Laboratory: Students will integrate their database into ArcGIS Online to create a map of sound using dB as the variable to be mapped.
Students will provide their spreadsheets to the teacher. The teacher will construct a map with all the data provided by the students. The teacher will discuss the results with the class ().
Figure 1. A CSV file on the making.
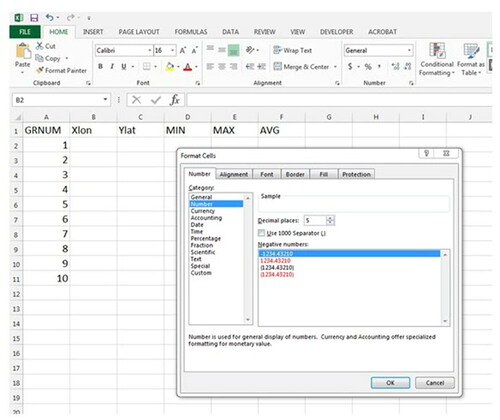
Figure 2. Final map showing the “visualization” of sound.
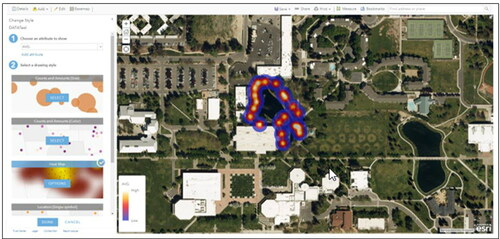
Figure 3 offers a summarized view that could be used in an in-person class. I encourage teachers to adapt this exercise according to their needs.
Figure 3. Lesson’s sections and assessments for an in-person class.
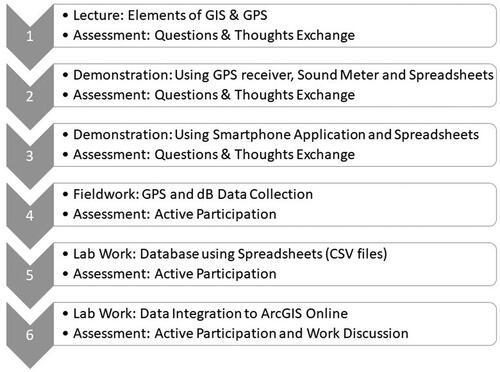
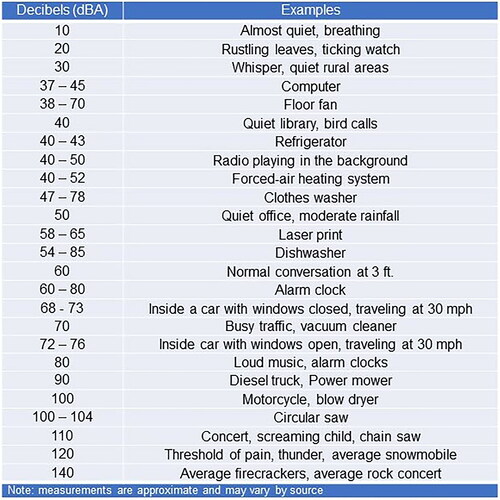
Table 1. Examples of sounds related to decibels (after Chepesiuk, 2005).
Assessment
Students will write a report. For example, students will prepare a short report using a word processor (i.e., Google Doc or Miscrosoft Word) and answer assessment questions provided by the teacher. The teacher can request the use of images or screenshots of the map. In addition, students will reflect on the learning experience. Finally, students will discuss other possible uses for smartphone applications in fieldwork.
Sample of assessment questions
How does GIS help people understand phenomena that cannot be seen (i.e., sound dB)?
Why are latitude and longitude necessary when recording data?
What open source tools/applications can help us to work collect dB and integrate to a GIS database and map?
Do smartphones help as an auxiliary tool to gather data in the absence of some devices such as sound meters or handheld GPS receivers?
What applications are available to gather other types of data?
Do dB values vary across the space and/or time? Explain.
Additional information
Notes on contributors
José R. Díaz-Garayúa
José R. Díaz-Garayúa is an Associate Professor of Geography in the Department of Anthropology, Geography, and Ethnic Studies at California State University, Stanislaus. He earned a BA in Psychology and Geography from the University of Puerto Rico, Río Piedras. After working as a Planning technician for the City of San Juan, Puerto Rico, he continued graduate studies at the University of Akron, Ohio earning an MA in Geography. He continued doctoral studies at Kent State University in Ohio where he earned a PhD in Geography. He has taught over twenty different courses on human geography and GIS prior to his tenure and promotion. Most of his research interests aligned in the intersection of inequities and race, ethnicity, and place.