
 ?Mathematical formulae have been encoded as MathML and are displayed in this HTML version using MathJax in order to improve their display. Uncheck the box to turn MathJax off. This feature requires Javascript. Click on a formula to zoom.
Abstract
Overheating risk is expected to rise in dwellings as heat waves continue increasing in intensity and duration. This paper presents a simulation-based study on thermal resilience in a benchmark renovated nearly zero-energy dwelling during intense heat waves in Belgium. Data analysis using thermal simulations of the reference dwelling with and without active cooling was used to assess overheating risk. The analysis indicated that the reference dwelling with active cooling was resilient to heat waves for over 91% of the occupied hours. Furthermore, the existing building-level renovation strategies alone will not be sufficient to mitigate overheating in renovated dwellings and require active cooling. However, active cooling came with an energy penalty of 37.69 kWh/day during the monitored period, and any potential benefits of active cooling should factor in the excess energy use. The presented findings lead to recommendations for future building renovation practices and identified needs for further research.
1. Introduction
The impacts of the ongoing climate crisis and its associated heat waves with high temperatures across many countries have been documented in (Pörtner et al. Citation2022). The global mean air temperature has increased over the past one hundred years due to human-induced climate change brought about by issues like fossil fuel usage, deforestation and changes in agricultural practices (Masson-Delmotte et al. Citation2018). The Intergovernmental Panel on Climate Change (IPCC) reports have unequivocally provided the connection between climate change and heat waves (Pörtner et al. Citation2022). Resilient building design and construction are urgently needed to prepare for climate change and the disruptions brought on by weather extremes (Attia Citation2023). Resilient building cooling systems are a crucial strategy to reduce risks to occupants because building disturbances will have significant and lasting health and economic effects (Gupta and Kapsali Citation2016). Moreover, due to climate change, there is an urgent need for resilient cooling systems in buildings to provide comfort even during extreme weather conditions (Holzer and Cooper Citation2019). Findings from previous studies like Attia and Gobin (Citation2020) pointed out the vulnerability of free-running timber dwellings to overheating in Belgium due to climate change.
Many societies in the world have experienced a string of severe and deadly heat waves since the start of the twenty-first century. Baccini et al. (Citation2008) indicated an increased mortality risk of 3.12% in the Mediterranean region and 1.84% in the north-continental regions of Europe, with an estimated temperature increase of 1°C above a location-specific threshold. For example, the heat wave of 2003 resulted in about 70,000 additional deaths, mainly in France, Germany, and Italy, according to the World Health Organization (WHO) and numerous national reports (Marx et al. Citation2021). Additionally, the heat waves that swept through England and Wales in the summer of 2022 reported an additional death toll of 3,271 people (ONS Citation2022). Figure shows the heat wave related additional mortalities that occurred in the past decades in the United Kingdom (ONS Citation2022), France (Fouillet et al. Citation2006; Hughes et al. Citation2016), India and Pakistan (Hughes et al. Citation2016), Japan (Hughes et al. Citation2016), Australia (Hughes et al. Citation2016), California in the United States (Hughes et al. Citation2016; Edwards et al. Citation2006), Germany (De Bono et al. Citation2004), Spain (De Bono et al. Citation2004), Italy (De Bono et al. Citation2004), Argentina (Chesini et al. Citation2022), and Senegal (Sy et al. Citation2021). These mortality rates are representative numbers as these may have been calculated using different methods in different regions and may not be directly comparable.
Figure 1. Heat wave-related mortalities around the globe during the past decades. Map generated using MapChart (Citation2022).
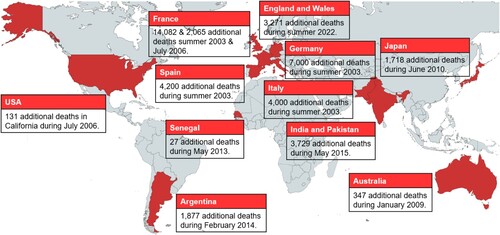
Table provides the key findings from 15 recent studies on the thermal building performance of dwellings during hot summer months. Studies from (Pathan et al. Citation2017; Vellei et al. Citation2017; Baborska-Narożny et al. Citation2017; Mavrogianni et al. Citation2017; Porritt et al. Citation2012; Pyrgou et al. Citation2017) were conducted in mixed humid (4A) climate zone, similar to the study locations. Studies (Morey et al. Citation2020; Sakka et al. Citation2012; Zinzi et al. Citation2020; Flores-Larsen et al. Citation2022; Zhou et al. Citation2020; Ji et al. Citation2022; Stone Jr et al. Citation2021b) and studies (Rajput et al. Citation2022; Stone Jr et al. Citation2021a) were conducted in other humid climate zones and dry climate zones, respectively. The existing literature emphasizes the risks of overheating in the residential sector and the significance of developing effective mitigation strategies that may prevent overheating in dwellings. The existing literature points towards a potential increase in air-conditioning use to mitigate overheating in the built environment (Sakka et al. Citation2012; Zinzi et al. Citation2020). Energy-efficient measures aimed at reducing heating energy use, such as an increase in the building envelope's insulation level, contribute to overheating during summer months, deteriorating the thermal performance in dwellings (Porritt et al. Citation2012; Pyrgou et al. Citation2017). However, expert opinions from (Taylor et al. Citation2023) recommend that adequate ventilation and shading can mitigate small increases in summertime temperatures after certain retrofits. The study further pointed out that to have more convincing evidence, further research into how energy-efficient design affects overheating in various settings and with various occupant behaviour patterns is required.
Table 1. Summary of recent literature on heatwave impacts on building performance.
The existing studies from Table were based on the unique assumption of comfort models and limits applied to the reference building while not differentiating them based on the purpose of building zones. Studies like Porritt et al. (Citation2012) evaluated the thermal environment using hours of exceedance that predicted comfort as a binary factor – comfortable vs. uncomfortable (Salimi et al. Citation2021). Pyrgou et al. (Citation2017) used a percentile-based methodology for calculating heat waves using temperature data over a year. However, the methodology developed by Ouzeau et al. (Citation2016) and adopted by IEA EBC Annex 80 recommends that a distribution of mean daily temperature over several years must be used while determining the heat wave thresholds. Multiple scientific reports like (WMO Citation2022; AdaptNSW Citation2022) indicated that more intense and prolonged heat waves would become the norm. Hence, it is essential to understand the impacts of heat waves on the built environment in a world where climate change's effects are becoming more visible. The relevance of this study is based on the following aspects:
As heat waves happen more frequently and intensely, they affect the occupant's comfort. By understanding the impact of heat waves on indoor overheating, strategies can be developed to mitigate the harmful effects of extreme heat on the indoor built environment and occupant well-being.
The focus is on indoor overheating in a dwelling since (i) people spend most of their time at home, especially older people who are more susceptible to overheating exposure (NHBC Citation2012), and (ii) overheating during sleep time at home has been reported as a severe public health risk (Zero Carbon Hub Citation2015; Kovats and Hajat Citation2008).
The study was focused on mixed humid climates in Belgium because (i) in terms of population, seven out of 15 largest cities in the EU and UK fall within mixed humid climates (4A) and constitute up to 57% of the total population (Eurostat Citation2022), and (ii) In terms of GDP, five out of 15 largest cities in the EU and the UK, fall within mixed humid climates (4A) and constitute up to 56% of the total GDP (Economie Citation2022).
The nearly zero-energy building requirements have been in effect in Belgium since 2010. These standards are modeled after the passive house standard, where high energy performance is advised, and numerous dwellings are renovated to meet the nearly zero-energy building requirements with nearly zero or very low energy consumption (Attia et al. Citation2022).
The study findings can be used to increase the understanding of overheating risks in renovated dwellings during heat waves and use this understanding to support the transition at the regional and national levels in Belgium and, to a larger extent, in mixed humid climates (4A) of Europe like London, Madrid, Milan, Paris, etc.
Based on these observations, the following research questions were formulated and addressed in this paper:
How can heat waves in Belgium be detected and categorized?
How resilient is the renovated nearly zero-energy dwelling against intense heat waves in Belgium?
This study expanded the scope of previous works from Table to include thermal resilience assessment. This study evaluated thermal resilience in a renovated nearly zero-energy dwelling with and without active cooling during and after an intense heat wave. The novelty of this paper is based on the following aspects. This paper combines adaptive and PMV/PPD comfort model thresholds for the reference dwelling. This modeling approach for the reference dwelling was designed after considering findings from sleep studies like (Cao et al. Citation2022; Lan et al. Citation2014; Okamoto-Mizuno and Mizuno Citation2012). During the literature review, to the best of our knowledge, we did not find any other studies that used this design approach for overheating evaluation during heat waves. The study also characterized overheating in the reference dwelling for seven days before the heat wave and seven days after. Analyzing the period before and after the heat waves will help to test the potential of passive strategies as mitigative measures and to determine the time required for the building to get back to the designed thresholds after events like heat waves in future studies (Attia et al. Citation2021).
2. Methodology
An overview of the methodology used in this paper is shown in Figure . The workflow used in this study is as follows:
The heat waves were identified and classified according to Ouzeau et al. (Citation2016) for the different study locations across Belgium over the past decades from 2001 to 2020, and the most intense heat wave was selected for building performance analysis.
Degree-hours were used to measure building resilience against heat waves, calculated by adding the total temperature values above the minimum and critical thresholds. This was used as an indicator since it considers the degree of variation in indoor operative temperature above the defined thresholds.
The overheating in the reference dwelling was characterized by Indoor Overheating Degree (IOD) (Hamdy et al. Citation2017a) and exceedance hours [h] for configurations with and without active cooling. The PMV/PPD and adaptive thresholds used complies with threshold limits from (ISO 17772-1 Citation2017).
Figure 2. Proposed study workflow.
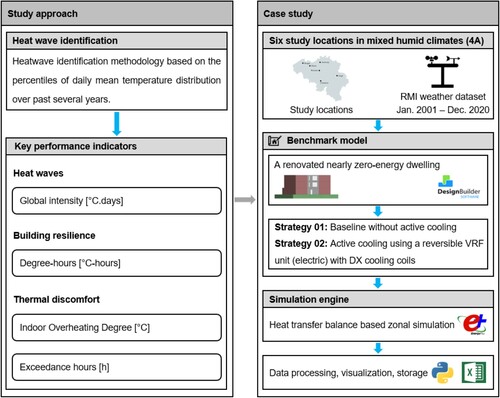
The heat waves across Belgium were detected using a custom Python code (Joshi et al. Citation2022) based on (Machard Citation2022). The building simulation model was created using DesignBuilder v7.1, a graphical user interface for the EnergyPlus simulation engine v9.1.
2.1 Study scope
The research was conducted in different study locations in Belgium, in mixed humid climates (4A), according to the classification from (ASHRAE 169 Citation2013). In such heating-dominated regions, the design of buildings is primarily focused on heat preservation inside the building during winter. This is achieved using airtight and highly insulated design principles (Amaripadath et al. Citation2023). As a result, relying solely on existing building-level passive cooling measures will make it difficult to prevent overheating issues during heat waves. Passive design strategies like the envelope and the ability of occupants to acclimatize are excluded from the boundary conditions of the study. There is an aging population in Europe who are vulnerable to cardiovascular and respiratory syndrome (Michelozzi et al. Citation2009). Their ability for acclimatization is low. The boundary conditions align with IEA EBC Annex 80.
2.2 Study approach
2.2.1 Heat wave identification
Regarding the identification of heat waves, the absence of a standard definition for heat waves today makes it difficult to analyze these events in great detail and compare them to previous, present, and future events in different regions. The factors which allow the detection and qualification, like the duration and thresholds., vary greatly. However, heat waves can be typically defined as periods with warm temperatures above the normal observed levels for several consecutive days (Ouzeau et al. Citation2016). Aligned with this observation, currently, there are two different definitions used to identify heat waves across Belgium: a. the Royal Meteorological Institute (RMI) defines heat waves as a period of five consecutive days with maximum daily temperatures of 25°C or more (summer days), including three days of 30°C or higher (tropical days) (Brits et al. Citation2009), b. the federal heat plan, ‘heat waves and ozone peaks’ defines heat waves as a period with a predicted minimum temperature of 18.2°C or more for three days and a maximum temperature of 29.6°C or higher (Brits et al. Citation2009). However, these methods do not consider the local climate of each region (Brits et al. Citation2009). Therefore, this study's heat wave identification method was based on percentiles of daily mean temperature distribution over the past several years to identify the thresholds (Ouzeau et al. Citation2016) IEA EBC Annex 80 adopted.
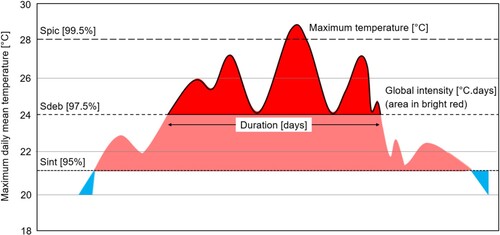
This method was based on three thresholds changed from absolute values to percentiles of the daily mean temperature distribution over several years (Ouzeau et al. Citation2016). This makes the method applicable to more data sets, as these values were computed independently for each study location. The thresholds (Ouzeau et al. Citation2016) used were Spic (99.5 percentile), beyond which a heat wave was detected; Sdeb (97.5 percentile), which determines when a heat wave begins and ends; and Sint (95 percentile), which allows the merging of two consecutive heat waves without a significant drop in temperature. Once the thresholds were estimated for individual study locations, heat waves were detected when the temperature exceeded the Spic. The global intensity [°C.days] was calculated by dividing the cumulative difference between the temperature and Sdeb throughout the event, divided by the Spic-Sdeb difference, represented by the bright red area in Figure .
Figure 3. Heat wave detection thresholds (Ouzeau et al. Citation2016).
2.2.2 Key performance indicators
2.2.2.1. Heat wave intensity
One of the key findings from (WMO Citation2022) was that most locations would see a three to tenfold increase in dangerous heat wave days by the end of the century. A report from (WMO Citation2022) found that heat waves will become more frequent, intense and last longer. Therefore, for overheating evaluation on the reference dwelling, a heat wave was selected based on the global intensity [°C.days], which is a measure of maximum temperature [°C] and duration [days].
2.2.2.2. Thermal resilience
The reference dwelling is Passive House certified, and the very high energy performance requirements of Passive House serve as an adequate indicator for passive survivability in the reference dwelling during extreme heat events (USGBC Citation2023). The reference dwelling has operable windows to meet the ventilation requirements during a concurrent heat wave and power outage, where mechanical ventilation will not be functional. The resilience of a building's cooling system is defined as the ability of the building's cooling system to withstand or recover from disturbances caused by disruptions and to adopt the necessary strategies after failure to mitigate building performance degradation due to deterioration of indoor environmental quality and/or increased need for space cooling energy (Attia et al. Citation2021).
The reference dwelling is designed for an acceptable value from 19°C recommended by (EN 16798-1 Citation2019), a minimum designed value of 26°C recommended by (EN 16798-1 Citation2019), and a critical thermal value of 30°C recommended by the Health and Safety Executive (HSE) (HSE Citation2010). In a changing climate, quantifying a building's thermal resilience during extreme events is critical (Homaei and Hamdy Citation2021; Mirzabeigi et al. Citation2022). The sum of the difference between the hourly operative and standard reference temperatures is used to calculate degree-hour values (Coskun Citation2010). In this case, the minimum design value of 26°C and the critical value of 30°C are standard reference temperatures.
2.2.2.3. Indoor overheating
Indoor Overheating Degree (IOD) was used to calculate the extent of discomfort caused by overheating (Hamdy et al. Citation2017a; Amaripadath et al. Citation2022). The IOD is a multizonal index that adds the total number of cooling degree hours divided by the total number of zonal occupied hours. The IOD values were calculated using equation (1).
(1)
(1) where
is the total number of conditioned zones in the building,
is the occupied hour counter,
is the total number of zonal occupied hours in zone
,
is the indoor operative temperature in zone z at time step
in (°C),
is the maximum comfort threshold in zone
at hour
in (°C).
2.2.2.4. Thermal discomfort
Exceedance hours (EH) is the number of occupied hours within a defined period during which the environmental conditions in an occupied space are outside the specified limits (ASHRAE 55 Citation2017; Carlucci and Pagliano Citation2012; Attia et al. Citation2023). Equations (2) and (3) show the equations for calculating exceedance hours for the PMV model () and adaptive model (
) respectively.
(2)
(2) where,
if
,
if
(3)
(3) where,
if
,
if,
where, is the discomfort hours [h],
is the indoor operative temperature [°C]. The
was derived from ISO 17772-1 adaptive model category II limits (ISO 17772-1 Citation2017) for the Office room and Living room + Kitchen in the reference dwelling, which was recommended for new buildings. Similar limits are recommend ed in (EN 16798-1 Citation2019). Equation (4) shows the upper limit (ISO 17772-1 Citation2017) based on the outdoor running mean temperature (
).
(4)
(4) The
was derived from ISO 17772-1 PMV/PPD model category II limits for the Bedrooms in the reference dwelling was 26°C for the upper limit recommended for new and renovated dwellings (ISO 17772-1 Citation2017). The Bedrooms in the reference dwelling were evaluated using PMV/PPD limits since numerous studies link sleep quality with the thermal environment. The study findings from (Altena et al. Citation2022) suggest that the ambient temperature inside the sleep areas should be kept preferably close to 19°C and if this is not possible, then between 20°C to 25°C, but never more than 26°C during heat waves. The field experiment results from (Cao et al. Citation2022) recommended an indoor temperature not greater than 26.1°C for summertime sleeping areas. The ideal sleep temperature of 26°C from (Lan et al. Citation2014) was very close to the recommended value of 26.1°C in (Cao et al. Citation2022). There were studies like (Okamoto-Mizuno and Mizuno Citation2012) that observed excessively high temperatures in sleeping areas will affect even healthy individuals. The impact of the most intense heat wave on the indoor environment of the reference dwelling using IOD (Hamdy et al. Citation2017a; Amaripadath et al. Citation2022) was categorized by (Flores-Larsen et al. Citation2022) as:
moderate impact, if
strong impact, if
extreme impact, if
2.3 Case study
2.3.1 Climate data
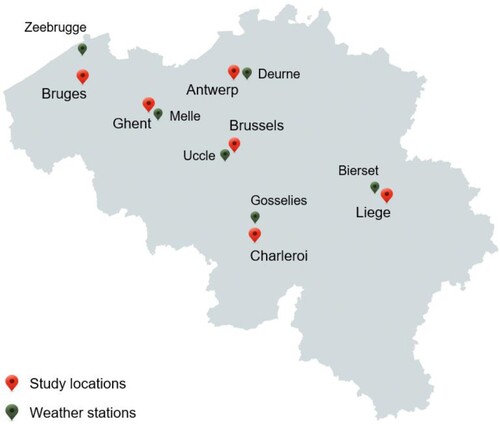
For heat wave identification, data from RMI weather stations were used. The weather data used in this study were retrieved from the RMI Opendata Platform (RMI Citation2022). Data availability time frames vary depending on the weather station, e.g. weather data for Ghent extracted from Melle between January 2001 and March 2003 was unavailable. The study locations and weather stations used for data extraction for the study locations are shown in Figure .
Figure 4. Belgian study locations and the weather stations used for data extraction used in the study.
2.3.2 Reference dwelling
The benchmark structure was a nearly zero-energy renovated dwelling after 2010 and was labeled as a nearly zero-energy building adhering to passive house standards (Hamdy et al. Citation2017b). The PHPP calculation model for dwellings in Belgium (Hamdy et al. Citation2017b; Attia et al. Citation2020; PMP Citation2011) mandates that the total energy demand for space heating and cooling must be less than or equal to 15 kWh/m² of conditioned floor area, and the total primary energy use should be less than or equal to 45 kWh/m². Furthermore, comfort is indicated as a 5% maximum of hours exceeding 25°C. The selected reference dwelling accurately represents 39 renovated nearly zero-energy dwellings in Brussels (Zero Carbon Hub Citation2015). The model was developed and validated through walkthrough audits, in-situ measurements, and four years of energy use bills. The reference dwelling has three floors with a total surface area of 173 m2. The building model was designed as follows (Attia et al. Citation2022):
Occupancy: a family of two parents around forty-five years old and two children of ten and seven years, respectively. The occupancy schedules were formulated with ISO 18523-2 (ISO Citation2016).
Clothing factor: light summer wear with 0.5 clo (ISO 7730 Citation2005).
Metabolic activity: standing relaxed activity with 0.9 met (ISO 7730 Citation2005).
Internal equipment gains: 8 W/m2 based on the running hours and power value.
Lighting gains: 8 W/m2 based on commonly used types and the number of lamps.
Water usage: 62 L/person/day.
Domestic Hot Water (DHW): 30 L/person/day at 60°C.
Processes: cooking activities were deduced to reach around 40–60 min/day.
Airflow rates for each zone were calculated based on the outside air definition method in DesignBuilder, which defines the maximum mechanical ventilation rate using minimum fresh air requirements per person (DesignBuilder Citation2023). The minimum fresh air rate per person was 8.33 l/s/person per the requirements from (EN 16798-1 Citation2019), and the number of occupants was 4. The airflow rate in m3/s is calculated as in equation (5).
(5)
(5) From equation (5), the airflow rate is 0.033 m3/s. The mechanical ventilation is scheduled to operate 24/7 during the monitored period. The window-to-wall ratio was 33%. The quality of the reference benchmark model was assured through calibration as per (ASHRAE 14 Guideline 14 Citation2014) using real monthly energy use data for natural gas and electricity use collected over four years from 2016 to 2019 (Attia et al. Citation2022). The Mean Bias Error (MBE) and Coefficient of the Variation of the Root Mean Square Error (CV(RMSE)) values of monthly electricity use were 2.7% and 5.6%, within the acceptable ranges. The building composition is as follows:
The ground floor has four layers and is made of Reinforced concrete with 2% steel (0.12 m), Spray-on-R-12 insulation polyurethane foam (0.0796 m), Cement screed (0.01 m), and Ceramic floor tiles (0.005) from the outer to the inner layer.
The internal floor has six layers and was made of Perlite plastering (0.015 m), Standard insulation (0.0228), Reinforced concrete with 2% steel (0.12 m), Sandstone floor (0.02 m), Cement bonded particle board (0.01 m), and Timber flooring (0.015 m) from the outer to the inner layer.
The external roof has four layers and was made of Asphalt (0.01 m), MW glass wool rolls (0.1179 m), Air gap (0.20 m), and Plasterboard (0.013 m) from the outer to the inner layer.
The external wall has three layers and was made of Brickwork (0.10 m), Standard insulation (0.0818 m), and Cast concrete of medium weight (0.14 m) from the outer to the inner layer.
The reference building has triple-glazed windows. The performance of the windows is good, with a low conductivity value of around 1 W/m2K.
The reference dwelling simulation model and floor layout are shown in Figure . The reference dwelling is oriented with a southeast facade. Additional details on the reference dwelling can be found at (Attia et al. Citation2022; Attia Citation2021). A general description and model characteristics are listed in Table A.1 and Table A.2 in Appendix A.
Figure 5. The renovated nearly zero-energy dwelling simulation model and floor layout.
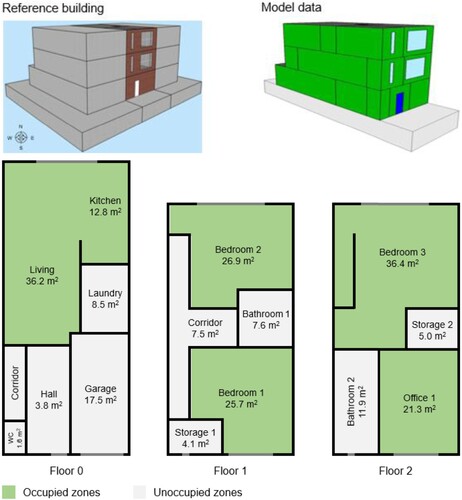
Two building configurations were evaluated in this study as follows:
Strategy 01 without active cooling: In the baseline configuration, active cooling was unavailable. The reference dwelling was mechanically ventilated during the summer period.
Strategy 02 with active cooling: Active cooling was implemented using a reversible VRF unit (electric) with DX cooling coils. A VRF unit was preferred over other systems because VRF systems are more energy efficient than conventional systems (Enterprise Citation2022; Rumsey et al. Citation2021). The sizing of the VRF system was performed with a climate change-sensitive approach ( Amaripadath et al. Citation2023) using design day calculation according to (ISO 15927-2 Citation2009). The design data for cooling consisted of a maximum dry-bulb temperature of 37°C, a minimum dry-bulb temperature of 21°C, and a coincident wet-bulb temperature of 21.3°C (Żuławińska Citation2022; Vecellio et al. Citation2022).
3. Results
3.1 How can heat waves in Belgium be detected and categorized?
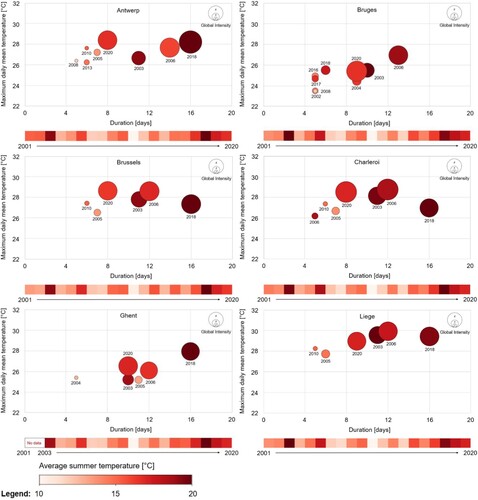
The heat waves across the study locations and average summer temperatures from 2001 to 2020 are shown in Figure .
Figure 6. Heat waves identified and classified across the study locations in Belgium from 2001 to 2020.
The most intense heat waves [°C.days] from each study location, along with the occurrence [year], maximum temperature [°C], and duration [days], are geolocated on the Belgian map and are shown in Figure .
Figure 7. The most intense heat waves with occurrence [year], global intensity [°C.days], maximum temperature [°C], and duration [days] geolocated on the study locations in Belgium from 2001 to 2020.
![Figure 7. The most intense heat waves with occurrence [year], global intensity [°C.days], maximum temperature [°C], and duration [days] geolocated on the study locations in Belgium from 2001 to 2020.](/cms/asset/b4ef4f46-8322-4981-9c28-65d619fdc5a1/tbps_a_2253460_f0007_oc.jpg)
3.2 How resilient is the renovated nearly zero-energy dwelling against intense heat waves in Belgium?
The operative temperature in the reference dwelling for Strategy 01 without active cooling and Strategy 02 with active cooling before, during, and after the heat wave is shown in Figure . The analysis of Strategy 02 with active cooling for building resilience showed that the reference dwelling has a low overheating exposure risk indicating that the building is less vulnerable to the heat wave. The impact of overheating during the heatwave is minimal to 0.01°C, which indicates that the reference dwelling is resistant to overheating exposure severity. The system's failure to maintain the designed minimum operative temperature of 26°C is evident from Figure . However, these are short-term failures, and the dwelling adapts to designed minimum thermal conditions.
Figure 8. Characterization of thermal resilience of cooling strategies in reference dwelling before, during, and after the intense heat wave in Antwerp, Belgium, from July 16, 2018, to August 14, 2018.
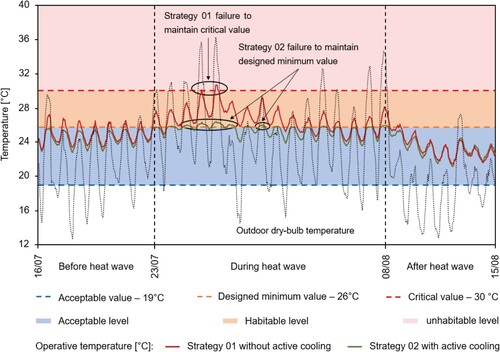
During the heat wave, Strategy 02 does not go into failure mode above the critical thermal condition of 30°C, whereas Strategy 01 fails to maintain the operative temperature at acceptable levels. The degree-hours for each strategy above the designed minimum value of 26°C and critical value of 30°C are listed in Table . The table shows a 100% decrease in degree-hours before and after the heat wave and a 98% decrease during the heat wave for Strategy 02 for the designed minimum value of 26°C. For the critical value of 30°C, Strategy 02 shows a 100% decrease in degree-hours during the heat wave.
Table 2. Thermal resilience quantification using degree-hours [°C-hours] for cooling strategies outside each temperature threshold before, during, and after the intense heat wave in Antwerp, Belgium, from July 16, 2018, to August 14, 2018.
3.3 How does overheating vary in the renovated nearly zero-energy dwelling with and without active cooling during intense heat waves?
Overheating was evaluated for the reference dwelling at the building and zone level before, during, and after the most intense heat wave in Antwerp, Belgium, from July 23, 2018, to August 07, 2018. Seven days were evaluated before and after the heat wave to consider the recoverability rate of the reference dwelling as per the IEA EBC Annex 80 dynamic simulation guideline (Zhang et al. Citation2023). The IOD computed for each occupied zone in the reference dwelling is shown in Figure . The IOD for Strategy 01 without active cooling was lower than Strategy 02 with active cooling after the heatwave by 0.01°C since the whole building was assessed using PMV/PPD limits for Strategy 02 with active cooling. In contrast, the Office room and Living + Kitchen were assessed using adaptive limits for Strategy 01 without active cooling.
Figure 9. Indoor Overheating Degree [°C] in different occupied zones in the reference nearly zero-energy dwelling before, during, and after the most intense heat wave in Antwerp, Belgium, from July 16, 2018, to August 14, 2018.
![Figure 9. Indoor Overheating Degree [°C] in different occupied zones in the reference nearly zero-energy dwelling before, during, and after the most intense heat wave in Antwerp, Belgium, from July 16, 2018, to August 14, 2018.](/cms/asset/3114ea85-6091-4e49-b3cc-7cc978277378/tbps_a_2253460_f0009_oc.jpg)
The percentage of exceedance hours to the total occupied hours in the reference dwelling zones is shown in Figure . There is a decrease in the percentage of exceedance hours [%] for the Bedrooms and Living + Kitchen for Strategy 02 with active cooling compared to Strategy 01 without active cooling with |PMV| > 0.5. In contrast, there is an increase in the percentage of exceedance hours in the Office room since it was calculated using a stringent |PMV| > 0.5 for Strategy 02 with active cooling compared to Strategy 01 without active cooling, which uses a more flexible upper adaptive operative temperature limit.
Figure 10. Percentage of overheating exceedance hours [%] in the reference dwelling zones during the intense heat wave in Antwerp, Belgium, from July 23, 2018, to August 07, 2018.
![Figure 10. Percentage of overheating exceedance hours [%] in the reference dwelling zones during the intense heat wave in Antwerp, Belgium, from July 23, 2018, to August 07, 2018.](/cms/asset/02756eeb-f79a-4bc4-8bdc-9ea38de8c4e3/tbps_a_2253460_f0010_oc.jpg)
4. Discussions
4.1 Findings and recommendations
The evaluation of heat waves across Belgium indicated that heat waves were increasing in duration and intensity each year. The most intense heat wave detected in Belgium had an intensity of 10.9°C.days, 16 days, and occurred in 2018. These findings aligned with the observations from (WMO Citation2022; AdaptNSW Citation2022), which indicated longer and more intense heat waves in the future.
From the analysis, Strategy 02, with active cooling proposed for the reference dwelling, is resilient to heat waves. This is evident from the percentage decrease in degree-hours for Strategy 02 from 98% to 100% before, during, and after the heat wave. Furthermore, the resilience of the cooling system can be improved by setting a design temperature that is lower than desired minimum thermal conditions.
Bedroom 2 is the worst discomfort zone, while the Office room is the least discomfort zone regarding the percentage of exceedance hours in the Baseline since the zones were analyzed using PMV/PPD and adaptive limits, respectively. Hence, it is advised to spend more non-sleeping hours in the Office room during heat waves, and sleeping hours should be shifted to Bedroom 1, which is relatively safer than other bedrooms in the reference dwelling. Additionally, the thermal safety zones like Bedroom 1 and Office room with minimal overheating exposure, add to the robustness of the reference dwelling.
The most intense heat wave in Belgium from 2001 to 2020 had a strong impact with an IOD of 0.60°C for Strategy 01 without active cooling and a moderate impact with an IOD of 0.01°C for Strategy 02 with active cooling on the indoor environment. This indicated a decrease in the extent of overheating during heat waves while using Strategy 02 with active cooling.
The percentage of exceedance hours decreased in the Bedrooms and increased in the Office room for Strategy 02 with active cooling compared to Strategy 01 without active cooling. This increase was since the exceedance hours for the Office room were calculated using stringent criteria of |PMV| > 0.5 for Strategy 02 compared to Strategy 01, which was calculated using more flexible criteria of upper adaptive operative temperature limit.
To conduct a comprehensive heat wave analysis, characterization of urban microclimate is inevitable. UHI should be characterized using: a. weather stations in the most vulnerable locations in the cities considering air temperature, solar radiation, surface topology, and population density, or b. simulation tools like the Urban Weather Generator (UWG) that calculates hourly urban air temperature and humidity based on data collected from an operational weather station outside of the city (Bueno et al. Citation2013).
The total site energy use for Strategy 01 was 8.72 kWh/day, and for Strategy 02 was 46.41 kWh/day during the monitored period from July 16, 2018, to August 14, 2018. While considering the comfort benefits of Strategy 01 with active cooling, it is also important to address the energy penalty and consequent environmental impacts due to greenhouse gas (GHG) emissions. The excess site energy use due to active cooling amounts to 37.69 kWh/day. This site energy value corresponds to the primary energy use of 94.225 kWhPE/day using a conversion factor 2.5 (Carlier Citation2016; IBGE Citation2017) and GHG emission of 25.44 kg.CO2e/day using a conversion factor of 0.270 kg.CO2e/kWh (Encon Citation2022), since the fuel source is electricity. Therefore, any potential benefits of using Strategy 02 over Strategy 01 should factor in the excess energy use, GHG emissions, and financial impact. Implementing passive design adaptations can reduce the energy demand for active cooling systems, and they are not mutually exclusive.
Active cooling systems are limited not only by their enhanced carbon emissions but by their ineffectiveness during heat wave conditions should the electrical grids fail, as was the case in several heat wave events highlighted in Figure . Future studies should evaluate the resilience during a concurrent heat wave and power outage and how integrating onsite renewables and storage capacities will contribute to the recoverability during such an event. However, this limitation can be offset through (i) onsite power generation through renewable energy systems (Rajput et al. Citation2022) and (ii) urban heat island mitigation like urban tree canopies (Middel et al. Citation2015; Skelhorn et al. Citation2014).
4.2 Strengths and limitations
The strengths of this paper are based on several aspects:
This paper provides the policymakers with evidence on the increasing intensity and duration of heat waves across the study locations in Belgium over the past decades. The study is important to building scientists, urban modelers, building designers, maintenance engineers, and energy engineers to shape sustainable solutions for mitigating and adapting to heat waves.
This study's heat wave identification methodology was based on three different thresholds that were percentiles of the daily mean temperature distribution over several years. The existing definition from RMI in Belgium was based on the absolute values of the maximum daily temperature observed in the Uccle weather station, which was unsuitable for a study involving multiple study locations.
This study used a reference dwelling model calibrated according to (ASHRAE Guideline 14 Citation2014) that was representative of renovated nearly zero-energy dwellings with monthly energy use values. In terms of building resilience and overheating assessments, this increased the reliability of the model outputs with the real-world outputs.
The main limitations of this study are:
The study considered cooling strategies at the building level. The study did not evaluate neighborhood-level measures, also called urban heat island mitigation strategies like urban tree canopies. Findings from existing studies like (Middel et al. Citation2015; Skelhorn et al. Citation2014) found that a 1% increase in urban tree cover results in a 0.14°C to 0.2°C drop in temperature in humid and arid areas. This should be considered in future studies.
The study was based on the free-running and air-conditioned operation of the reference dwelling. However, active measures also can be used alongside passive measures in mixed-mode operations to reduce energy use for active cooling as much as possible. The performance of mixed-mode operation during heat waves should be addressed in future studies.
4.3 Implications for practice and work
UHI effects in the cities exacerbate the detrimental effects of heat waves. UHI effect will intensify as the structure, spatial extent, and population density change and grow in urban areas unless the cities are equipped with adequate adaptive measures. Cities or metropolises with a large population and an industrial economy will be particularly affected by UHI (Skelhorn et al. Citation2014). Therefore, the measurement and reporting of UHI magnitudes should be carried out according to existing best practices to ensure the authenticity of the monitored data (Rizwan et al. Citation2008; Stewart Citation2011).
According to current adaptive model category II equations from (ISO 17772-1 Citation2017), the upper comfort limit exceeds 30°C during intense heat waves. However, this might not be comfortable in a real building and requires further investigation. The HSE had previously outlined a higher acceptable temperature of roughly 30°C for more sedentary activities and up to 27°C for strenuous activities ( HSE Citation2010).
As the temperature rises, heat waves will become more frequent and intense (Wuebbles Citation2017; Shevchenko et al. Citation2022). The increasing frequency of heat waves will increase deaths and illnesses from heat exposure, particularly among vulnerable populations like the elderly, children, economically disadvantaged, and people with chronic health conditions, unless communities adapt to these events (Sarofim et al. Citation2016). Hence, tracking heat waves as a visible effect of climate change and as a risk factor is vital.
5. Conclusions
The paper reiterates the importance of analyzing heat wave impacts on overheating in renovated dwellings to aid policymakers in shaping sustainable solutions to the detrimental effects of extreme short-term events on the built environment. This study evaluated heat wave impacts in terms of thermal resilience and overheating in a calibrated dwelling that was representative of renovated, nearly zero-energy dwellings in mixed humid climates (4A). The building thermal resilience was analyzed before, during, and after Belgium's most intense heat wave from 2001 to 2020. The results showed that the most intense heat wave would strongly impact the building resilience with Strategy 01 without active cooling and much less for Strategy 02 with active cooling. This finding was supported by an overheating analysis that showed a strong impact for Strategy 01 without active cooling with an IOD of 0.60°C and a moderate impact for Strategy 02 with active cooling with an IOD of 0.01°C.
All reference dwelling zones evaluated in the study showed a decrease in the exceedance hours with Strategy 02 except the Office room compared with Strategy 01 during the intense heat wave due to different comfort models used for the assessment. The study findings indicated that the existing building-level renovation strategies alone would be insufficient and that nearly zero-energy dwellings will require active cooling with climate change-sensitive sizing to reduce the overheating impact of heat waves on the indoor environment. Therefore, implementing resilient active cooling systems in buildings should be focused on mitigating the impact of heat waves on overheating in nearly zero-energy dwellings. To accelerate and contribute toward the EU objective of reducing emissions by 55% by the 2030s, the paper suggests increased integration of renewables and renovation of traditional building systems. This integration will help decrease the stress on existing electricity grids to meet the increasing energy demand during heat waves.
Declaration of competing interest
The authors declare that financial support was provided by the Walloon Public Service and MK Engineering, Belgium. The funders had no role in the study design, in the collection, analyses, or interpretation of data, in the writing of the manuscript, or in the decision to publish the results.
Acknowledgments
The European researchers were funded by the SPW and MK Engineering under BEWARE fellowships and the EU MSCA framework programme through contract no. 847587. The authors would like to gratefully acknowledge the Walloon Region, EU MSCA, and MK Engineering for the Project SurChauffe funding. We would like to thank the stakeholders of Project OCCuPANt. We also want to acknowledge the SBD Lab at the University of Liege for the use of the state-of-the-art Super COmputeR ProcessIng wOrkstatioN (SCORPION) for building performance simulations. This work was prepared in collaboration with the Research Center on Zero Emission Neighbourhoods in Smart Cities (FME ZEN) in Norway, and the authors acknowledge the support of ZEN partners and the Research Council of Norway. This study is a part of the IEA EBC Annex 80.
Disclosure statement
No potential conflict of interest was reported by the authors.
Data availability statement
The Python code used for heatwave identification, classification, and visualization is available at: doi.org/10.5281/zenodo.7326894 (Joshi et al. Citation2022).
Additional information
Funding
References
- AdaptNSW. 2022. “Climate Change Impacts on Heatwaves.” AdaptNSW, [Online]. Accessed October 19, 2022. https://www.climatechange.environment.nsw.gov.au/heatwaves.
- Altena, E., C. Baglioni, E. Sanz-Arigita, C. Cajochen, and D. Riemann. 2022. “How to Deal with Sleep Problems During Heatwaves: Practical Recommendations from the European Insomnia Network.” Journal of Sleep Research, e13704. https://doi.org/10.1111/jsr.13704.
- Amaripadath, D., R. Rahif, W. Zuo, M. Velickovic, C. Voglaire, and S. Attia. 2023. “Climate Change Sensitive Sizing and Design for Nearly Zero-Energy Office Building Systems in Brussels.” Energy and Buildings 286: 112971. https://doi.org/10.1016/j.enbuild.2023.112971.
- Amaripadath, D., M. Velickovic, and S. Attia. 2022. “Performance Evaluation of a Nearly Zero-Energy Office Building in Temperate Oceanic Climate Based on Field Measurements.” Energies 15 (18), https://doi.org/10.3390/en15186755.
- ANSI/ASHRAE. 2013. ASHRAE Standard 169: Climatic Data for Building Design Standards. Atlanta, GA, USA: American Society of Heating, Refrigerating and Air Conditioning Engineers.
- ANSI/ASHRAE. 2014. ASHRAE Guideline 14: Measurement of Energy, Demand, and Water Savings. Atlanta, GA, USA: American Society of Heating, Refrigerating and Air Conditioning Engineers.
- ANSI/ASHRAE. 2017. ASHRAE Standard 55: Thermal Environmental Conditions for Human Occupancy. Atlanta, GA, USA: American Society of Heating, Refrigerating and Air Conditioning Engineers.
- Attia, S. 2021. “Benchmark Model for Nearly-Zero-Energy Terraced Dwellings.” Harvard Dataverse, https://doi.org/10.7910/DVN/GJI84W.
- Attia, S. 2023. “11 - Resilient Cooling of Buildings to Protect Against Heatwaves and Power Outages.” In Adapting the Built Environment for Climate Change, edited by F. Pacheco-Torgal, and C.-G. Granqvist, 215–228. Woodhead Publishing. https://doi.org/10.1016/B978-0-323-95336-8.00014-7.
- Attia, S., C. Benzidane, R. Rahif, D. Amaripadath, M. Hamdy, P. Holzer, A. Koch, et al. 2023. “Overheating Calculation Methods, Criteria, and Indicators in European Regulation for Residential Buildings.” Energy and Buildings 292: 113170. https://doi.org/10.1016/j.enbuild.2023.113170.
- Attia, S., T. Canonge, M. Popineau, and M. Cuchet. 2022. “Developing a Benchmark Model for Renovated, Nearly Zero-Energy, Terraced Dwellings.” Applied Energy 306: 118128. https://doi.org/10.1016/j.apenergy.2021.118128.
- Attia, S., et al. Feb. 2021. Framework to Evaluate the Resilience of Different Cooling Technologies. Sustainable Building Design Lab. https://doi.org/10.13140/RG.2.2.33998.59208.
- Attia, S., and C. Gobin. 2020. “Climate Change Effects on Belgian Households: A Case Study of a Nearly Zero Energy Building.” Energies 13 (20): 5357. https://doi.org/10.3390/en13205357.
- Attia, S., R. Levinson, E. Ndongo, P. Holzer, O. Berk Kazanci, S. Homaei, C. Zhang, et al. 2021. “Resilient Cooling of Buildings to Protect Against Heat Waves and Power Outages: Key Concepts and Definition.” Energy and Buildings 239: 110869. https://doi.org/10.1016/j.enbuild.2021.110869.
- Attia, S., N. Shadmanfar, and F. Ricci. 2020. “Developing two Benchmark Models for Nearly Zero Energy Schools.” Applied Energy 263: 114614. https://doi.org/10.1016/j.apenergy.2020.114614.
- Baborska-Narożny, M., F. Stevenson, and M. Grudzińska. 2017. “Overheating in Retrofitted Flats: Occupant Practices, Learning and Interventions.” Building Research & Information 45 (1–2): 40–59. https://doi.org/10.1080/09613218.2016.1226671.
- Baccini, M., A. Biggeri, G. Accetta, T. Kosatsky, K. Katsouyanni, A. Analitis, H. R. Anderson, et al. 2008. “Heat Effects on Mortality in 15 European Cities.” Epidemiology 19 (5): 711–719. https://doi.org/10.1097/EDE.0b013e318176bfcd.
- Brits, E., I. Boone, B. Verhagen, M. Dispas, H. Vanoyen, Y. Van der Stede, and A. Van Nieuwenhuyse. 2009. “Climate Change and Health - Set-Up of Monitoring of Potential Effects of Climate Change on Human Health and on the Health of Animals in Belgium,” Scientific Institute of Public Health. https://www.belspo.be/belspo/organisation/publ/pub_ostc/agora/ragjj146_en.pdf.
- Bueno, B., L. Norford, J. Hidalgo, and G. Pigeon. 2013. “The Urban Weather Generator.” Journal of Building Performance Simulation 6 (4): 269–281. https://doi.org/10.1080/19401493.2012.718797.
- Cao, T., Z. Lian, J. Zhu, X. Xu, H. Du, and Q. Zhao. 2022. “Parametric Study on the Sleep Thermal Environment.” Building Simulation 15 (5): 885–898. https://doi.org/10.1007/s12273-021-0840-5.
- Carlier, M. 2016. “Nearly Zero-Energy Building Definitions in Selected Countries.” Master thesis, Ghent University, Ghent, Belgium. [Online]. www.libstore.ugent.be/fulltxt/RUG01/002/301/108/RUG01-002301108_2016_0001_AC.pdf.
- Carlucci, S., and L. Pagliano. 2012. “A Review of Indices for the Long-Term Evaluation of the General Thermal Comfort Conditions in Buildings.” Energy and Buildings 53: 194–205. https://doi.org/10.1016/j.enbuild.2012.06.015.
- CEN. 2019. EN 16798-1: Energy Performance of Buildings - Ventilation for Buildings - Indoor Environmental Input Parameters for Design and Assessment of Energy Performance of Buildings Addressing Indoor air Quality, Thermal Environment, Lighting and Acoustics. Brussels, Belgium: European Committee for Standardization.
- Chesini, F., N. Herrera, M. d. l. M. Skansi, C. G. Morinigo, S. Fontán, F. Savoy, and E. d. Titto. 2022. “Mortality Risk During Heat Waves in the Summer 2013-2014 in 18 Provinces of Argentina: Ecological Study.” Ciência & Saúde Coletiva 27 (5): 2071–2086. https://doi.org/10.1590/1413-81232022275.07502021.
- Coskun, C. 2010. “A Novel Approach to Degree-Hour Calculation: Indoor and Outdoor Reference Temperature Based Degree-Hour Calculation.” Energy 35 (6): 2455–2460. https://doi.org/10.1016/j.energy.2010.02.038.
- De Bono, A., G. Giuliani, S. Kluser, and P. Peduzzi. 2004. “Impacts of Summer 2003 Heat Wave in Europe.” UNEP [Online]. Accessed October 06, 2022. https://www.unisdr.org/files/1145_ewheatwave.en.pdf.
- DesignBuilder. 2023. “Outside Air.” DesignBuilder, Stroud, UK. [Online]. Accessed May 23, 2023. https://designbuilder.co.uk/helpv7.0/Content/Outside_Air.htm.
- Economie. 2022. “Energy Key Data.” FPS Economy Self-Employed and Energy. [Online]. Accessed November 21, 2022. https://economie.fgov.be/en/file/2970575/download?token=bESHUgsY.
- Edwards, L. M., et al. 2006. “A Review of the July 2006 Heat Wave in California.” AGU Fall Meeting Abstracts 2006: A13D–0971.
- Encon. 2022. “Calculation of CO2.” Encon. [online]. Accessed July 11, 2022. www.encon.be/en/calculation-co2.
- Enterprise. 2022. “What Are Residential VRF Systems & Why Should You Choose Them?” 22/7 Enterprise. [Online]. Accessed November 17, 2022. https://227enterprise.com/what-are-residential-vrf-systems/.
- Eurostat. 2022. “Gross Domestic Product (GDP) at Current Market Prices by Metropolitan Regions.” European Commission, Luxembourg. [online]. Accessed November 01, 2022. https://ec.europa.eu/eurostat/databrowser/view/MET_10R_3GDP/default/table?lang=en.
- Flores-Larsen, S., F. Bre, and M. Hongn. 2022. “A Performance-Based Method to Detect and Characterize Heatwaves for Building Resilience Analysis.” Renewable and Sustainable Energy Reviews 167: 112795. https://doi.org/10.1016/j.rser.2022.112795.
- Fouillet, A., G. Rey, F. Laurent, G. Pavillon, S. Bellec, C. Guihenneuc-Jouyaux, J. Clavel, E. Jougla, and Denis Hémon. 2006. “Excess Mortality Related to the August 2003 Heat Wave in France.” International Archives of Occupational and Environmental Health 80 (1): 16–24. https://doi.org/10.1007/s00420-006-0089-4.
- Gupta, R., and M. Kapsali. 2016. “Empirical Assessment of Indoor air Quality and Overheating in low-Carbon Social Housing Dwellings in England, UK.” Advances in Building Energy Research 10 (1): 46–68. https://doi.org/10.1080/17512549.2015.1014843.
- Hamdy, M., S. Carlucci, P. J. Hoes, and J. L. M. Hensen. 2017a. “The Impact of Climate Change on the Overheating Risk in Dwellings - A Dutch Case Study.” Building and Environment 122: 307–323. https://doi.org/10.1016/j.buildenv.2017.06.031.
- Hamdy, M., K. Sirén, and S. Attia. 2017b. “Impact of Financial Assumptions on the Cost Optimality Towards Nearly Zero Energy Buildings – a Case Study.” Energy and Buildings 153: 421–438. https://doi.org/10.1016/j.enbuild.2017.08.018.
- Holzer, P., and W. Cooper. 2019. “IEA EBC Annex 80 on Resilient Cooling for Residential and Small non-Residential Buildings.” IEA, https://doi.org/10.13140/RG.2.2.33912.47368.
- Homaei, S., and M. Hamdy. 2021. “Thermal Resilient Buildings: How to be Quantified? A Novel Benchmarking Framework and Labelling Metric.” Building and Environment 201: 108022. https://doi.org/10.1016/j.buildenv.2021.108022.
- HSE. 2010. “Temperature at Work,” Health & Safety Information, Merseyside, UK, 2010. [Online]. Available: https://www.unison.org.uk/content/uploads/2013/06/Briefings-and-CircularsTemperature-at-Work-Information-Health-and-Safety-Information-Sheet2.pdf. Accessed: November 11, 2022.
- Hughes, L., E. Hanna, and J. Fenwick. 2016. “The Silent Killer: Climate Change and the Health Impacts of Extreme Heat.” Climate council, Potts Point, Australia, 2016. [Online]. Accessed October 06, 2022. https://www.climatecouncil.org.au/uploads/b6cd8665c633434e8d02910eee3ca87c.pdf.
- IBGE. 2017. “Performance Energétique des Bâtiments: Guide des exigences et des procédures de la 960 réglementation Travaux PEB en Région de Bruxelles Capitale,” Brussels, Belgium, 2017.
- ISO. 2005. ISO 7730: Ergonomics of the Thermal Environment - Analytical Determination and Interpretation of Thermal Comfort Using Calculation of the PMV and PPD Indices and Local Thermal Comfort Criteria. Geneva, Switzerland: International Standards Organization.
- ISO. 2009. ISO 15927-2: Hygrothermal Performance of Buildings - Calculation and Presentation of Climatic Data - Part 2: Hourly Data for Design Cooling Load. Geneva, Switzerland: International Standards Organization.
- ISO. 2016. ISO 18523-2. Energy Performance of Buildings - Schedule and Condition of Building, Zone and Space Usage for Energy Calculation – Part 2: Residential Buildings. Geneva, Switzerland: International Standards Organization.
- ISO, ISO 17772-1. 2017. Energy Performance of Buildings – Indoor Environmental Quality. Part 1: Indoor Environmental Input Parameters for the Design and Assessment of Energy Performance in Buildings. Geneva, Switzerland: International Standards Organization.
- Ji, L., A. Laouadi, C. Shu, A. Gaur, M. Lacasse, and L. Wang. 2022. “Evaluating Approaches of Selecting Extreme hot Years for Assessing Building Overheating Conditions During Heatwaves.” Energy and Buildings 254: 111610. https://doi.org/10.1016/j.enbuild.2021.111610.
- Joshi, M. Y., D. Amaripadath, A. Machard, and S. Attia. 2022. Heatwaves Identification Classification and Visualisation with Python: V.1.0.0. Zenodo. https://doi.org/10.5281/zenodo.7326894.
- Kovats, R. S., and S. Hajat. 2008. “Heat Stress and Public Health: A Critical Review.” Annual Review of Public Health 29 (1): 41–55. https://doi.org/10.1146/annurev.publhealth.29.020907.090843.
- Lan, L., L. Pan, Z. Lian, H. Huang, and Y. Lin. 2014. “Experimental Study on Thermal Comfort of Sleeping People at Different air Temperatures.” Building and Environment 73: 24–31. https://doi.org/10.1016/j.buildenv.2013.11.024.
- Legal Information Institute. 2022. “10 CFR § 431.97 - Energy Efficiency Standards and Their Compliance Dates.” Cornell Law School, NY, USA. [Online]. Accessed December 12, 2022. https://www.law.cornell.edu/cfr/text/10/431.97#fn1_tbl2.
- Machard, A. 2022. AMachard/Assembling-Future-Weather-Files-Including-Heatwaves: V1.0.0. Zenodo. https://doi.org/10.5281/zenodo.7300024.
- MapChart. 2022. “Create Your Own Custom Map.” MapChart. [Online]. Accessed October 10, 2022. https://www.mapchart.net/.
- Marx, W., R. Haunschild, and L. Bornmann. 2021. “Heat Waves: A hot Topic in Climate Change Research.” Theoretical and Applied Climatology 146 (1): 781–800. https://doi.org/10.1007/s00704-021-03758-y.
- Masson-Delmotte, V., et al. 2018. “Global Warming of 1.5°C.” An IPCC Special Report on the Impacts of Global Warming 1 (5).
- Mavrogianni, A., A. Pathan, E. Oikonomou, P. Biddulph, P. Symonds, and M. Davies. 2017. “Inhabitant Actions and Summer Overheating Risk in London Dwellings.” Building Research & Information 45 (1–2): 119–142. https://doi.org/10.1080/09613218.2016.1208431.
- Michelozzi, P., G. Accetta, M. De Sario, D. D'Ippoliti, C. Marino, M. Baccini, A. Biggeri, et al. 2009. “High Temperature and Hospitalizations for Cardiovascular and Respiratory Causes in 12 European Cities.” American Journal of Respiratory and Critical Care Medicine 179 (5): 383–389. https://doi.org/10.1164/rccm.200802-217OC.
- Middel, A., N. Chhetri, and R. Quay. 2015. “Urban Forestry and Cool Roofs: Assessment of Heat Mitigation Strategies in Phoenix Residential Neighborhoods.” Urban Forestry & Urban Greening 14 (1): 178–186. https://doi.org/10.1016/j.ufug.2014.09.010.
- Mirzabeigi, S., S. Homaei, M. Razkenari, and M. Hamdy. 2022. “The Impact of Building Retrofitting on Thermal Resilience Against Power Failure: A Case of air-Conditioned House.” Conference on building energy and environment, Montreal, Canada.
- Morey, J., A. Beizaee, and A. Wright. 2020. “An Investigation Into Overheating in Social Housing Dwellings in Central England.” Building and Environment 176: 106814. https://doi.org/10.1016/j.buildenv.2020.106814.
- NHBC. 2012. Overheating in new Homes: A Review of the Evidence. UK: National House Building Council.
- Okamoto-Mizuno, K., and K. Mizuno. 2012. “Effects of Thermal Environment on Sleep and Circadian Rhythm.” Journal of Physiological Anthropology 31 (1): 14. https://doi.org/10.1186/1880-6805-31-14.
- ONS. 2022. “Excess Mortality During Heat-Periods: June 01 to August 31, 2022.” Office for National Statistics, 2022. [Online]. Accessed May 22, 2023. https://www.ons.gov.uk/peoplepopulationandcommunity/birthsdeathsandmarriages/deaths/articles/excessmortalityduringheatperiods/englandandwales1juneto31august2022.
- Ouzeau, G., J.-M. Soubeyroux, M. Schneider, R. Vautard, and S. Planton. 2016. “Heat Waves Analysis Over France in Present and Future Climate: Application of a new Method on the EURO-CORDEX Ensemble.” Climate Services 4: 1–12. https://doi.org/10.1016/j.cliser.2016.09.002.
- Pathan, A., A. Mavrogianni, A. Summerfield, T. Oreszczyn, and M. Davies. 2017. “Monitoring Summer Indoor Overheating in the London Housing Stock.” Energy and Buildings 141: 361–378. https://doi.org/10.1016/j.enbuild.2017.02.049.
- PMP. 2011. “Plate-forme Maison Passive: Le guide du passif en Belgique Francophone.” Vademecum, 2011. [Online]. Accessed December 15, 2022. https://www.maisonpassive.be/?Vademecum.
- Porritt, S. M., P. C. Cropper, L. Shao, and C. I. Goodier. 2012. “Ranking of Interventions to Reduce Dwelling Overheating During Heat Waves.” Energy and Buildings 55: 16–27. https://doi.org/10.1016/j.enbuild.2012.01.043.
- Pörtner, H.-O., et al. 2022. “Climate Change 2022: Impacts, adaptation and vulnerability.” IPCC 6th Assessment Report, 2022. [Online]. Accessed December 29, 2022. https://report.ipcc.ch/ar6/wg2/IPCC_AR6_WGII_FullReport.pdf.
- Pyrgou, A., V. L. Castaldo, A. L. Pisello, F. Cotana, and M. Santamouris. 2017. “On the Effect of Summer Heatwaves and Urban Overheating on Building Thermal-Energy Performance in Central Italy.” Sustainable Cities and Society 28: 187–200. https://doi.org/10.1016/j.scs.2016.09.012.
- Rajput, M., G. Augenbroe, B. Stone, M. Georgescu, A. Broadbent, S. Krayenhoff, and E. Mallen. 2022. “Heat Exposure During a Power Outage: A Simulation Study of Residences Across the Metro Phoenix Area.” Energy and Buildings 259: 111605. https://doi.org/10.1016/j.enbuild.2021.111605.
- Rizwan, A. M., L. Y. C. Dennis, and C. Liu. 2008. “A Review on the Generation, Determination and Mitigation of Urban Heat Island.” Journal of Environmental Sciences 20 (1): 120–128. https://doi.org/10.1016/S1001-0742(08)60019-4.
- RMI. 2022. “Opendata Meteo.” Royal Meteorological Institute, Brussels, Belgium, 2022. [Online]. Accessed July 21, 2022. https://opendata.meteo.be/.
- Rumsey, P., J. Le Garrec, and A. Levasseur. Sep. 2021. “How Building Decarbonization Can Transform HVAC.” ASHRAE Journal 63 (9): 14–27. [Online] Accessed November 16, 2022. https://go.gale.com/ps/i.do?id=GALE%7CA689991717&sid=googleScholar&v=2.1&it=r&linkaccess=abs&issn=00012491&p=AONE&sw=w&userGroupName=anon%7Ee78966b4.
- Sakka, A., M. Santamouris, I. Livada, F. Nicol, and M. Wilson. 2012. “On the Thermal Performance of low Income Housing During Heat Waves.” Energy and Buildings 49: 69–77. https://doi.org/10.1016/j.enbuild.2012.01.023.
- Salimi, S., E. Estrella Guillén, and H. Samuelson. 2021. “Exceedance Degree-Hours: A new Method for Assessing Long-Term Thermal Conditions.” Indoor Air 31 (6): 2296–2311. https://doi.org/10.1111/ina.12855.
- Sarofim, M. C., et al. 2016. Chapter 2: Temperature-related death and illness. In: The impacts of climate change on human health in the United States: A scientific assessment. U.S. Global Change Research Program. Available: https://health2016.globalchange.gov.
- Shevchenko, O., S. Snizhko, S. Zapototskyi, H. Svintsitska, M. Matviienko, and A. Matzarakis. 2022. “Long-term Analysis of Thermal Comfort Conditions During Heat Waves in Ukraine.” Geographia Polonica 95 (1): 53–70. https://doi.org/10.7163/GPol.0226.
- Skelhorn, C., S. Lindley, and G. Levermore. 2014. “The Impact of Vegetation Types on air and Surface Temperatures in a Temperate City: A Fine Scale Assessment in Manchester, UK.” Landscape and Urban Planning 121: 129–140. https://doi.org/10.1016/j.landurbplan.2013.09.012.
- Stewart, I. D. 2011. “A Systematic Review and Scientific Critique of Methodology in Modern Urban Heat Island Literature.” International Journal of Climatology 31 (2): 200–217. https://doi.org/10.1002/joc.2141.
- Stone, B., E. Mallen, M. Rajput, A. Broadbent, E. S. Krayenhoff, G. Augenbroe, and M. Georgescu. 2021a. “Climate Change and Infrastructure Risk: Indoor Heat Exposure During a Concurrent Heat Wave and Blackout Event in Phoenix, Arizona.” Urban Climate 36: 100787. https://doi.org/10.1016/j.uclim.2021.100787.
- Stone, B., E. Mallen, M. Rajput, C. J. Gronlund, A. M. Broadbent, E. S. Krayenhoff, G. Augenbroe, M. S. O’Neill, and M. Georgescu. 2021b. “Compound Climate and Infrastructure Events: How Electrical Grid Failure Alters Heat Wave Risk.” Environmental Science & Technology 55 (10): 6957–6964. https://doi.org/10.1021/acs.est.1c00024.
- Sy, I., B. Cissé, B. Ndao, M. Touré, A. A. Diouf, M. A. Sarr, O. Ndiaye, et al. 2021. “Heatwaves and Health Risks in the Northern Part of Senegal: Analysing the Distribution of Temperature Related Diseases and Associated Risk Factors.” https://doi.org/10.21203/rs.3.rs-1098485/v1.
- Taylor, J., R. McLeod, G. Petrou, C. Hopfe, A. Mavrogianni, R. Castaño-Rosa, S. Pelsmakers, and K. Lomas. 2023. “Ten Questions Concerning Residential Overheating in Central and Northern Europe.” Building and Environment 234: 110154. https://doi.org/10.1016/j.buildenv.2023.110154.
- USGBC. 2023. “Passive survivability and back-up power during disruptions.” United States Green Building Council, Washington, D.C., USA. [Online]. Accessed May 22, 2023. https://www.usgbc.org/credits/new-construction-core-and-shell-schools-new-construction-retail-new-construction-data-48.
- Vecellio, D. J., S. T. Wolf, R. M. Cottle, and W. L. Kenney. 2022. “Evaluating the 35°C Wet-Bulb Temperature Adaptability Threshold for Young, Healthy Subjects (PSU HEAT Project).” Journal of Applied Physiology 132 (2): 340–345. https://doi.org/10.1152/japplphysiol.00738.2021.
- Vellei, M., A. P. Ramallo-González, D. Coley, J. Lee, E. Gabe-Thomas, T. Lovett, and S. Natarajan. 2017. “Overheating in Vulnerable and non-Vulnerable Households.” Building Research & Information 45 (1–2): 102–118. https://doi.org/10.1080/09613218.2016.1222190.
- WMO. 2022. “This Heatwave Is the New Normal.” World Meteorological Organization, 2022. [Online]. Accessed October 15, 2022. https://public.wmo.int/en/media/news/%E2%80%9C-heatwave-new-normal%E2%80%9D-says-wmo-secretary-general.
- Wuebbles, D. J. 2017. “Climate Science Special Report: Fourth National Climate Assessment, Volume I.” United States Global Change Research Program. https://doi.org/10.7930/J0J964J6.
- Zero Carbon Hub. 2015. Impacts of Overheating: Evidence Review. London, England: Zero Carbon Hub.
- Zhang, C., et al. 2023. “IEA EBC Annex 80 - Dynamic Simulation Guideline for the Performance Testing of Resilient Cooling Strategies: Version 2.” Technical report no. 306, Aalborg University, Denmark.
- Zhou, X., J. Carmeliet, M. Sulzer, and D. Derome. 2020. “Energy-efficient Mitigation Measures for Improving Indoor Thermal Comfort During Heat Waves.” Applied Energy 278: 115620. https://doi.org/10.1016/j.apenergy.2020.115620.
- Zinzi, M., S. Agnoli, C. Burattini, and B. Mattoni. 2020. “On the Thermal Response of Buildings Under the Synergic Effect of Heat Waves and Urban Heat Island.” Solar Energy 211: 1270–1282. https://doi.org/10.1016/j.solener.2020.10.050.
- Żuławińska, J. 2022. “Wet Bulb Calculator.” Omni Calculator, 2022. [online]. Accessed March 17, 2022. www.omnicalculator.com/physics/wet-bulb.
Appendix A
The general characteristics of the reference dwelling are listed in Table .
The model characteristics and assumptions are listed in Table .
The VRF unit has a COP of 3.3 for cooling from the existing energy efficiency standards (Legal Information Institute Citation2022).
Table A.1. The general description of the reference dwelling.
Table A.2. The DesignBuilder model inputs.