
 ?Mathematical formulae have been encoded as MathML and are displayed in this HTML version using MathJax in order to improve their display. Uncheck the box to turn MathJax off. This feature requires Javascript. Click on a formula to zoom.
Abstract
A statistical model to calculate dynamic, electric vehicle (EV) charging loads at public hubs, which can be used with building simulation tools is presented; it was generated using two, real datasets and shown to faithfully recreate the characteristics of charging seen in the monitored data. The model was used with a building simulation tool to assess the ability of rooftop PV with battery buffering to mitigate the effects of urban EV charging for a charging hub and car park in Glasgow, Scotland. The car park’s 200 kW PV array could fully-offset the demand of a fleet of approximately 50 vehicles. The addition of a small buffering battery (<100 kWh) significantly increased utilization of renewable energy, and reduced grid energy exchanges, but did little to mitigate peak demands.
Introduction
In common with the rest of the developed world, the nature of energy demand in the UK built environment is set to change radically, driven by the need to make our buildings more sustainable (Scottish Government Citation2021; UK Government Citation2019). This entails a transition away from fossil fuels for water and space heating, towards zero-carbon alternatives such as decarbonized grid electricity (CCC Citation2022). There is a parallel migration away from fossil-fuelled vehicles to more sustainable alternatives (DFT Citation2018), which has resulted in a rapid growth in electric vehicles (EVs) charged at home, dedicated charging hubs, or charge points at or near the workplace (Hardman et al. Citation2018). This nexus between electrified heating, and home or work-based vehicle charging means firstly, that transport loads are likely to become an intrinsic part of both domestic and non-domestic building electrical demands, and secondly, both peak electrical power demand and bulk demand for electricity in the built environment will increase substantially (e.g. Ramirez-Mendiola et al. Citation2022). Zou et al. (Citation2023) provide a comprehensive review of the potential impact of EV charging on the characteristics of built environment electrical demand, and on electrical infrastructure. As building simulation (BSim) tools are the de facto means of assessing energy use in the built environment, they should encompass workplace or home EV charging, allowing practitioners to assess the impact of the electrification of heat and mobility on building performance, at a range of scales. For example, at the building scale, characterizing EV charging demand will be required to properly size and orchestrate local, clean energy systems for Net Zero operation. At the city scale, predicting the impact of increased electrical demand from communities (from the electrification of heat, increased use of cooling and local vehicle charging) can inform energy networks planning and design, reducing the risk of demand outstripping the sustainable energy infrastructure needed to support it (Fowler, Elmhirst, and Richards Citation2018).
Review
There have been a many studies looking at buildings with integrated renewables and EV charging. Many papers have focused on individual dwellings, attempting to optimize charging schedules to minimize costs or reduced peak demands. For example, Molina et al. (Citation2012) developed a MATLAB model of a single EV connected to a building with a photovoltaic (PV) array, they used a neural network to optimize charging and discharging. The authors concluded that the potential for cost savings was minimal under time-of-use-pricing, and do not report on the potential for greenhouse gas savings. Kelly, Samuel, and Hand (Citation2015) modelled a building with PV supported EV charging with a heat pump, using the ESP-r building simulation tool (ESRU Citation2023) to investigate co-ordination strategies between EV charging and heat pump operation. The EV charging model was derived from travel survey data. The results indicated that operating the EV battery in vehicle-to-home (V2H) mode (i.e. allowing some limited discharging to support heat pump operation) and off-peak heat pump operation was the best co-operative strategy to limit peak electrical demand. Doroudchi et al. (Citation2018) used a linear programming approach to optimize the operation of a Net Zero single family house modelled in IDA-ICE (Equa Simulation Ltd. Citation2023), the study included rooftop PV, a stationary battery and an EV. The EV demand was calculated by a probabilistic approach using information from Finnish travel survey data. The study looked at the use of the EV for vehicle-to-home charging/discharging for a heat pump and district-heat case, the work showed that V2H operation reduced the power imported and exported to the network. Svetozarevic et al. (Citation2022) used agent-based control with machine learning, trained offline using historical performance data, to mimimise the cost and maximize comfort associated with a real test dwelling heated by a heat pump and with a ‘vehicle’ capable of bi-directional charging; the vehicle was emulated by a stationary battery in their experiments. The authors demonstrated the potential for both cost savings and comfort improvements.
There are also studies looking at workplace, or domestic charging of multiple EVs, often supported using photovoltaic arrays. In an early US study, Birnie (Citation2009) undertook some high-level modelling, indicating that for commuters in the north-eastern USA, the energy produced by 15 m2 of PV could entirely offset the energy required for commutes of 15–30 km, with plug-in hybrid electric vehicles. Mouli, Bauer, and Zeman (Citation2016) analysed the performance of a small PV system (10 kWp), supporting the charging of up to 3 EVs in the Netherlands. The EV charge taken was assumed to be a fixed 10 kWh, though various charging profiles are analysed; the use of a small 10 kWh battery was seen to significantly reduce energy drawn from the grid. Tulpule et al. (Citation2013) analysed a 100 kW PV array supporting up to 50 electric vehicles in different US cities along with the use of smart charging control. They demonstrated a significant reduction in CO2 emissions. Chaudhari et al. (Citation2018), utilized a linear programming approach in a least cost optimization of an EV charging hub in Singapore featuring PV and battery storage. The authors concluded that the use of PV plus storage could reduce the average and peak power demand from EV charging. Yan, Zhang, and Kezunovic (Citation2019) use a multi-stage optimization algorithm (comprising day-ahead, hour-ahead, and real time components) to optimize the charging of a fleet of EVs with PV-supported EV charging and a battery. The study focused on the optimization of costs. Both the PV generation and EV behaviour used probabilistic models. The paper concluded that hour-ahead optimization had the greatest effect on performance in terms of reducing the cost associated with charging. Wang et al. (Citation2019) investigated accuracy in short term forecasting of solar availability and smart charge scheduling for workplace PV-supported charging of around 30 EVs. The objective of the smart charge scheduling was to flatten EV charging demand and reduce charging variability, however the authors concluded that typical weather forecast errors were a barrier to optimization. The paper used a probabilistic vehicle charging model, featuring varying vehicle arrival, lay-over and charging requirements. However, none of the parameters used in the model were linked to references. Huang et al. (Citation2022a) used a generic algorithm in an attempt to optimize the home charging on a small fleet of vehicles. The vehicle charging model was probabilistic with its characteristics derived from wider transport survey data. The electric demands and PV generation were calculated using dedicated models. The paper tested different charging control strategies, with the authors indicating a top-down strategy yielded the best results in terms of self-consumption of PV and minimization of peak power flows to and from the network. Using an EV-centric charging model, that was developed from Swedish travel data. Huang et al. (Citation2022b) also investigate the impact of smart charging on vehicle batteries, with their modelling work indicating that smart charging reduces peak demand without significant impacts on battery performance, bidirectional charging increased battery degradation. Fachrizal et al. (Citation2022) presented metrics for assessing workplace PV with EV charging based on self-sufficiency and self-consumption. The study indicated that smart charging significantly improved both self-sufficiency and self-consumption. Park et al. (Citation2023) used EnergyPlus (EnergyPlus Citation2023) along with machine learning to try and optimize PV-supported EV charging at the community scale. The machine learning algorithm was trained using real charging data, though the details of this data were not elaborated on. The model was used to try and optimize the design of the overall energy system to accommodate EV charging. Korkas et al. (Citation2022) described a dynamic programming approach to optimize a building-PV-EV-storage system with building loads modelled using EnergyPlus (ibid), comparing a range of different algorithms and their ability to minimize global costs, whilst maximizing building thermal performance. The work tested the optimization concept and did not apply the modelling approach to a realistic problem.
Many of the vehicle charging models in the papers outlined use travel survey data. Pareschi et al. (Citation2020) tested the ability of EV models, created using travel survey data, to predict charging behaviour, concluding that this approach enables realistic charging profiles to be developed, the reported R2 correlation with real data 0.83, though this dropped to 0.7 when situations modelled differed markedly from the input data.
Aim
The aim of this work was to develop a rules-based, statistical model of EV charging demand that can be generated and re-calibrated as required using real EV charging data (in contrast to models developed using travel survey data, seen frequently in the literature), and which produces time-series, synthetic charging data for use in building simulation studies; alternatively, the model could be integrated directly into building simulation tools. The supporting objectives were to analyse a substantial EV charging dataset; develop and calibrate a probabilistic EV charging model, develop a building simulation model and complementary electrical load flow model of a real EV charging hub from Glasgow, Scotland, and apply the models in combination to assess the ability of PV and battery buffering to mitigate come of the impacts of vehicle charging, making it more sustainable.
Contributions
Statistical analysis of EV charging datasets.
A generic, statistical, vehicle-centric EV charging model is developed and presented, that can be calibrated using charging data.
The model was applied, along with a building simulation tool, to a case-study in the city of Glasgow, Scotland.
Dataset analysis and EV charging model development
Two datasets were used in the development of the electric vehicle (EV) charging model. The first was a data set from Transport Scotland, which comprised a record of 754,200 vehicle charging events in Scotland over the period 2013–2017. The dataset included the information shown in Table .
Table 1. Data headers from Transport Scotland EV charging dataset.
A total of 547,321 entries were used in the development of the model. Of the remaining charging events, 87,821 were data entries with no charging data, and 42,544 data entries had anomalous or unrepresentative data (negative duration, e.g. durations exceeding 24 h, charging events of less than 0.1 kWh). Additionally, 76,508 data entries were for taxis, of which 76,126 related to one firm. All of these entries were removed from the calibration dataset.
A second, smaller dataset acquired from the City of Glasgow comprised 2,556 public charging events from 2022, and the data captured is shown in Table . In this second dataset, 500 charges had a charge energy of 0 kWh and these were removed.
Table 2. Data headers from the City of Glasgow EV charging dataset.
Developing a probabalistic EV charging model
The datasets were used to generate a statistical vehicle charging model that captured the inherent variability in charging behaviour seen real charging, and which could be applied to different scales of vehicle charging demand.Footnote1 Three key charging characteristics were generated.
Firstly, the transport Scotland dataset was used to create a weekly charging frequency cumulative distribution function (CDF): used to derive a daily charging probability and hence test whether a vehicle would charge on a particular day.
Secondly, the same dataset was used to create a charging start time CDF: used to determine when in the day a vehicle would begin to charge.
Thirdly, the City of Glasgow dataset was used to create a charge taken CDF: used to determine the energy taken during a specific charge event and charging time.
Creation of the charge taken CDF using this more recent, but smaller dataset was necessary as the electric vehicle market has evolved rapidly, with vehicle battery capacities increasing and a move from hybrid electric vehicles such as the Mitsubishi Outlander with small battery capacity of 12 kWh (Kane Citation2017), to full electric vehicles such as the Tesla Model 3 with a battery capacity of 57.5 kWh (Kane Citation2022). Hence, charge requirements have increased rapidly; for example, the average charge taken in the 2022 City of Glasgow dataset was 20.97 kWh, whilst the average charge taken in the older Transport Scotland dataset (2013–2017) was only 8.5 kWh. The characteristics of the timing of charge events were similar between the two datasets.
Weekly charging CDF and daily charging probability
Individual vehicles were identifiable in the Transport Scotland dataset (via a unique User ID shown in Table ) and the characteristics of their weekly charging behaviour was used to generate the cumulative distribution function () of vehicle weekly charging frequencies shown in Figure .
Figure 1. Probability and cumulative probability of weekly vehicle charging frequency, , derived from the transport Scotland dataset.
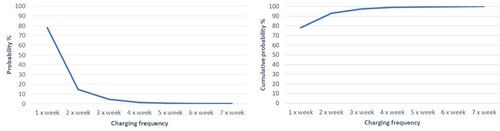
The probability that a vehicle would have a particular charging frequency was calculated as follows.
(1)
(1) Also,
(2)
(2) Figure shows that most vehicles charged only once or less per week at a public charge point. The data showed very little seasonal variation in charging frequency, so seasonality is not considered as a factor.
To calculate the weekly charging frequency, , of a vehicle,
, a random integer value
was tested against the cumulative density function,
, (shown in Figure ). The vehicle’s daily charging probability
was then set using Equation (3):
(3)
(3) However, the dataset indicated differences in the portion of charges,
, occurring on weekdays, Saturdays or Sundays, with 0.728 of vehicle charges occurring during weekdays, 0.161 on Saturdays and 0.111 on Sundays. The base daily charging probability
was therefore modified to account for these differences using Equations (4) and (5) (Table ).
(4)
(4) where
(5)
(5) The resulting modifiers for the base daily charge probability were as follows.
Table 3. Daily charging probability modifiers.
The calculated charging probability was persistent, so, a vehicle assigned a twice-weekly charging characteristic would charge (on average) twice-weekly over a simulated period. At an individual vehicle level, this would not reflect reality, as individual charging behaviour may vary wildly from week-to-week. But the role of the model was to predict the demand of a population of vehicles, so the realism of individual charging patterns was less relevant than the realism of the aggregate charging profile.
To test whether the vehicle, , charged on a particular day, a random value
was generated, and tested against
, such that.
(6)
(6)
Charging start time CDF
The charging datasets indicated that there was a clear difference in the timing of charging behaviour between weekdays and weekends (with Saturday and Sunday charging timings being very similar). The left-hand graph in Figure shows the probability of a time-dependent charging event starting, , for both weekends and weekdays; using the Transport Scotland dataset, the probability for charge events starting within half-hour time intervals during a day (differentiated by weekdays or weekends) was derived as follows.
(7)
(7) where
is a 30-min time interval in a day,
.
Figure 2. Probability distribution, and cumulative probability distributions,
of EV charging event starting for weekdays and weekends derived from the Transport Scotland dataset.
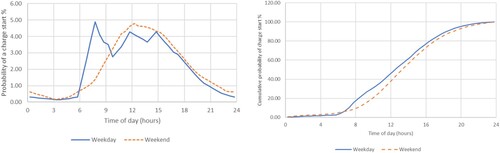
There was a peak in weekday charging between around 6–9 am, with less distinct peaks around midday and 4pm. This pattern of usage was consistent across all weekdays. Weekend charging peaked around midday, with a lower ramp up in the probability of a charging event. The morning peak in the probability of charging was entirely absent during weekends. The cumulative probability of a charge event starting, , is shown in the right-hand graph of Figure , where
(8)
(8) To determine the time at which a vehicle,
, would start charging on a particular day, a random value
was tested against
, over multiple time increments, with charging deemed to start within the 30-minute time interval
, where
(9)
(9)
Charge taken CDF
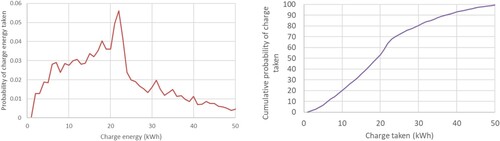
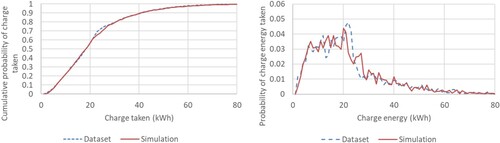
The left-hand graph in Figure shows the probability of a particular charge energy, , being taken,
, from the more recent City of Glasgow dataset, this is computed in a similar fashion to
.
(10)
(10) Here
, is the nearest integer of the charge taken, which showed a pronounced peak at around 22 kWh, and the largest charge seen was 85 kWh, hence
. The right-hand image in Figure shows the cumulative probability,
, of a discrete quantity of charge being taken:
(11)
(11) To determine the quantity of energy taken,
, by a vehicle,
, during particular a charge event, a random value
was generated and then tested against the cumulative distribution function
, so that
(12)
(12) Note that the charge taken does not distinguish between charger types, a refinement of the model, using future data, could include this differentiation between chargers.
Figure 3. The probability and cumulative probability
and off a particular charge being taken (kWh).
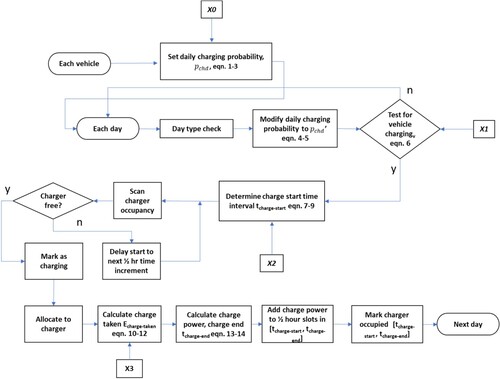
Charging algorithm
The algorithm for the computation of vehicle charging demand over a defined time interval is illustrated in Figure . For a user defined population of chargers and vehicles, using random variable , the algorithm firstly sets each vehicle’s day-type-dependent daily charging probability,
, as set out in Equations (1)–(5). The daily charging probability,
is then tested against random variable
to determine whether or not a vehicle charged on a particular day (Equation (6)). Random variable
is generated and used to test determine the charge start time as set out in Equations (7)–(9). The vehicle is then randomly allocated to a compatible charge point from the available chargers. If a compatible charge point is not available (i.e. all compatible chargers are occupied by a charging vehicle), then the start of charging for the vehicle is delayed until a compatible charger becomes available. Random variable
is then used to determine the charge taken according to Equations (10)–(12), and finally, the charging time is calculated by dividing the charge taken by the power of the charge point,
, that the vehicle is allocated to, so
(13)
(13)
(14)
(14) The average charge taken over a charging period will, typically, be less than indicated by
, and so the charge taken in the final time increment is adjusted to ensure that the charge taken is correct. The charging power for the vehicle is then added to the total charging power for the relevant half hour time increment
. All days in the user-defined time period being simulated are treated in this way. The process is repeated for each vehicle in the vehicle fleet, building up a complete charging profile for the user defined period, vehicle fleet and charger fleet being simulated.
Figure 4. Flow chart illustrating a vehicle-centric probability-based algorithm to calculate an aggregate charging profile.
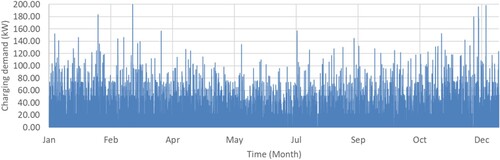
An example demand profile is shown in Figure , showing time-varying demand for a fleet of 80 EVs for a calendar year.
Figure 5. Example of demand profile for a fleet of 80 electric vehicles.
Model testing
The model’s ability to reproduce the intrinsic charging behaviour seen in the input datasets was tested (i.e. the degree of calibration). Figure , shows the time-dependent probability of a charge event occurring on weekdays and weekends for simulated data (80 vehicles) and from the original Transport Scotland dataset. The R2 correlation between probabilities derived from empirical and simulated data for the start of weekday charging is 0.991 and 0.981 for weekend charging. The weekday simulated dataset reproduces the surge in charging demand between 6 and 9am seen in the Transport Scotland dataset.
Figure 6. Simulated and monitored time-dependent charging probabilities.
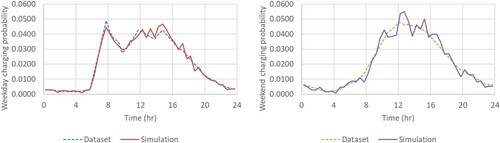
Figure shows the cumulative probability of a particular charge being taken during a charge event from both the same simulated data and the City of Glasgow charging dataset. The R2 correlation between the cumulative probabilities of charge taken from the simulation and dataset was 0.9996. The R2 correlation between simulated and dataset the probability curves for charge taken was 0.925.
Figure 7. Simulated and monitored cumulative probabilities of charge taken during a charge event.
Finally, Figure shows mean and standard deviation of the charge taken in charge events for the simulated and Glasgow dataset.
Figure 8. Mean charge taken and std. dev. of charge taken from dataset and simulation.
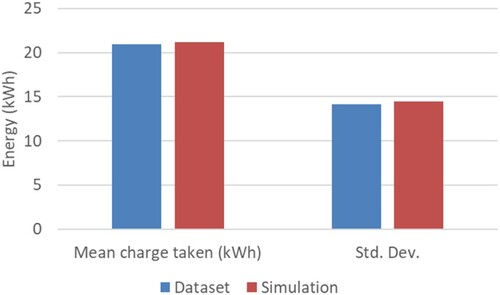
The tests highlighted demonstrate that the charging model can adequately recreate the charging characteristics of the original dataset.
Application – Glasgow car park EV charging
The EV charging algorithm, has been applied, along with the ESP-r building simulation tool (ESRU, ibid) to assess the performance of a prospective sustainable electric vehicle charging hub in Glasgow, Scotland, which features a rooftop photovoltaic array and a buffering battery. The hub is located at the Duke Street car park, close to Glasgow city centre and has 1170 parking spaces located over 9 floors. Given the space available, a PV rooftop array with a total surface area of 1250m2, and comprising 625 PV panels with a notional peak power output of 200 kWp was proposed (see Figure ).
Figure 9. Duke St car park (Image: Google street view) and rendered image of the ESP-r Duke St Car Park model with roof-mounted PV arrays and shading from surrounding buildings.

This investigation here system was undertaken as part of the EU-funded RUGGEDISED project (RUGGEDISED Citation2023).
This study assessed the ability of the PV with battery buffering, to mitigate some of the effects of unconstrained EV charging, examining the effects of different battery sizes and populations of vehicles using the hub. This approach differs from many of the papers in the literature, in that it does not include restrictions on charging times, or the potential for vehicle-to-grid (V2G) operation. However, it does feature a range of charging load levels and buffering battery sizes. The rationale is that (1) at least in the short-term, intelligent control of vehicle charging will lag the deployment of charging infrastructure and so the work here represents the analysis of a likely-near-term scenario. According to Zou et al. (Citation2023) uncoordinated charging accounts for the large majority of vehicle charges; (2) local, supply-side approaches to controlling EV charging impacts on the grid such as PV with batteries could be seen to be preferable to demand-side, time-based charge control for time-constrained users of public charge points; (3) constraining stochastic demand for power through control (intelligent-or-otherwise) can lead to unintended demand peaks, worsening the impact on the grid (e.g. Callaway Citation2009).
HUB model
The multi-tool approach was adopted to model the performance of the charging hub.
A model of the car park, including its 200 kWp roof-mounted PV array was created on ESP-r, which includes an electrical system modelling capability.
The EV charging algorithm calculated the electrical demand associated with different sizes of vehicles fleets, this data was used as boundary data for the load flow model.
A load flow model of the charging hub was developed, that included vehicle chargers, PV array, battery storage, grid connection and that featured the ability to apply a supportive battery operating strategy.
The load flow model computed the electrical power exchanges between PV array, charging hub, battery and the grid for a series of year-long scenarios, and metrics such as the renewable energy contribution, renewable utilization factor, energy exchanges with the grid and peak power flows extracted.
Building simulation model
The ESP-r model of the car park, featured a detailed model of the PV array on the car park roof (Figure ). When simulated, using real climate data (temperature, solar radiation, wind speed and direction and relative humidity) as a boundary condition over a user defined period (a year in this case), the transient energy and mass transfer processes occurring in the building were computed, solar insolation and temperature-sensitive PV output, etc; the work described here primarily used ESP-r’s solar energy and PV modelling capability (Kelly Citation1998); which have been validated by Strachan, Kokogiannakis, and Macdonald (Citation2008), Mottillo et al. (Citation2006), respectively. ESP-r’s PV algorithm computed the power output from the car park array, also factoring in the impact of self-shading and shading from surrounding buildings. It firstly calculated the operating voltage and current of a single PV cell as a function of the incident solar radiation and cell temperature. The results were then extrapolated to determine the operating state of the panel and hence the whole array, assuming all of the panels are of the same type and at the same orientation and tilt (Equations (12)–(16)).
(15)
(15) where
is given by:
(16)
(16) The cell generation current
is calculated by:
(17)
(17) The cell light generated current,
, is given by:
(18)
(18) The total array power output is given by:
(19)
(19) The input data for the PV model is shown in Table .
Table 4. Characteristics of the PV panels used in the analysis (Longi Citation2020).
ESP-r’s thermal solver computed the panel temperature , and the incident solar radiation intensity
, which included the effects of shading. So, for a layer,
, in a surface of the building containing the PV material, the heat balance equation was as follows.
(20)
(20) where
are the different heat fluxes associated with the layer, e.g. solar absorption, conduction from adjacent layers, convection, etc.
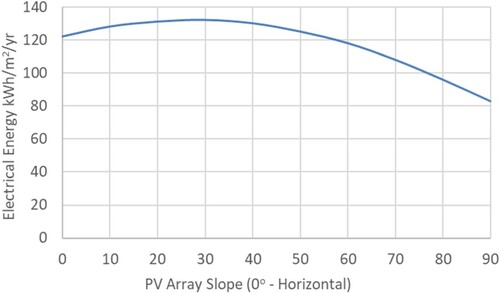
Figure shows the output from preliminary simulations of the PV array, showing notional yield per m2 in a Glasgow climate, indicating that 30o slope from the horizontal provided the maximum annual electrical energy output.
Figure 10. PV array annual energy yield vs slope.
The calculated PV power output using a test reference year for Glasgow is as shown in Figure .
Figure 11. Simulated car park half-hourly PV output.
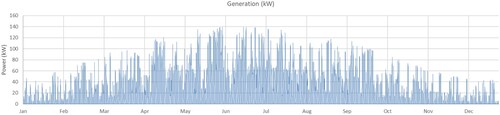
Although the array mounted on the car park roof had a notional output of 200 kWp, the simulated peak power produced was significantly less than this at 139 kW. The reasons for this are that the peak incident solar radiation on the PV arrays of 808.9 W/m2 on the PV was less than that used by manufacturers in tests to determine the notional power output; the peak insolated panel temperature of 64.0°C was higher than the temperature used in the tests of 25°C, further reducing operating efficiency; and the model also included power converter inefficiencies (∼10%). This reduction in in-situ performance compared to manufacturers’ tests has been noted elsewhere e.g. (Clarke et al. Citation1996).
The car park model also accounted for the lighting loads for the car park bays, stairwells and a small office along with 500 W of load for the office IT. There were some 520 light fittings each with a full power demand of 58 W, dimmable to 12 W (GCC Citation2018), which were subject to daylighting and occupancy sensitive controls control. Daylighting control allowed 25% of lights to be switched off when daylight levels were suitable (computed by ESP-r). Further, occupancy control temporarily increased the light output of 3 light fittings from the default (dimmed state) in the immediate vicinity of vehicles to full power (GCC Citation2018); this used the vehicle charging data from the charging algorithm to estimate vehicle presence and the dynamic changes in lighting demand.
Charging hub electrical model
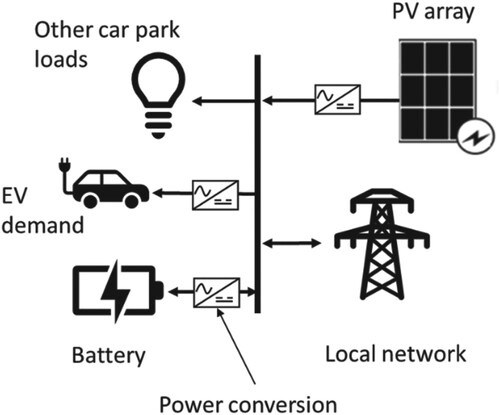
To assess the interaction between the PV, battery, charging load and the network, an electrical load flow model was created as shown in Figure . This integrates the other model components: PV array, EV charging demand, other car park electrical loads, and also includes the buffering battery and connection to the local low voltage (LV) grid. The battery, PV array and charging hubs are all connected via converters to a common AC busbar, and the battery and grid connection are bi-directional. The battery can reconcile short term-temporal mismatches between the availability of PV-generated electricity and vehicle charging.
Figure 12. Car park charging hub electrical load flow model.
The basic equation for the determining power exchanged between the different elements of Figure was as follows.
(21)
(21) where
is the power exchanged with the low voltage grid (LV), so the system can either import or export power when the battery PV cannot support charging or export power when the battery is full and PV output exceeds charging demand. The battery state of charge was determined as follows.
(22)
(22)
(23)
(23) The battery power flow,
, was determined by the battery operating strategy.Footnote2 If there was available energy from the PV, and the total demand (vehicle charging demand and other electrical loads),
, was less than the PV generation,
, then the battery charged. Where the PV output power exceeded the battery’s maximum charging rate, then the surplus was spilled to the grid. If there was energy available from the PV, but this was less than the total demand, the battery discharged to help meet the demand – if there was sufficient charge in the battery. Only where the PV and battery output were insufficient to meet the demand, was power drawn from the grid (Table ).
(24)
(24) The fleet of chargers at the hub is shown in Table .
Table 5. Battery parameters used with the model (GCC Citation2018).
Table 6. Charger ‘fleet’ used with the model (ChargePlace Scotland Citation2023).
Simulation methodology
To assess the impact that the numbers of EVs using the hub and the battery size had on performance, the following parameters were explored:
the vehicles supported by the hub were varied between 0 and 500; the car park has 1170 spaces. With an average occupancy of 82% City Parking Glasgow (Citation2015), 500 EVs represents approximately half of all vehicles frequenting the car park; a scenario not likely to occur until the late 2030s, given current projections (Hirst Citation2020).
the battery size was varied between 0 and 500 kWh; the upper value is sufficient to store the typical daily electrical output from the PV array, after vehicle charging.
In total, 90 operating cases were analysed. As an objective was to assess peak power flows, no limits were set on the power that could be drawn from or exported to the network and the power that could be accepted by or discharged from the battery.
The basic process for the simulation of the car park operating cases was as follows.
Stage 1 The vehicle charging model (Equations (1)–(14)) was run to determine the half-hourly electrical demand profiles for 10, 20, 50, 100, 200, and 500 vehicles using the car park.
Stage 2 Annual ESP-r building simulations were then run with Glasgow climate data and each of the EV demand profiles to determine the PV output at half-hourly intervals (Equations (15)–(20)), and the occupancy and daylight sensitive lighting loads for the car park.
Stage 3 The car park electrical load flow model (featuring the battery) was run for all operating cases using the demand profiles from stage 1, the PV generation and lighting/small power loads from 2; solving Equations (21)–(24), enabled the battery state, battery charge/discharge and the import/export with the grid to be computed at half-hourly intervals.
Note, for each case analysed with the load flow model, performance was simulated over two calendar years using two-year-long time series, comprising duplicated annual profiles of PV output, EV demand and lighting/SPL demand. The first year of data was used for pre-simulation, and only the second year’s data was used in the analysis. This ensured that the starting SOC of the battery at the beginning of the simulated period was based on calculated values and not a guesstimate, as for larger battery sizes, the starting SOC had an impact on the annual results.
The metrics derived from each operating case were as follows.
The fraction of hub electrical load that was supplied by the PV – the renewable energy contribution (REC), and a complimentary metric the renewable utilization fraction (RUF). The higher value of REC and RUF, the more local, zero-carbon electricity is being used to charge vehicles and power the car park loads, rather than being drawn from the grid.
The energy exchanges with the grid – this information was used to calculate the carbon emissions associated with the charging hub.
The peak power imported or exported to the electricity network – the latter has an impact on the viability of the EV charging hub scheme, as higher the peak power flows require a larger investment in infrastructure to support charging and may require that the surrounding network is reinforced.
The state of charge (SOC) and power flows associated with the battery – this is useful in determining a best-fit battery size to support EV charging and understanding the characteristics of electrical power and energy exchanges with the network.
Results and discussion
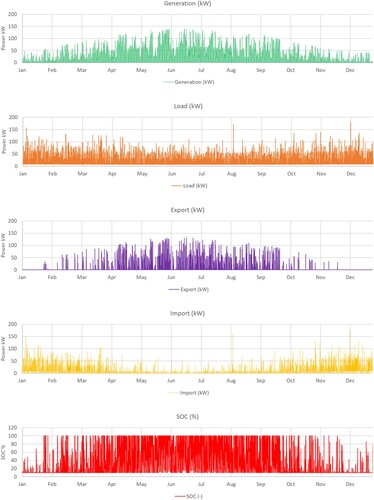
Figure illustrates the basic time series outputs from the model for the case of a fleet of 50 vehicles serviced by the hub, with a 100 kWh battery. It shows the PV generation and EV charging load, exported and imported power, and the battery SOC respectively, for one simulated year. The data highlights the strong seasonality of PV generation in a Glasgow climate, with relatively little power production in the winter months; this is reflected in the export of energy to the grid occurring mainly between mid-February to October. Import of energy occurs throughout the year (but reduces April – October), when solar and stored energy in the battery is not sufficient to support charging. The battery state of charge (SOC) is regularly at 100% April to October, but drops over the winter period.
Figure 13. Example of time series output from the simulation, for the case with 50 vehicles and 100 kWh battery.
Overall energy supply and demand
The total annual energy from the PV array, after conversion and shading losses was approximately 159 MWh. The non-EV demand was approximately 78 MWh. The total simulated demand for the different numbers of vehicles using the charging hub is as shown in Table .
Table 7. Annual simulated electrical demand with different numbers of vehicles using the huba.
The net demand of the car park with a clientele of just over 50 EVs could be fully offset by the 200 kWp PV array of the car park.
Renewable energy contribution and renewable utilization fraction
These metrics show the contribution of renewable energy to the overall demand of the hub, and the amount of renewable energy from the PV array that was used to meet local needs, respectively. The renewable energy contribution was calculated as follows:
(25)
(25) And the renewable utilization fraction (RUF) was calculated using:
(26)
(26) Figure shows the REC and RUF, for vehicle numbers between 10 and 500 and battery sizes between 0 and 500 kWh. The REC decreased with increasing numbers of vehicles. The maximum possible REC was 80% with 10 vehicles, dropping to under 20% with 500 vehicles. Increasing battery size generally increased the REC, but for the 500-vehicle case, increasing battery size made a minimal difference. The RUF increased as the loading from vehicles increased. At lower vehicle loadings, the RUF also increased with battery size, due to reduced export of power to the electricity network.
Figure 14. REC and RUF (expressed as a %) for different supporting battery sizes and vehicle fleets.
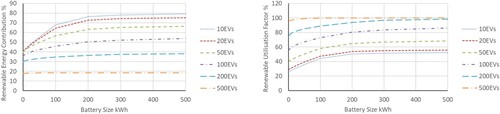
The addition of a relatively small battery (less than 100 kWh), significantly improved the RUF, the localized use of the PV generated power. For example, with 10 EVs using the hub, the RUF was approximately 26% with no battery, rising to 47% with a 100-kWh battery.
Adding additional battery capacity above approximately 100 kWh, resulted in more marginal improvements in performance. For example, for the same EV case with a 100 kWh and 500 kWh supporting battery capacity, the RUF only increased from 47% to 55%.
Import and export of electricity
The annual electrical energy imported from the grid to support the hub is shown in Figure , the numbers of vehicles using the hub dominated this metric. For example, for the 10-vehicle case with no battery, over 57 MWh of imported electricity was required, whilst with 500 vehicles over 666 MWh of electricity was imported. For smaller numbers of vehicles using the hub, a relatively small battery size of less than 100 kWh made a significant reduction to imported energy. For example, with 50 vehicles using the hub, the electrical energy imported from the grid to support charging was some 91 MWh with no battery. A 50 kWh battery reduced the electricity imported to approximately 75 MWh.
Figure 15. Imported electrical energy against battery size for different vehicle fleets.
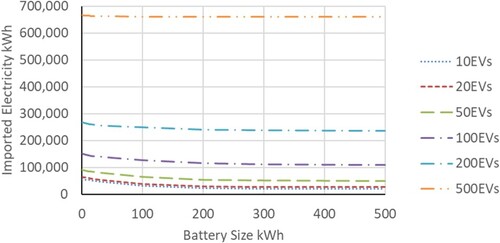
Figure shows that the peak imported electrical power was only sensitive to battery size where small numbers of vehicles were serviced by the hub. Above 50 EVs, the sensitivity was minimal. The principal reason for this insensitivity was that the peak power drawn was in mid-winter when the PV contribution to charging was minimal. Consequently, the magnitude of power drawn was mainly a function of the numbers of vehicles charging simultaneously.
Figure 16. Peak imported power against battery size for different vehicle fleets.
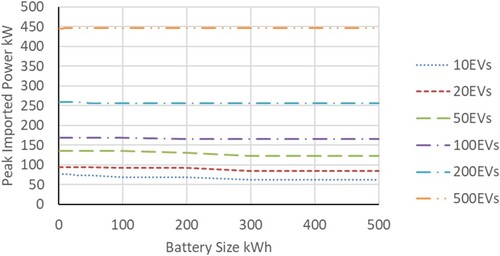
At lower vehicle loads (< 50 vehicles) and larger battery sizes, the stored PV energy was enough to supply some of the vehicle charging demand throughout the year, and the peak imported electrical power and energy, were reduced.
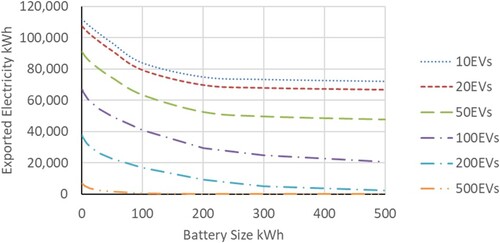
Exported electrical energy (Figure ) was very dependent on vehicle numbers, it reduced with increasing load from EVs. For smaller vehicle numbers (<50EVs). For a given vehicle load the annual exported energy reduced markedly for battery sizes between 1 and 100 kWh and was then relatively insensitive to increasing battery size. For example, with 20 vehicles using the hub, the electrical energy exported to the network was 107 MWh without a supporting battery; this dropped to 79 MWh with a battery capacity of 100 kWh and 66 MWh with a battery capacity of 500 kWh. For 100 and 200 vehicles the drop in exported energy continued as battery size increased. With 500 vehicles, there was no export of energy above battery sizes of 100 kWh.
Figure 17. Exported electrical energy against battery size for different vehicle fleets.
Peak exported power was little affected by battery buffering for cases below 200 vehicles. With 200 and 500 vehicles, the peak demand dropped as battery size increased (Figure ).
Figure 18. Peak exported electrical power against battery size for different vehicle fleets.
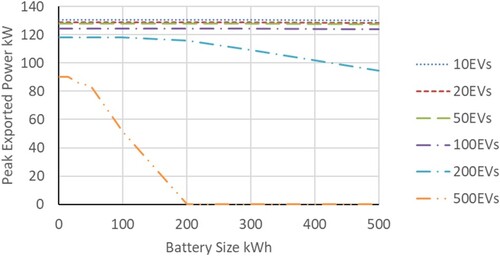
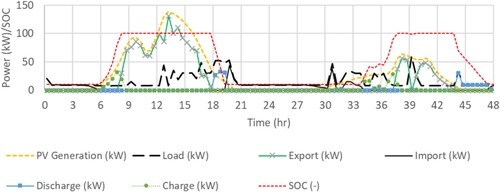
The reason for this drop in peak export power with larger battery capacities and vehicle numbers was that with this large number of vehicle charges, the battery generally had a low SOC (Figure ), so surplus power was used primarily to charge vehicles directly, with a limited surplus available to charge the battery, but not to full capacity. For battery capacities below 200 kWh and smaller numbers of vehicles using the hub, the peak exported power was largely dictated by the output from the fixed-size PV array as peak exported power occurred in summer, when the battery was close to full SOC and vehicle charging demand was low (Figure ).
Figure 19. Simulated variation in PV output, vehicle demand, battery SOC, power export and import on 20/21 June for the case with 500 vehicles and 500 kWh battery.
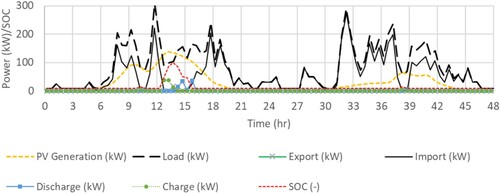
Figure 20. Simulated variation in PV output, vehicle demand, battery SOC, power export and import on 20/21 June for the case with 50 vehicles and 50 kWh battery.
Battery state of charge (SOC)
The battery average state of charge (SOC) over the simulated period was primarily dictated by the number of vehicles using the hub. For example, with 10 EVs, the average SOC for a 100 kWh battery was approximately 45%. Whilst with 200 EVs, the average SOC for the same battery dropped to around 19% (Figure ).
Figure 21. Average battery state of charge (expressed as a %) against battery size for different vehicle fleets.
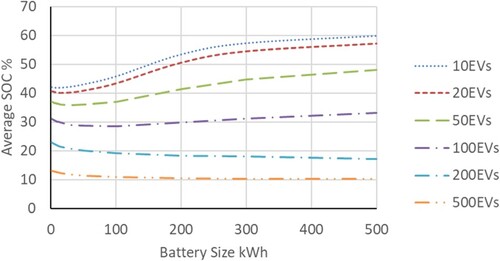
The average SOC (for a given number of vehicles) was sensitive to small battery capacities (smaller than 10 kWh) and relatively insensitive with battery capacities above 200 kWh. At lower vehicle loadings, below 100 EVs, average SOC initially dropped for small battery capacities (<10 kWh) then rose with increasing battery size to a near-stable value.
Carbon emissions
The carbon emissions associated with the hub are shown in Figure . These were calculated by firstly considering the electrical energy imported (kWh) from the grid by the charging hub at each time increment
. The carbon emissions associated with vehicle charging are therefore:
(27)
(27) To account for the temporal variability in charging demand and of UK electricity carbon intensity (i.e. peak vehicle charging at times of higher carbon intensity of grid electricity) a time varying grid carbon intensity
was applied, rather than the average intensity. This was determined for every hour of the simulated year using data on the UK generating mix from Elexon (Citation2021) and carbon intensity data on different generation types (Staffell Citation2017).
(28)
(28) where
is the contribution of generator type
at time
and
is its associated carbon intensity (kg/kWh).
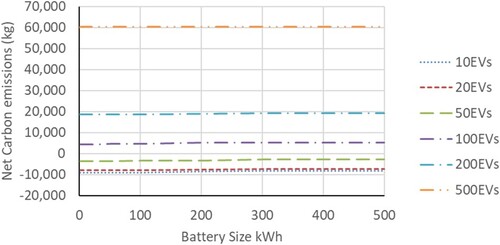
Figure 22. Net carbon emissions due to use of PV and battery against battery size for different vehicle fleets.
Secondly, the carbon offset from PV export ( kWh) to the grid, was calculated as follows.
(29)
(29) The total, net carbon emissions associated with charging are therefore calculated as follows.
(30)
(30) The net emissions were dictated by the number of vehicles serviced by the hub. Below 50 vehicles, the net carbon emissions are approximately zero or negative, indicating that the PV canopy offsets more carbon than is associated with charging. However, above this number of vehicles serviced, the PV generation cannot offset charging and net emissions turn positive. The size of the supporting battery makes little difference to the results.
Final comments
There are some caveats regarding these results and their interpretation.
The data used to generate the EV charging model characteristics (the CDFs, daily charging modifier, etc.) was based on the use of charge points in Scotland. However, if the model is applied to other countries then re-calibration using local data would need to be undertaken, and the veracity of the output tested against, preferably, and independent dataset.
The data sets used was collected from free-to-use public charge points. Imposing a cost for charging could result in different in charging behaviour, compared to that modelled in this paper, e.g. more use of home charging and less frequent use of public charge points, and this would impact the results.
It was assumed that there would be unrestricted access to charge points for all vehicles using the hub and consequently no queuing. The EV charging algorithm also tracked occupancy of charge points and analysis of this information indicated that even with 500 vehicles using the hub, there was no charge point congestion. However, this assumes that access to the charging point was is freed up at the end of the charging period, with no charge point ‘hogging’ (Milukic, Citationn.d.). If significant charge point congestion were to occur, as EV popularity increases, then the shape of the demand profiles would change from those generated for this exercise.
Charging was assumed to occur at full power until the final time interval of the charge, when the charging power was reduced. In reality, tapering of the charge delivered to a vehicle is likely to occur well before the end of charging and so the calculation of the charge delivered to the vehicle should be refined in future iterations of the model.
The simulations reported here only tested the battery operating in buffer mode (absorbing surplus power from the PV). Other strategies such as overnight top-up and peak shaving remain to be tested with this model.
Lastly, the carbon savings presented are based on 2021 UK emissions data (Elexon Citation2021). The UK electricity system is in a rapid state of decarbonization. Consequently, as the carbon intensity of grid electricity decreases, so the savings associated with PV supported charging will decrease.
Conclusions
This paper has described the development of a statistical electric vehicle (EV) charging model, its application to assess the value of a car-park-based photovoltaic (PV) array with battery to support vehicle charging at a proposed EV charging hub in Glasgow, Scotland.
Over 90 use cases were analysed, where the battery capacity (kWh) was varied between 0 and 500 kWh and the number of vehicles using the hub varied between 0 and 500.
The peak simulated PV power output for the car park array of 139 kW was significantly less than the installed PV capacity of 200 kWp. PV output was strongly seasonal with little useful power output in the winter months and a surfeit of power (for most of the cases modelled) in summer.
The renewable energy contribution (REC), renewable utilization fraction (RUF) and energy exchanges with the grid were primarily dictated by the number of EVs using the hub.
The simulation results indicated that a relatively small battery capacity (100 kWh or less) made a significant difference to the REC and RUF, and reduced energy exchanges with the grid.
The impact of the PV and battery on peak imported power was marginal. With less than 50 vehicles, peak power imports from the grid reduced slightly with increasing battery size, but above this number of vehicles, the battery size had a minimal effect and the peak was dictated by the number of vehicles charging.
Peak exported power reduced with battery size if more than 200 vehicles used the hub, but below this load level the number of vehicles and battery size made minimal difference. Instead, the peak power exported was dictated by the size of the installed PV array.
The hub was carbon neutral or carbon positive when servicing less than 50 vehicles, as the exported PV electrical energy offset the electrical energy used for EV charging.
Nomenclature
Table
Acknowledgements
The work reported in this paper was done as part of the RUGGEDISED EU H2020 project. The authors gratefully acknowledge the funding provided by the EU under Grant agreement 731198. The authors also gratefully acknowledge the help and assistance of Transport Scotland, Glasgow City Council and other RUGGEDISED partners in providing the monitored data and design information on which this paper was based.
Disclosure statement
No potential conflict of interest was reported by the author(s).
Data availability statement
The data and modelling tools that support the findings of this study are available from DOI: 10.15129/21b5782d-a229-42f9-8f17-1f9a60f91197.
Additional information
Funding
Notes
1 It should be noted that individual driver behaviours would likely be very different for those predicted by the model and so the model not suitable for the purpose of modelling individual vehicle behaviour.
2 Note that other battery operating strategies are can be tested with the model including overnight top-up and peak demand shaving, however only the battery operating in a buffering capacity is assessed here.
References
- Birnie, D. P., III. 2009. “Solar-to-vehicle (S2V) Systems for Powering Commuters of the Future.” Journal of Power Sources 186 (2): 539–542. https://doi.org/10.1016/j.jpowsour.2008.09.118.
- Callaway, D. 2009. “Tapping the Energy Storage Potential in Electric Loads to Deliver Load Following and Regulation, with Application to Wind Energy.” Energy Conversion and Management 50 (5): 1389–1400. https://doi.org/10.1016/j.enconman.2008.12.012.
- CCC (Committee on Climate Change). 2022. Progress in Reducing Emissions – 2022 Report to Parliament. London: Climate Change Committee. Accessed February 2, 2023. https://www.theccc.org.uk/publication/2022-progress-report-to-parliament/.
- ChargePlace Scotland. 2023. “ChargePlace Scotland Live Map, App.” ChargePlace Scotland live map – Charge Place Scotland. Accessed March 1, 2023.
- Chaudhari, K., A. Ukil, K. N. Kumar, U. Manandhar, and S. K. Kollimalla. 2018. “Hybrid Optimization for Economic Deployment of ESS in PV-Integrated EV Charging Stations.” IEEE Transactions on Industrial Informatics 14 (1): 106–116. https://doi.org/10.1109/TII.2017.2713481.
- City Parking Glasgow. 2015. “Operational performance Quarter 3.” Report to Glasgow City Council. Accessed May 29, 2020. http://www.glasgow.gov.uk/Councillorsandcommittees/viewSelectedDocument.asp?c=P62AFQUTZ3UTT1NT.
- Clarke, J. A., J. W. Hand, C. M. Johnstone, N. Kelly, and P. A. Strachan. 1996. “Photovoltaic-integrated Building Facades.” Renewable Energy 8 (1-4): 475–479. https://doi.org/10.1016/0960-1481(96)88902-6.
- DFT (Department for Transport). 2018. “The Road to Zero – Next Steps towards Cleaner Road Transport and Delivering our Industrial Strategy.” DFT Report. London.
- Doroudchi, E., K. Alanne, Ö Okur, J. Kyyrä, and M. Lehtonen. 2018. “Approaching net Zero Energy Housing Through Integrated EV.” Sustainable Cities and Society 38: 534–542. https://doi.org/10.1016/j.scs.2018.01.042.
- Elexon. 2021. “Balancing Market Data.” Accessed May 28, 2022. https://www.bmreports.com/.
- Energy Plus. 2023. “Software.” Accessed March 29, 2023. https://energyplus.net/.
- Equa Simulation Ltd. 2023. "EQUA simulation software", https://www.equa.se/en/.
- ESRU (Energy Systems Research Unit). 2023. “ESP-r Software.” Accessed February 28, 2023. http://www.esru.strath.ac.uk/applications/esp-r/.
- Fachrizal, R., M. Shepero, M. Åberg, and J. Munkhammar. 2022. “Optimal PV-EV Sizing at Solar Powered Workplace Charging Stations with Smart Charging Schemes Considering Self-Consumption and Self-Sufficiency Balance.” Applied Energy 307: 118139. https://doi.org/10.1016/j.apenergy.2021.118139.
- Fowler, R., O. Elmhirst, and J. Richards. 2018. “Electrification in the United Kingdom: A Case Study Based on Future Energy Scenarios.” IEEE Power and Energy Magazine 16 (4): 48–57. https://doi.org/10.1109/MPE.2018.2822864.
- GCC (Glasgow City Council). 2018. “Specifications for the Duke St Car Park PV Canopy.” Glasgow City Council Project Report.
- Hardman, S., A. Jenn, G. Tal, J. Axsen, G. Beard, N. Daina, Erik Figenbaum, et al. 2018. “A Review of Consumer Preferences of and Interactions with Electric Vehicle Charging Infrastructure.” Transportation Research Part D: Transport and Environment 62: 508–523. https://doi.org/10.1016/j.trd.2018.04.002.
- Hirst, D. 2020. “Electric Vehicles and Infrastructure, House of Commons Library.” Briefing Paper 7480.
- Huang, P., J. Munkhammar, R. Fachrizal, M. Lovati, X. Zhang, and Y. Sun. 2022a. “Comparative Studies of EV Fleet Smart Charging Approaches for Demand Response in Solar-Powered Building Communities.” Sustainable Cities and Society 85: 104094. https://doi.org/10.1016/j.scs.2022.104094.
- Huang, P., R. Tu, X. Zhang, M. Han, Y. Sun, S. A. Hussain, and L. Zhang. 2022b. “Investigation of Electric Vehicle Smart Charging Characteristics on the Power Regulation Performance in Solar Powered Building Communities and Battery Degradation in Sweden.” Journal of Energy Storage 56: 105907. https://doi.org/10.1016/j.est.2022.105907.
- Kane, M. 2017. “2017 Mitsubishi Outlander PHEV Gets Performance Upgrade, Slightly More Range.” Inside EVs, Online Article. Accessed December 18, 2022. https://insideevs.com/news/331933/2017-mitsubishi-outlander-phev-gets-performance-upgrade-slightly-more-range/.
- Kane, M. 2022. “New Tesla Model 3 RWD (LFP 60 kWh) Gets Remarkable Winter Range.” Inside EVs Online Article. Accessed March 24, 2023. https://insideevs.com/news/563125/tesla-model3-60kwh-winter-range/.
- Kelly, N. J. 1998. “Towards a Design Environment for Building-Integrated Energy Systems: The Integration of Electrical Power Flow Modelling with Building Simulation.” PhD thesis, University of Strathclyde.
- Kelly, N., A. Samuel, and J. Hand. 2015. “Testing Integrated Electric Vehicle Charging and Domestic Heating Strategies for Future UK Housing.” Energy and Buildings 105: 377–392. https://doi.org/10.1016/j.enbuild.2015.07.044.
- Korkas, C. D., M. Terzopoulos, C. Tsaknakis, and E. B. Kosmatopoulos. 2022. “Nearly Optimal Demand Side Management for Energy, Thermal, EV and Storage Loads: An Approximate Dynamic Programming Approach for Smarter Buildings.” Energy and Buildings 255: 111676. https://doi.org/10.1016/j.enbuild.2021.111676.
- Longi Solar Ltd. 2020. Datasheet, LR4-72 HPH 455 M G2.
- Milukic, M. G. n.d. “How to Solve Hogging and ICEing Issues at EV Charging Stations in the UK.” Online Article, British Parking Association. Accessed December 20, 2022. https://www.britishparking-media.co.uk/blogs/guest-post-how-to-solve-hogging-and-iceing-issues-at-ev-charging-stations-in-the-uk.
- Molina, D., C. Hubbard, C. Lu, R. Turner, and R. Harley. 2012. “Optimal EV Charge-discharge Schedule in Smart Residential Buildings.” In IEEE Power and Energy Society Conference and Exposition in Africa: Intelligent Grid Integration of Renewable Energy Resources (PowerAfrica), Johannesburg, 1–8. IEEE.
- Mottillo, M., I. Beausoleil-Morrison, L. Couture, and Y. Poissant. 2006. “A Comparison and Validation of Two Photovoltaic Models.” Canadian solar buildings conference, Montreal.
- Mouli, G. C., P. Bauer, and M. Zeman. 2016. “System Design for a Solar Powered Electric Vehicle Charging Station for Workplaces.” Applied Energy 168: 434–443. https://doi.org/10.1016/j.apenergy.2016.01.110.
- Pareschi, G., L. Küng, G. Georges, and K. Boulouchos. 2020. “Are Travel Surveys a Good Basis for EV Models? Validation of Simulated Charging Profiles Against Empirical Data.” Applied Energy 275: 115318. https://doi.org/10.1016/j.apenergy.2020.115318.
- Park, M., Z. Wang, L. Li, and X. Wang. 2023. “Multi-objective Building Energy System Optimization Considering EV Infrastructure.” Applied Energy 332: 120504. https://doi.org/10.1016/j.apenergy.2022.120504.
- Ramirez-Mendiola, J. L., G. Mattioli, J. Anable, and J. Torriti. 2022. “I'm Coming Home (to Charge): The Relation Between Commuting Practices and Peak Energy Demand in the United Kingdom.” Energy Research & Social Science 88: 102502. https://doi.org/10.1016/j.erss.2022.102502.
- RUGGEDISED. 2023. Accessed March 18, 2023. https://ruggedised.eu/legacy/.
- Scottish Government. 2021. Heat in Buildings Strategy – Achieving net Zero Emissions in Scotland's Buildings. Edinburgh: Scottish Government Publication. Accessed 28/03/2022 https://www.gov.scot/publications/heat-buildings-strategy-achieving-net-zero-emissions-scotlands-buildings/.
- Staffell, I. 2017. “Measuring the Progress and Impacts of Decarbonising British Electricity.” Energy Policy 102: 463–475. https://doi.org/10.1016/j.enpol.2016.12.037.
- Strachan, P. A., G. Kokogiannakis, and I. A. Macdonald. 2008. “History and Development of Validation with the ESP-r Simulation Program.” Building and Environment 43 (4): 601–609. https://doi.org/10.1016/j.buildenv.2006.06.025.
- Svetozarevic, B., C. Baumann, S. Muntwiler, L. Di Natale, M. N. Zeilinger, and P. Heer. 2022. “Data-driven Control of Room Temperature and Bidirectional EV Charging Using Deep Reinforcement Learning: Simulations and Experiments.” Applied Energy 307: 118127. https://doi.org/10.1016/j.apenergy.2021.118127.
- Tulpule, P. J., V. Marano, S. Yurkovich, and G. Rizzoni. 2013. “Economic and Environmental Impacts of a PV Powered Workplace Parking Garage Charging Station.” Applied Energy 108: 323–332. https://doi.org/10.1016/j.apenergy.2013.02.068.
- UK Government. 2019. “UK Government Climate Change Act 2008 (2050 Target Amendment) Order 2019.” Accessed May 6, 2020. https://www.legislation.gov.uk/ukdsi/2019/9780111187654.
- Wang, G. C., E. Ratnam, H. V. Haghi, and J. Kleissl. 2019. “Corrective Receding Horizon EV Charge Scheduling Using Short-term Solar Forecasting.” Renewable Energy 130: 1146–1158. https://doi.org/10.1016/j.renene.2018.08.056.
- Yan, Q., B. Zhang, and M. Kezunovic. 2019. “Optimized Operational Cost Reduction for an EV Charging Station Integrated with Battery Energy Storage and PV Generation.” IEEE Transactions on Smart Grid 10 (2): 2096–2106. https://doi.org/10.1109/TSG.2017.2788440.
- Zou, W., Y. Sun, D. C. Gao, X. Zhang, and J. Liu. 2023. “A Review on Integration of Surging Plug-in Electric Vehicles Charging in Energy-flexible Buildings: Impacts Analysis, Collaborative Management Technologies, and Future Perspective.” Applied Energy 331: 120393. https://doi.org/10.1016/j.apenergy.2022.120393.