
ABSTRACT
The so-called ‘Oxford Study’ by Flyvbjerg et al shows Olympic cost overrun of 170-750% with a substantial risk of a further cost overrun above this range in the future. The aim of this paper is to re-analyse the results by using a method in accordance with the international convention of comparing across time and geographies. The dataset used has abundantly more governmental data than in the Oxford Study. The results of the Oxford Study for the period of 2000–2016 could not be replicated. It is argued why the statistical analysis and their data reliability are misleading, thus leading to a discovery of six typical misperceptions. In contrast to those authors, this paper shows cost overruns (Olympics 2000–2014) for direct non-OCOG investments in the range of 13–178%. Further, it shows that the costs of the Olympic Games represent less than 0.28% of the GDP; hence, it is clear that the Games cannot cause a severe national economic crisis. This paper provides a discussion on the underlying assumptions of the Oxford study, thus providing valuable insights for politicians who intend to submit an Olympic bid, and contextualises cost overruns caused by fixed deadlines and long planning horizons. I disagree with the claim by Flyvbjerg et al. that hosts give a blank cheque to the IOC and I contend that demands and a tight coupling are fixed in the Host City Contract, thus negating the blank cheque assertion.
Introduction
Flyvbjerg et al. (Citation2020), in their paper entitled ‘Regression to the Tail: Why the Olympics Blow Up’ (hereinafter, the Oxford Study, as per the common media usage), conclude their study with noting that ‘Olympic cost blowouts are systematic, […] with more and more disastrous results’ (p. 8). The authors then add a note asking cities and nations, that are faced with deciding whether to host the Games or not, if they can accept an expected cost overrun in the range of ‘170–750% […] with substantial risk of further overrun above this range’ (p. 10). A book published in Citation2019 about the same topic also found cost overruns, but only in the more modest range of about 13–178% (Preuss et al. Citation2019). The statements from Flyvbjerg et al. awaken doubts as these are extreme in comparison to previous findings. In this regard, Block and Kuckertz (Citation2018) note that ‘Novel findings are more interesting and can have a huge impact on management in theory and practice’. Those authors also note that the academic community is increasingly concerned that many cases of novel findings might be nonreplicable artefacts.
The aim of this research is, therefore, to discuss the results of the Oxford Study by applying an additional empirical test, by which the academic discussion will be opened by offering additional sources, more facts, and contextualisation of the Olympic cost overruns. This research also aims to reveal six misperceptions about cost overruns of Olympic Games and a broader interpretation by using source-based and well-researched up-to-date information. This will help in developing policies on Olympic cost control and promoting better political decisions for future Olympic bid cities and the IOC.
While the research of Flyvbjerg et al. on cost overruns in general infrastructure (that is not related to Olympics) has made a significant contribution to project management and answers the question of why large projects have cost overruns, the authors of the Oxford Study do not adequately consider the political, contemporary, and cultural contexts, as well as the very nature of the Olympic Games. These points will be discussed and they form the basis of the misperceptions that are often held regarding Olympic and other mega event cost overruns. In order to check the results and also extend the original Olympic studies of Flyvbjerg and Stewart (Citation2012), Flyvbjerg et al. (Citation2016 and Citation2020), new data analysis and additional data gathering in the present study were necessary because the Flyvbjerg et al. studies do not provide enough information and citations with which to adequately recalculate their results. By providing additional governmental validated sources, a greater understanding of the complexity of staging the Games, and knowledge in economics, this paper offers a coherent and relevant assessment and conclusions that can be useful for policy makers and politicians.
Literature review and results of the oxford study
Overall, there is scant research in the body of literature on cost overruns of Olympic Games. The main author in this type of research is Flyvbjerg with several co-authors, who published their results in Citation2012 for the first time, and since then they have been updating those publications by adding more recent Games in 2016 and 2020. In all of those studies, Flyvbjerg uses the same data and methodology. Preuss et al. (Citation2019) published their book on cost and revenue overruns of Olympic Games for the period of 2000–2018 while differentiating between the Organising Committees for the Olympic Games (OCOG) and the Olympic infrastructure costs. Other research of a similar nature is provided by Jennings (Citation2012), who used a parliamentary government dataset, which was argued contextually, and analysed the different areas of cost overruns, but limited the research to the London 2012 Games. It is noteworthy that the initial budget for London was not clear as four different cost projections were made available, which is symptomatic for mega projects that include many different sub-projects and financing bodies. Jennings (Citation2012) has been cited in works by Ahiaga-Dagbui and Smith (Citation2014), Lind and Brunes (Citation2015), and Invernizzi et al. (Citation2018) that have a focus on cost overruns and highlight London 2012.
When discussing cost overruns, a consideration of the context and causation are needed to make a good interpretation of the study results (Preuss et al. Citation2019). Regarding causation, Love (Citation2011, p. 1199) clearly states that we often follow misinterpretations when the cause is rendered counterfactually (i.e., if event B had not occurred, then event C would also not have occurred), it is necessary for the effect. For example, to say that strategic misrepresentation, which obviously happens in bidding situations (Preuss and Schnitzer Citation2015), caused a cost overrun is the same as saying that ‘if the misrepresentation had not occurred, then the cost overrun would not have ensued’ (Jennings Citation2012, p. 50). Jennings takes that point and distinguishes underestimations from cost overruns, a fact that is frequently overlooked by Flyvbjerg.
What follows is a summary of the main results of the Oxford Study with the intention of enlightening those readers who are not familiar with that work. The following argumentations and findings are also the basis for the discussion in the present study: 1) Flyvbjerg et al. (Citation2020) note that ‘average sports-related costs of hosting are $12.0 billion. Non-sports-related costs are typically several times that’ (p. 3). 2) All Olympic Games since 1960 have run over budget, at an average of 172% (p. 4), with a later contradiction that ‘variance and mean are both infinite, i.e., non-existent’ (p. 8). 3) These are ‘the highest overrun on record for any type of megaproject’ (p. 1). In response to these points, while those authors check whether their data follow a particular statistical distribution against the empirical data for the costs of the Games, the reader may note that this is without any contextualisation or consideration of the immense change in the scope of the Games from 1960 to date. Flyvbjerg et al. (Citation2020) aim to explain the cost risks faced by host cities and nations. 4) They investigate the cost and also the cost overrun for the Games and find that the Games can cause unpredictable cost overruns that are ‘ruled by a power-law that will strike again and again, with more and more disastrous results’ (p. 8). They run their statistics and conclude that 5) ‘Olympic cost blowouts are systematic’ (p. 8) as well as being 6) ‘comparable to “deep disasters” like pandemics, earthquakes, tsunamis and wars’ (p. 9). In another paragraph those authors find that 7) Olympic Games cause a drop in GDP growth and, in particular, 8) this can pull countries into a financial crisis (Greece and the State of Rio de Janeiro) (p. 2).
Flyvbjerg et al. (Citation2020) explain the generative mechanism for the Olympic cost overruns by using six causal drivers: a) irreversibility, b) fixed deadlines, c) the Blank Cheque Syndrome, d) tight coupling, e) long planning horizons, and f) an Eternal Beginner Syndrome. By using statistics, they prove that the Games are difficult to plan and manage successfully, which are reasons why politicians should think twice before entering the bidding to host the Games. Finally, those authors suggest measures on how to mitigate the extreme risks of the Olympic power law. They add a criticism that for hosts, ‘there is no option to reverse their decision, no chance to save on costs by trading off budget against schedule, and a legal obligation to cover all costs’ (p. 10). They also note that the IOC itself incurs no costs, no matter how much the project may overrun (p. 14). Thus, the IOC should cover 10% of any cost overrun and the cities should mitigate their risk by simply walking away from the Games (p. 10). The hosts should have larger cost contingencies for the Games (pp. 10–11). Another suggestion by those authors, is to shorten the seven-year delivery phase for the Games and also host the Games in one or a few permanent locations (p. 11).
Definition of the ‘Olympic Games’ costs
The Flyvbjerg et al. (Citation2020) assumption is that the Olympic Games are a unique megaproject. However, the Games consist of many different infrastructure projects which are planned, financed, and controlled by different authorities (e.g., a stadium by the host city, the Olympic village by a private investor, security by police and armed forces, and the organisation of the Games by a newly established committee). As each edition of the Games is located in a different city, with different available infrastructure, security levels, development needs, political systems, available public resources, and organisational skills, the Olympic Games by their nature have different costs. A justification for spending either more or less for the Games depends on the benefits each project of the Games creates for its investor(s). The above reasons explain volatile Olympic costs and cost overruns and that ‘the Games’, as such, cannot be compared among different countries when regarding their infrastructural investments and costs. This note is important because it explains that any time series analysis of several Games will be meaningless because investments depend on political interest, infrastructural needs, and political systems. The explanation in the above confutes the assumption of Flyvbjerg et al. (Citation2020) that the costs are ‘handed-down uncontrollable risks’.
Preuss et al. (Citation2019) explain the limitations of comparing the costs of the Games and they provide evidence that different infrastructure projects in one country (p. 16), or the same infrastructure project in different countries, both result in different cost overruns (p. 17). This demonstrates that cost overruns are not an uncertainty per se, but rather they are related to 1) the kind of infrastructure built, 2) how typical cost overruns are in that nation, and 3) the political aims (e.g., whether or not there is urban development). Any comparison of costs must at least be controlled by these factors. However, it remains questionable why a comparison of cost overruns, as in the Oxford study, is necessary when the factors for them cannot be generalised.
To compare between similar factors across borders, cost overruns must differentiate between three types of budgets:
The operational costs (OCOG) to stage the Games.
The direct capital costs (non-OCOG direct costs) which are costs for the sport venues, Olympic and media village(s), and other infrastructure with which to operate the Games.
Indirect capital costs (non-OCOG indirect costs) which are for general infrastructure but are used for the Games. It is highly debatable whether or not they are really needed for the Games, or if politicians just want to accelerate urban development using the Olympics as the vehicle.
Flyvbjerg et al. (Citation2020) state that non-OCOG indirect costs were not considered in their calculations. However, it is unfortunate that they inconsequently refer to this budget as being Olympic Games costs (p. 2), and later mix, for some Games editions, parts of indirect with direct non-OCOG costs (which leads to extreme costs for those Games) (see below for evidence).
Research gap and contribution to knowledge
The conclusions of the Oxford Study make recommendations to politicians and policy makers that it would be better to not bid for Olympic Games, as the cost overruns can be extreme. Several times in their work, Flyvbjerg et al. (Citation2020) do not provide contexts and they make conclusions on assumptions that are doubtful, from the perspectives that are outlined in the present paper. As there is no other study available which came up with similar results, the immensely important claim of the Oxford Study to stop bidding for Olympic Games should be confirmed independently.
Therefore, the present paper aims to present a deeper understanding and discussion on the findings of Flyvbjerg et al. (Citation2020), and could also potentially strengthen (weaken) the position of those authors. Additionally, this paper contributes to the body of knowledge by offering some extension and extra value in adequately explaining cost overruns. The most valuable contribution is that I conclude this paper with the six misinterpretations on cost overruns that are stated in the work of Flyvbjerg et al. (Citation2020), which may also be linked with common perceptions of cost overruns at mega events.
Methodology
Replication studies and their principles
Without undertaking a full replication (without which management research is vulnerable to artefacts and individual misinterpretation), here I aim to reproduce the findings of the Oxford study. Even though it is uncommon to conduct explicit replication studies, discussing outcomes of other studies is useful in order to place the academic discussion on a solid foundation (Block and Kuckertz Citation2018). This paper is an academic discourse and serves the function of developing convincing, robust, and reliable structured meta-analysis (Block and Kuckertz Citation2018). Economics and political science have both advanced their own initiatives to address transparency, reproducibility, and replication. Concerning sport management, Funk (Citation2017, p. 148) notes that ‘without doubt, the lack of replication studies is the greatest failing of the discipline.’ In sport economics, there are important replication studies by Fort (Citation2010), Winfree (Citation2010), and Price and Wolfers (Citation2012).
According to Block and Kuckertz (Citation2018), there are several principles that are important for replication studies. Without undertaking a replication study, the attempt to reproduce the findings of a previous study and undertake a deeper analysis can follow similar principles: (1) The first principle is that replication is not a reproduction. Here, firstly, a re-analysis of the calculations of the Oxford Study was undertaken. The many data gaps and misleading data (see below) called for additional data. Thus, it is expected to find still similar results, rather than exactly the same results. (2) The reason why I challenge the Oxford Study, is that the result caused extreme interpretation (i.e., ‘Olympic cost blowouts are systematic’ (Flyvbjerg et al., p. 8) and ‘are comparable to “deep disasters” like pandemics’ (p. 9)). These statements appear to aim at drawing the direct attention of politics and policy makers away from the Olympic Games, as the Oxford Study recommends to stop bidding for Olympic Games. These points are necessary to start an academic discourse about the cost overruns of Olympic Games. This paper will (3) enhance the generalisability of the original study concerning cost overruns of Olympic Games. By using additional data, a stricter data validity check and also a data crosscheck were possible. This helped to contextualise the outliers of the Oxford Study and inconsistencies in the database were found. The present study (4) does not compromise on the quality of data and I exercise extreme caution when crosschecking, hence this paper has more reliable data than the Oxford Study. Overall, this paper offers (5) extensions which will be properly addressed in order to not confuse them with the Oxford Study.
Method to Handle Source Validation and Data Collection
This analysis of the Oxford study considers the last ten Olympic Games (2000–2018) and not those Olympic Games from before (1960–1998) for a good reason. The last 10 Games did not change much in their scope (NOCs, IFs, events, athletes) (Preuss et al. Citation2019, pp. 3–4) and, therefore, at least the infrastructural and organisational requirements are similar. The period of 1960–1996 is historical and was determined by changes such as immense growth in size and demand, and changes in the IOC regulations.
As aforementioned, the present study uses abundantly more data than the original study, for four reasons. Firstly, not all data in the Oxford Study are properly quoted and some Internet sources no longer exist. Secondly, it was found that some of the original data were not valid (i.e., whether bidding data were solid estimations (see Jennings Citation2012, p. 10). Thirdly, direct and indirect non-OCOG budgets were mixed. Fourthly, it is necessary to control whether or not final costs were just estimations by the media or were taken from sound governmental reports.
shows the sources used by all three papers from Flyvbjerg et al. (Citation2020, Citation2016, Citation2012), which all used the same data, for the past 10 Games, compared to the sources from Preuss et al. (Citation2019) which are used for the present paper. Data collection for this paper was organised in a manifold way to use the highest possible variety of information sources, so as to gather the costs of Olympic Games. This is important, to avoid using the wrong information that may have been copied from a particular political party.
Table 1. Number of sources used by games
To do so, data were systematically collected by analysing Official Reports and Bid Books from Olympic Games and publications about cost overruns. Then, experts (scholars) who have published works on the Olympic Games were contacted, asking them for their internal document collection. Additionally, governmental institutions that were in charge of financing the Games were contacted. Then, the IOC Olympic Studies Centre and IOC archives were visited to find non-published data (such as official OCOG cost statements and annual governmental reports). Finally, data were provided by ProProject GmbH, which is an agency that collected data to provide a consulting service for bid cities in the past and currently offers a consulting service to the IOC with the aim of reducing Olympic Games costs ().
Table 2. Number of sources used by origin
Overall, the Oxford Study data are based on sources that are very small in number. For some editions of the Olympic Games, the Oxford Study is solely based on data from the bid books and the official reports, even though Flyvbjerg et al. (Citation2020) note that ‘we cannot trust on organizers, the IOC and governments to provide […] reliable information about real costs’ (p. 2). Flyvbjerg et al. are correct in assuming that there is a political interest in offering low figures in the candidate file (see hidden intention/characteristics of Agency Theory, Preuss and Schnitzer Citation2015), but their doubt concerning official government sources (e.g., Canada, England, USA, Australia) is unjustified because official reports are based on governmental documentation (e.g., reports to the parliament or congress). Even though they are problematic, the Oxford Study used the bid book data as the first projection and first official political promise to the population. Despite what is written in the methodology section of the Oxford study, for Rio 2016 and Sochi 2014, Flyvbjerg et al. did not use the Candidature File (i.e., such files were not noted in their bibliography). This point is problematic, because without the starting budget, no reliable cost overrun projection can be calculated. More problematic is the fact that these two Games are key drivers for their latter statistical distribution as they are causing the fat-tail (cost overrun: Rio 352%, Sochi 289%). Further, to date, Rio 2016 did not publish any final costs, as police investigations are ongoing (Dubi Citation2021). The five Web pages that Flyvbjerg et al. (Citation2020) used for Rio’s cost overruns (Flyvbjerg et al. Citation2016, p. 2017) are no longer in existence. For most other Games, Flyvbjerg et al. (Citation2020) take the Official Reports as their main source for the outturn costs. After investigation in detail, it became clear that a differentiation of OCOG budget versus direct versus indirect non-OCOG costs is not neatly kept (evidence below).
Another fact about data quality of the Oxford Study became apparent by way of the costs of the Games being published in USD. In the following, examples are provided that put several figures of the Oxford study into question. As the scope of the Games did not change dramatically from one Games to the next, this raises doubts where the Oxford study shows that Munich 1972 was six times cheaper than Montreal 1976, whereas both Games caused severe infrastructure investments. Another example is that the Oxford study shows London with 15 bn USD direct non-OCOG costs but a brand-new stadium only costs around 1.3 bn USD (e.g., Wembley stadium). The budget that is projected would represent roughly 11 brand new Olympic stadiums with 60,000 seats each. As this cannot be true, obviously, here non-OCOG indirect costs were included in this budget. A third example is that, according to the Oxford study Innsbruck 1964 only cost 22 million USD, when a new Olympic Village was built (Essex and Chalkley Citation2004, p. 220). That must obviously have been much more expensive. The village costs must then probably have been included in the non-OCOG direct costs. All this shows that the dataset is obviously fragmented. This causes severe doubts over the statistical results of Flyvbjerg et al. (Citation2020) that are based on that dataset. Evidently, large parts of the costs are missing for some Games and, apparently, bidding documents compared to final costs statements (official reports) do not contain the full range of infrastructure projects. There are various examples where entire Olympic venues were not taken into consideration in the bid document, but were decided on later and then, of course, they were included in the outturn documents. Using Sydney 2000 as an example, it is unclear what the projected costs were. The Olympic Coordination Authority (OCA) and the New South Wales (NSW) Treasury published estimates differently. The NSW Treasury estimate was 363 m AUD lower than the OCA estimate, which considered the Sydney Showground at Homebush Bay as Olympic. The NSW Treasury did not treat this expenditure as a cost of the Games, as it was built as a showground, but it was being used as a venue during the Games. Although the OCA’s 1998 estimate included this cost, its post-Games report excluded it. This shows that there are inconsistencies which are centred on whatever must be considered as Olympic-related or non-Olympic-related (Jennings Citation2012, p. 5). This also casts doubt about the assumption of Flyvbjerg et al. that the bid book is the cost promise to the population and not the governmental authorities that have an even greater duty to forecast taxpayer costs. All this leads to two problems in the Oxford Study. Firstly, a comparison of Games costs shows non-existent high fluctuations and misleads the interpretation of the costs. Secondly, by not comparing the same data/projects between bid document (as they do not show full costs) and final costs, fictive extreme results occur. Thus, the distribution curve of cost overruns has extreme results (i.e., fat-tail) and prevents the finding of correct functions.
Method of Calculation of the Cost Overruns
The term ‘cost overruns’ refers to the situation where the actual costs are higher than the original estimates (Invernizzi et al. Citation2018). The method of calculating cost overruns is shown in . Firstly, the goal is to find the nominal cost projection (for each budget area considered) as seriously promised to the population. That is usually undertaken eight years before the Games. For mega events in a serious auction-like awarding procedure (such as bid competitions), the bid book cost estimation may be a politically false set amount (Preuss and Schnitzer Citation2015 for FIFA World Cups) or a pure underestimation (Jennings Citation2012), both of which built a false base with which to calculate cost overruns. Better cost estimations can be serious governmental projections as the government is politically responsible for taxpayer money, and not a politically acting bidding committee. Secondly, then take the costs (for the same budget area) after the Games. Both costs have to be inflation adjusted by an inflation rate that represents the budget area (consumption goods = consumer price index; infrastructure = construction price index). By subtracting the costs (t-8) from those costs after the Games, cost overruns become visible. What follows is a discussion of the method used by the Oxford Study regarding cost overruns.
Table 3. Comparison of methods to calculate cost overruns
summarises step-by-step the procedure to calculate cost overruns and reflects them on shortcomings from the Oxford Studies (2012, 2016, 2010). The method is only compared to the Oxford Study as no other publications exist that have calculated cost overruns, to the best of my knowledge.
An attempt to re-analyse cost overruns of the Oxford Study
As explained above, this paper provides an analysis of the Oxford Study. Data were added to the original data set of Flyvbjerg, and most importantly careful consideration was assumed, so that only OCOG and direct non-OCOG data were used. shows the cost overruns of the different budgets in percent.
Table 4. Cost overrun comparison of results, calculated in local currencies, real terms
Column 7 in shows the nominal difference of cost overruns by comparing the Oxford Study (column 3) with the calculations of Preuss et al. (Citation2019) (column 6), according to a proportional share of OCOG and direct non-OCOG costs. In other words, the nominal cost overruns of OCOG and direct non-OCOG are added and shown in percent. The differences in column 7 occur because of either missing budgets or indirect non-OCOG budgets that were incorporated into the Flyvbjerg data.
Two out of seven Games have higher cost overruns than in the Oxford Study. The non-OCOG costs in this paper get represented by a so-called Olympic infrastructure basket. In economics, scholars work with baskets of representative goods and services in order to be able to compare markets, currencies, or others. The Olympic infrastructure basket used here contains the Olympic Stadium, Olympic Village, IBC/MPC, swimming pool, multipurpose hall, velodrome, ski jumping hill, sliding centre, and ice stadium. It can be reasonably assumed that the Olympic infrastructure basket that was used here to mirror the Oxford Study outweighs the true cost overruns, i.e., the result is a larger cost overrun than it would be in the case where all Olympic infrastructure would be included, which is called a conservative (over)estimate. This assumption is realistic for two reasons: firstly, almost all capital investments in the Olympic infrastructure basket were publicly financed. Private investors are less likely to accept cost overruns than public fund providers; secondly, the venues included in the basket are the largest, and most complex, thus they usually have higher than the average cost overruns.
To find the reason for the different results (, column 7), Turin 2006 (Oxford Study cost overrun 80%) and London 2012 (Oxford Study cost overrun 76%) were used to recalculate in depth.
The Turin 2006 candidature file had a forecast of 0.78 bn USD (1999) OCOG expenditure and 0.6 bn USD (1999) direct non-OCOG investments for sport venues, the Olympic, and Media Village (converted as 1.87 bn USD, 2015). The Official Report (TOCOG Citation2007) shows 3.23 bn USD (2006) but for overall construction costs (converted as 3.87 bn USD, 2015). The Oxford Study (4.35 bn USD, 2015) did not use the Official report, but instead used data from Bondonio and Campaniello (Citation2006), with the finding of 4.73 bn USD, 2015. The re-analysis shows 85% (based on Official Report) with total costs of 3.1 bn USD versus 135% (based on Flyvbjerg and Stewart Citation2012 using 4.35 bn USD). shows that the Oxford Study found 80%, which shows that the cost overruns were calculated based on the Official Report, while the total costs were taken from Bondonio and Campaniello (Citation2006) who, however, included in their figure indirect non-OCOG costs, which Flyvbjerg et al. actually wanted to exclude.
The London 2012 candidature file gave a forecast of 2.5 bn USD (2005) for OCOG expenditure and 2.2 bn USD (2005) direct non-OCOG investments for sport and training venues, IBC/MPC, and the Olympic Village (5.6 bn USD, 2015). The costs, according to the government, were 14.2 bn USD, 2015 (DCMS, Oct2012), but those include all funding by the government (Olympic venues, infrastructure, and transport). This figure is taken by the Oxford Study as Games costs but would cause a cost overrun of 202%. However, the Oxford Study states a figure of 76%, which cannot be replicated. The Official Report provides no information about the direct non-OCOG costs and the government (DCMS) includes indirect non-OCOG costs. A full discussion is made by Jennings (Citation2012).
This shows that the data of the Oxford Study for overall costs and cost overrun calculations stem from different sources, sometimes the grey literature (i.e., newspapers). As the overall costs used in the Oxford study were not transparently sourced, an attempt was made to re-calculate those with present today available data. compares the overall costs of the past 10 Games. For the re-analyses, the same method as the Oxford Study was used.
Table 5. Costs of Olympic Games 2000–2016 re-analysed, in USD 2015
The results (column 5) should not be cited as overall costs, because the method of using GDP-deflators and currency exchange is prone to errors (see ). Overall, a re-analysis of the costs (column 1) failed. The dataset that was used for re-analysing is consistent and valid but has one shortcoming: it lacks a full consideration of direct non-OCOG costs (column 3) because only the most expensive public-financed venues (the basket) were included. Logically, the Oxford Study must have found higher costs as it includes all direct non-OCOG costs. However, the costs of Athens and Salt Lake City were greater than the Oxford Study shows (column 6).
The re-analysis revealed one other important fact. The Oxford Study uses different figures for the costs and for the cost overrun calculations. By using an extended dataset but with the same methodology, a re-analysis of the Oxford Study results was not possible, because:
the data used in the Oxford study are often not quoted;
some sources used do not differentiate direct and indirect non-OCOG costs;
most Official reports do not include the full direct non-OCOG budget at all, whereas, others mix in the indirect non-OCOG budgets;
the mathematics is missing that explains how inflation adjustment, and distribution of costs over the seven years of preparation were calculated, and the sources of the conversion data are also not quoted;
the candidate files often include other direct non-OCOG investments rather than the official reports. Only OCOG budgets are regularly fully displayed.
The high costs in London, Sochi, and Beijing as shown in the Oxford study obviously had indirect non-OCOG costs included. The data from Rio 2016 are not yet available as there are still ‘legal claims and they cannot close until these issues are resolved’ (Dubi Citation2021). The costs of these Games are important because the statistical results are severely influenced by them, as discussed in the next paragraph.
Results and discussion
Statistics and their interpretation
The question of how the Olympic Games impact the GDP (or can even cause an economic crisis) is central the work of Flyvbjerg et al. (Citation2020). Their argumentation is that ‘Cost overrun and associated debt from the Athens 2004 Games […] contributed to the country’s deep financial crises’ (p. 2) and ‘Rio de Janeiro’s governor declared a state of emergency to secure additional funding for the Games’ (p. 2). The assumptions of Flyvbjerg et al. (Citation2020) must have been that the decreased GDP growth were caused by state consumption for the Games, and that a global economic climate of austerity in government spending should lead to the governmental decision to rather not invest in the Games.
The GDP is a main macro-economic aggregate based on the National Accounts System representing the economic activity produced within a country, regardless of the contribution of the internal or foreign subjects. Thus, economic activity caused by state consumption (e.g., investments in venues), OCOG expenditures (consumption), and Games tourism (exports) stimulate the economy, which has a positive impact on the GDP. Therefore, Olympic Games investments will positively influence the GDP, as long as there is additional net economic activity and not just a re-distribution. Flyvbjerg et al. (Citation2020, p. 2) overlook in their argumentation that billions of USD of foreign investments stimulate the economic activity of the host country; much additional construction stimulates economic activity; additional foreign tourists consume; and the business climate/image of the country increases.
Pre-Games investments are not an economic burden for an economy because they activate economic activity and, therefore, if that activity is at all significant then it increases rather than decreases the GDP. Despite adopting different methodological approaches, studies by Papanikos (Citation1999) and Balfousia-Savva et al. (Citation2001) both predict a GDP growth of 0.5% for a period of 6 years. Kasimati and Dawson (Citation2009) also found a positive impact on the Greek economy. However, for Sydney 2000, Madden (Citation2006) found a negative effect on the Australian economy. This could have happened due to potentially reduced post-Games governmental spending (due to Games-related debts) that decreased the GDP. However, this effect is in reality a vanishingly small part of the nation’s GDP (see ).
Table 6. GDP in relation to Olympic Games costs
Comparing the investment volume (costs) with the economic activity within a country (GDP) shows that any suspicion that GDP could be affected in any way, positively or negatively, lacks credibility. Relative to the GDP of the host nation, the Games costs were, at the maximum, 0.295% (Athens 2004) and, at the minimum, 0.003% (London 2012). If I take the private investments and the OCOG costs out (which are almost entirely financed by the IOC and private sources), then I would derive an even smaller percentage. Von Rekowsky (Citation2013, p. 1) found that in a ‘random sampling of 10 Olympics held between 1964 and 2008, the host nations’ GDP generally rose before the Games, started to fade as the Games began, and then tapered off considerably afterwards’. That author concludes that this is not due to the Olympics, but rather it ‘illustrates the gap between hype and reality’ (p. 2). A similar result was found by Preuss and Solberg (Citation2006, p. 407), who showed that the populations of nations with low GDP/capita support major event bidding in the hope that this will increase their own income. However, their hopes may well be based on unrealistic expectations.
According to official data, the total disbursement for the preparation and during the Athens 2004 Games from the State Budget was approximately 1% of the state expenditure (644.6 bn €) over the period of 2000–2010 (IOBE (Foundation for Economic and Industrial Research) Citation2015, p. 48). The direct non-OCOG costs (public expenditure for construction/renovation of facilities and security) were estimated at 4.1 bn € (much higher than in the Oxford Study), representing 0.63% of the state expenditure. In 2020 the state deficit of Greece was 336.7 bn €, which means that the Olympics – if no revenues at all were achieved – represent 1.2% of the state deficit. Obviously, this did not cause the economic crises of Greece and has nothing to do with the GDP. No evidence or other sources could be found to support the hypothesis of Flyvbjerg et al. that Olympic investments cause an economic crisis or decrease the GDP growth.
Regarding the development of GDP growth (without an Olympic causality), the re-analysis shows different results. For further discussion to be enabled, FIFA Football World Cup (1970–2014) data were added. Looking at the data in another context makes the results meaningful.
Figure 1. Average GDP growth for host nations, moving average loess regression.
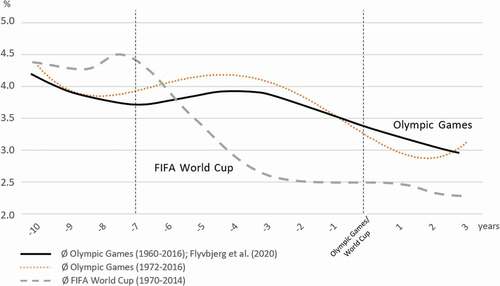
The curves suggest that politicians could be motivated by a high GDP growth to bid for Olympics/World Cup. The downswing is cyclical. Thus, the curves above show a lucky coincidence. The fact that the GDP has a slower growth during the investment period t-5 to t-1 means that the Game/World Cup investments are good in that economic situation as it is an anticyclical investment. This may even explain why politicians agree to additional infrastructure investments (not in bid documents), which then lead to cost overruns, but these are justified by their ‘economy recovery plans’. Notwithstanding, it is debatable whether the Flyvbjerg et al. argument of austerity (which means saving) is the correct way to fight economic crises or the claimed lower GDP growth rates.
As shown, Flyvbjerg et al. (Citation2020) partly used data from different budgets and from different sources, thus leading their statistics to find two power-law functions and one loglogit function that describe the distribution of cost overruns of Olympic Games (1960–2016). The functions found have resulted in the interpretation that ‘cost overrun in the Olympics is [.] 172–746%’ (p. 9). However, results from statistics are only meaningful when data, assumptions, and context-based interpretation can be reproduced and agreed upon by independent researchers. The Flyvbjerg et al. (Citation2020) assumption (critically discussed below and not agreed upon) that cost overruns of individual Games have a common ground, occur from external forces, are uncontrollable, and will increase in future, have tempted those authors to note that: ‘Olympic cost blowouts are systematic, ruled by a power-law that will strike again and again, with more and more disastrous results’ (p. 8) and become extremely (infinitely) high (p. 10).
This interpretation is based on a function (power-law) that describes the distribution (fat-tail) of the cost overruns over individual Games (independent entities). Fat-tail distributions are not about the incidences of low-probability cost overruns, but the contributions of extreme overruns. However, when describing a distribution by a function and interpreting a function, the data then need a common ground, such as the example in the Oxford Study, where the authors discuss the Nile River (whereas the river is the common ground), which has different water levels annually that can be low or extreme values. Regarding cost overruns for the Olympic Games there is no such common ground. Thus, it is irrelevant to be alarmed by extreme results and to give political advice that is in accordance with the distribution of the data. The point is that Olympic Games in different cities can have cost overruns due to their political situation or location. Flyvbjerg compares the Olympic Games as if it is one river that can have low and high waters (cost overruns). But the Games are so different such as for example different rivers are. And when the Amazonas (state in NW Brazil) had extreme high waters, can we then also expect them for the Nile River (northeastern Africa)? Thus, the statistical approach is not valid for this interpretation, which is explained in the following.
Power-law is a functional relationship between two quantities, where a relative change in one quantity results in a proportional relative change in the other quantity, independent of the initial size of those quantities: one quantity varies as a power of another. Flyvbjerg et al. (Citation2020) state that the ‘scope of the Games’ (p. 10) is the quantity causing a power of the other quantity, namely, cost overrun. This is a counterfactual causation (Love Citation2011) because cost overruns were mainly caused by political intentions and how the Games requirements match the existing structures in the city. Both reasons are individual and without connection from one Games to another, thus not justifying distribution curves for cost overruns.
Several of the cost data which Flyvbjerg et al. used could not be found in the sources they cited. The power-law function was found due to five Games that had extreme overruns. When putting them in a function representing a distribution, the authors did not consider the development of the Games for the period of 1960–2016 nor that ‘the costs […] are subject to place and time-specific parameters’ (Jennings Citation2012, p. 11). An analysis of those data revealed that Lake Placid and Montreal were Games that, in their financial structures, were not comparable to Olympic Games after 2000. Why should Games from another century, during the Cold War, with a different scope lead to a recommendation to politicians to rather not consider bidding for Games after 2030? Sochi 2014 was a Russian prestige object without trustworthy financial data available. The reason for the cost overruns was not only the regime’s intention to reconstruct Sochi but also the fact of missing venues and infrastructure which caused high investments. For London 2012, the Oxford Study included indirect non-OCOG data (see above) and for Rio 2016 no official data are published (until 2/2021).
The interpretation of the Flyvbjerg et al. (Citation2020) statistical result is based on six assumptions (in the following in italics). These are misperceptions of the Games and I put them into context:
The Games are one project. In reality, only the Games organisation (OCOG) is one project but not all the infrastructural changes. Direct and indirect non-OCOG investments include hundreds of projects which are financed and constructed by dozens of stakeholders. These are different in each city.
The Games are a relative homogeneous good and do not change over time. Winter and Summer Games are the same because the cost overruns are (statistically) seen as being very similar. Therefore, cost overruns can be explained by a function. In reality, the Games are extremely different from one edition to another. Not only does the sport programme change, but also the geographical spread of the sport venues (from one city to various cities or even to neighbouring countries). The city developers and politicians decide on the master plan, and with this they determine the size of the Games-related investments. The Olympic Games differ strongly between Winter and Summer editions and also by way of infrastructural demand, finance models, political interest, binding contracts, etc. The Olympic Games for the period of 1960–1980 were greatly different from those after 1980, where growths, commercialisation, and professionalisation started. Since 2000 onwards the number of NOCs, sports, and athletes have remained somewhat constant.
Olympic Games costs are based on the scope of the Games (e.g., sports, events, athletes). As explained above, the scope is relatively constant since Sydney 2000. The main cost (overrun) driver is new infrastructure (controlled by the Master Plan) and local political goals.
The IOC dictates how to organise the Games. In reality, the hosting requirements are highly flexible nowadays. The host city can use venues outside the city or even outside the country, construct temporary venues, and change the location of a venue when that saves money or is easier to finance (e.g., Swimming pool without roof in Athens 2004, Equestrian centre moved to Hong Kong for Beijing 2008, Badminton moved to existing Wembley Arena in London 2012, the existing Maria Lenk Aquatic Centre in Rio 2016 was used instead of a new construction).
A cost overrun is a risk that can occur like a terror attack, tsunami, or war to anyone who bids. Here, Flyvbjerg et al. confuse between risk and uncertainty concepts. There is a certainty of cost overruns (Andreff Citation2012) and any uncertainty concerns their magnitude, which is never taken for granted, as the magnitude depends on many factors. Olympic Games consist of many projects and many stakeholders having many different objectives and possibilities to finance. In reality, there are manifest reasons for the largest historical cost overrun (e.g., a political leader using the Games for urban renewal (Montreal, Sochi)). This has nothing to do with risk. If the Olympics were truly a ‘risky business’, I would observe no cost overruns at all for some years and even some cost underruns for some other years.
The budget in the bid book is the promise to the population. In reality, the candidature file is a document that is handed to the IOC, including legally binding projections for the upcoming Games. For many years cost estimations were not demanded. The budget is not a promise but rather it provides information for the IOC. It is prone to underestimation (Jennings Citation2012) and it is a political document (i.e., to win a bid, Preuss and Schnitzer Citation2015). The promise to the population is made by the government rather than by the budget in the bid book.
Flyvbjerg et al. (Citation2020) discuss five reasons for cost overruns. What follows, is a discussion of misperceptions that existed and an addition of contextual information (see also Preuss et al. Citation2019).
Discussion of reasons for cost overruns
Argument 1: irreversibility and fixed deadlines cause cost overruns
Indeed, there is no option in the Host City Contract (HCC) allowing the hosts to terminate. But there are some mandatory provisions of Swiss contractual law that could authorise the host to withdraw from the Games, but only under extremely narrow conditions, i.e., if the Games become completely impossible to organise (such as Tokyo 2020 due to the COVID-19 Pandemic), or in the case where the IOC blatantly violates all of its key obligations under the contract. The Flyvbjerg et al. (Citation2020) suggestion to postpone/cancel the Games when cost overruns seem to get too high would affect the Host severely as the contractual bindings are numerous. Additionally, revenues would not be realised, thus the investments that have been made would not pay off.
A fixed deadline increases the uncertainty for a cost overrun. Whatever the size of an investment project, as soon as it is lagging behind the schedule this immediately generates a cost overrun. Finishing a project in a rush is always more expensive than adhering to the schedule. Delays always happen for some component projects when hosting the Olympics. However, as the COVID-19 Pandemic shows, a postponement of the Games 2020 to 2021 costs much more. The IOC provided an envelope of 0.8 bn USD to support the different stakeholders of the Games and additional money is given by Japan, Tokyo, sport federations, sponsors, etc. A trade-off ‘between schedule and cost’ (Flyvbjerg et al. Citation2020, p. 6) can obviously become extremely expensive.
Argument 2: the IOC gets a blank cheque from the host and misuses it
A blank cheque is a metaphor for a signed cheque with the amount unspecified and complete freedom of action or control (for the project). Blank cheques are not a ‘license to spend without limits’, without guidelines, or without consequences. Host cities/OCOGs have to define and justify the public resources they need and they are only bound by the HCC with respect to the promises they made. This is important for, and fair to, the other candidates, as a bidding competition is similar to an auction where the winner must pay the price that is proffered. However, even if the IOC ended this auction like the bidding process in Citation2019, it was valid for 60 years and incurred the ‘winners curse’ for many cities. Cost underestimation can lead to seriously higher costs and goes along with an overestimating of the benefits (Andreff Citation2012). Today, when bidding for Olympic Games, the bidder receives information and support from the IOC ‘Future Host Commission’ and feedback from the IOC Executive Board. Hence, a bidder no longer enters an auction-like competition with fierce bidding, thus reducing the risks of a ‘winner’s curse’.
Flyvbjerg et al. (Citation2020, p. 10) speculate that the IOC drives host costs up so as to profit from the extra revenues. However, solely the host city/politicians control and decide on construction. The IOC is not interfering in any other obligations except for those that are fixed in the HCC. In this regard, the HCC Paris 2024 explains: Firstly, obligations derive ‘directly from the nature of the Games organization and from specific commitments made to the IOC in the course of bidding for the Games.’ These must be contained in the HCC, otherwise it would jeopardise the bidding process. Secondly, obligations are for contracts between the host city and third parties (e.g., construction) ‘to which the IOC is not a party and assumes no obligations’ (HCC Citation2016, p. 4). Both are not blank cheques for the IOC but, rather they bind the organisers to their promises.
Contrary to what is mentioned in the Oxford Study, the IOC cannot dictate any construction costs to maximise its revenues (p. 10). ‘In case of any obligation of the Host City, the Host NOC and/or the OCOG pursuant to the HCC to provide certain facilities […] to the IOC, […], such facilities […] shall be provided in accordance with the terms defined in the HCC […]’ (HCC Citation2016, p. 13). Regarding the requirements of the venues, the HCC states (HCC Citation2016, §33a): “provision of all Key Olympic Venues […] and other venues as further described in the ‘HCC – Operational Requirements-Sport’ and the ‘HCC – Operational Requirements-Venues’. This means that all obligations are fixed in the HCC and they are limited to key Olympic Venues and not to general infrastructure. It is notable that the IOC contributes to the OCOG by assisting ‘in the planning, organizing, financing and staging of the Games’. Thus, the IOC gives a blank cheque to the OCOG with ‘an overall estimated value of USD 1,700,000,000’ (HCC Citation2016, p. 14). Most of the money is bounded by the organisation requirements.
Argument 3: tight coupling to promises
Other than the fact that Flyvbjerg et al. (Citation2020) assume that the IOC does not control or decide on constructions, the IOC actually does demand a progress report (HCC Citation2016, p. 4). The IOC does not force the host city to overspend, but rather it controls the host with regard to fulfiling its bid promises and to delivering International Federation (IF) technical requirements, i.e., characteristics which the venue must hold. A tight coupling exists regarding the sports programme, which is known beforehand without changes being allowed after the Games are awarded. There is no obligation in terms of quality, and thus no blank cheque to the IOC with which it can spend money with the host as the source.
PyeongChang 2018 provides some evidence about the flexibility of the IOC to release the government from several bid commitments to reduce costs. According to Dubi (Citation2017) these are IBC/MPC (MMC) changed to fully temporary; Concept of the Olympic Village was changed for reduction of costs; Cancellation of the second Medal Plaza in Gangneung; Significant reduction of venue capacities; Not all newly constructed venues/villages were delivered according to LEED Platinum standards; Free of charge air shuttle from Seoul to YangYang will no longer be offered.
However, what obviously caused cost overruns was the decision of the host to change the master plan against the advice of the IOC and the initial plans in the bid documents. Thus, PyeongChang constructed a new sliding centre instead of using that which already existing abroad; constructed a new temporary Stadium for the opening ceremony instead of using the Ski Jumping Arena or an existing stadium in Gangneung; changed the accommodation concept from a low and compact number of properties to many hotels in remote locations and of differing standards (Dubi Citation2017).
Argument 4: long-term planning horizon increases cost overruns
Flyvbjerg (Citation2011) notes the underestimation of risks due to complexity and changing scope during the implementation period, as the major reasons for cost overruns. Jackson (Citation2002) supports this view by noting that the most serious problem in project management is the planning of a budget for future investments, which is estimated using inadequate information. According to Jackson, it is important for the purposes of good planning to define the scope and complexity of the project in a clear manner from the earliest stages. This is done by the HCC. Even though the planning horizon to organise the Games (OCOG) is seven years, for some infrastructural changes it is shorter. After winning, the Host immediately starts with constructions, thus, for some projects the planning horizon may be only 3–4 years.
Argument 5: eternal beginner syndrome causes cost overruns
The Oxford Study states that Olympic hosts have not organised the Games for a very long time or they have never organised them before. As explained above, the Olympic Games are not one project but rather they are a very complex mixture of many projects. Thus, a host city is obviously not an eternal beginner regarding the construction of a stadium or swimming pool, the renovation of gyms and the planting of trees in an Olympic Park, the construction of exhibition grounds or social housing units. However, the OCOG is new at organising such an event (OCOG costs), but due to observation programmes of previous Games, the IOC transfer knowledge and support, a considerable number of OCOG employees move from one Games to another, and the fact that most hosts have hosted other mega events before (e.g., FIFA World Cups), excludes them from being eternal beginners. In their study, Flyvbjerg and Stewart (Citation2012) note that cost overruns severely dropped after the IOC established their knowledge transfer system.
Discussion of the six steps to better games management
Flyvbjerg et al. (Citation2020) suggest their ‘Six Steps to Better Games Management’, but they all lack a deeper understanding of the complexity behind Games Management. However, they may cause a serious discussion in both the academic community and management practice. Therefore, the six suggestions of the Oxford Study can be used as food for thought in order to develop common misperceptions, which are then discussed by adding evidence and counterarguments, in order to start a better-informed discussion about cost overruns.
Misperception 1: ‘Potential hosts must understand that hosting the Games is an extremely risky business’ and is related to infrastructure (Flyvbjerg et al. Citation2020, p. 13).
Preuss et al. (Citation2019) found cost overruns for the past 8 Games to be in the range of 13–56% with one extreme of 178% for Sochi 2014. This is not extremely high, as the authors of the Oxford Study published themselves that, the average cost overruns for roads are at 20%, for large bridges/tunnels they are at 34%, and for rail they are at 45% (Flyvbjerg et al. 2002); for megadams they are at 90% (Ansar et al. Citation2014); and for major IT investments they are at 107% (Budzier and Flyvbjerg Citation2011). These figures vary extremely by geographical region (Preuss et al. Citation2019, p. 17). This explains once more that cost overruns are independent of the scope of the Games and that direct non-OCOG cost overruns are similar to those of other mega projects, but they still go into the billions of dollars.
Misperception 2: ‘The IOC assumes low randomness when it states that a 9.1% contingency for unanticipated expenses is in line with the level of risk for previous Games’ (Flyvbjerg et al. Citation2020, p. 13).
The Oxford Study take facts out of context here, as the 9.1% refers solely to the OCOG budget and not to other cost overruns. Preuss et al. (Citation2019, p. 114) show that for the past 9 Games cost overruns of OCOGs were up to 114% but, it is noteworthy that revenue overruns were also up to 119%, i.e., almost all OCOGs ended without deficit. A contingency of 9.1% for OCOG budgets is therefore appropriate.
Misperception 3: ‘The IOC should […] hold some of the cost risk’ (Flyvbjerg et al. Citation2020, p. 14).
The IOC has no decision power over the constructions of the host. The host city sets the agenda for sport and urban development and decides on the choice of construction companies and time schedule. The Host and the IOC are bound to the HCC, however, the IOC allows changes of the master plan to reduce capital costs (IOC Citation2018). To cover some cost uncertainties, the IOC provides financial support (around 1.7 bn USD in Paris 2024) which is bounded to the organisation of the Games. Furthermore, the Olympic Agenda 2020 encourages future hosts to deliver legacy plans for any venue constructed and the creation of legacy management authorities to overlook the implementation of these.
Misperception 4: ‘Shorten the seven-year delivery phase for the Games’ (Flyvbjerg et al. Citation2020, p. 14).
As the Olympic Games require a large organisation and several direct non-OCOG investments (often for the Olympic Village, IBC, and some venues), a planning horizon of seven years is adequate. Well-informed planning timetables will be key to making savings and avoiding uncertainty. The new IOC-‘3 + 4 Games Planning Framework’ encourages organisers to allocate three years to focusing on strategic elements (e.g., scoping, securing resources, public engagement, and communication) before shifting focus four years before the Games to detailed operational planning, readiness, and delivery. Five years (t-5 to t) are needed, from public procurement of the individual projects to their construction, leaving time for delays, test events, etc. However, from Citation2019 onwards the delivery time can be shorter as the bidding process has changed.
Misperception 5: Hosting ‘the Games in one or a few permanent locations’ solves the Eternal Beginner Syndrome (Flyvbjerg et al. Citation2020, p. 15).
This proposal overlooks the idea of the Games as being a global event, and also the fact that broadcasters wish to broadcast the Games in prime time, athletes want home Games and no time difference, NOCs want to avoid high travel costs, new sports and changed requirements need a permanent renovation/rebuilding of the venues, and Olympic Villages (2,500 housing units) need to be kept available over 4 years to be reused, etc. As discussed, the Eternal Beginner Syndrome is limited to the organisational aspects. Today, the IOC ‘provide OCOGs with more guidance and support and furthermore introduce greater flexibility into the governance and engagement processes. This will allow for better alignment of the Games with the cities’ local development and legacy plans, resulting in significant savings in the OCOG and non-OCOG budgets of future hosts’ (IOC Citation2018, p. 22). The ‘new norm’ provides additional measures to reduce a potential Eternal Beginner Syndrome at OCOGs.
The ‘spread of the Games to several locations’ (Flyvbjerg et al. Citation2020, p. 15) is already implemented. The increased flexibility in ‘venue selection criteria arising from the use of existing mono-functional venues, even if located outside the host city/region; the elimination of minimum venue capacities, combined with increased venue sharing opportunities; and reduced venue-specific requirements’ (IOC Citation2018, p. 48) releases from tight coupling.
Misperception 6: ‘Prospective host cities could mitigate their risk by simply walking away from the Games’ (Flyvbjerg et al. Citation2020, p. 15).
The suggestion reveals the lack of understanding of the importance of the Olympic Games for world sport and fair play. If a city wins the bid against its competitors by promising to organise the Games, and then, being responsible for its own sport and urban development investments, is allowed to return the Games at any time when a host becomes aware of not being able to manage the project (which would sometimes lead to the cancellation of the Games), the (financial) safety of many world federations and NOCs is gone. Many Olympic sport federations depend on the revenues of the Games and 90% of the IOC income is passed on to them. A cancellation would also deprive the athletes of their successes. Finally, the ability of ‘walking away’ does not legally relieve an organiser from the obligations the host has against third parties, as the majority of contracts are not involving the IOC. Finally, many local stakeholders may have invested in the preparation of the Games, hence they shall lose the business opportunity.
Conclusion
This study extended the original study of Flyvbjerg et al. (Citation2020). The main effort was to add context and adjust assumptions, thus identifying six misperceptions about Olympic cost overruns. With respect to the results of the study of those authors, this paper found many differences and ambiguities, most of which are based on a fundamentally different understanding of the budgets to be considered, complexity of the event, and costs of Olympic Games. Nevertheless, it became clear that Olympic Games have severe cost overruns, but the present paper casts doubt on both the literal findings and the broader implications of the original Oxford Study (Flyvbjerg and Stewart Citation2012).
The re-analysis that was undertaken has not altered the original design; however, it has suggested a better method in using an Olympic infrastructure basket (such as in economics) and has introduced greater contrast than the data and statistics from the Oxford Study. It provides a precise connection to the reality of bidding, politics, and host city contracting, thus permitting a more relevant and realistic interpretation of the results.
The main results of this paper are based on a deeper data research and triangulation of data for the past 10 Olympic Games (2000–2018). These put the results of the Oxford Study in question and serve to inform future host cities about cost overruns that are inherent in the preparation of each Olympic Games. By working with the identical sources, it became obvious that the Oxford Study database has inconsistencies. Besides some missing data (i.e., Bid books), different sources were used for the calculation of the ‘costs of the Games’ and ‘cost overruns’. Some costs included indirect non-OCOG costs (general urban development) while others did not include the full set of direct non-OCOG costs. The most serious concerns arose when noting that the candidature file data included a different bundle of projects to what was reported in the final report data. This obviously explains the partial appearance of extreme values.
Even though the replication of the Oxford study results was not achieved in the present study, cost overruns were found. From the past eight Games, two had even greater cost overruns than are stated in the Oxford Study. All Games had cost overruns in their direct non-OCOG budget, but on average they were much lower (13–178%, Preuss et al. Citation2019) than those of Flyvbjerg et al. (2000; 170–750%).
The attempt by Flyvbjerg et al. (Citation2020) to prove an effect of the Games on GDP growth is misleading. The data (Preuss et al. Citation2019) show that Olympics are too small to severely impact on the GDP and if this would be the case then it would be a positive impact due to the additional economic activity. The fact that, on average, the GDP growth decreases after awarding the Games is a lucky coincidence because anti-cyclical economic policy demands that state investments are to be made during recessions, in order to support the economy.
The statistics and interpretation of cost overruns of Flyvbjerg et al. (Citation2020), that are described by a power-law function (fat-tail), have two major shortcomings. Firstly, the extreme data (producing the fat-tail) are from Rio 2016, Sochi 2014, London 2012, Montreal 1976, and Lake Placid 1980. They are based on unreliable data, which are sometimes mixed in with indirect non-OCOG costs and specific politics. Secondly, the basis for taking cost overruns in one distribution is not given, thus one can assume that the found function is purely coincidental.
The project ‘Olympic Games’ consists of hundreds of smaller projects that are more or less related to the Olympic Games. The responsibility for financing is in different hands. The political desire to use the Games for urban renewal, the susceptibility to corruption in construction, and the sports infrastructure already in place in a city vary so much from country to country, that there is no basis for comparing costs or cost overruns. Thus, the basis for the assumption that there is a ‘risk for increasingly higher cost overruns with a high probability’ is not given.
The caveat is that the reasons for cost overruns, which are discussed in the Oxford Study, are actually partially correct. Irreversibility and fixed deadlines are reasons that cause cost overruns. However, lifting these would mean greater costs for the sports movement and the host, as can be seen by the postponement of Tokyo 2020. The long planning horizon also adds to cost overruns, as costs can only be safely forecast for a period of 2–3 years and Olympic Games need at least 3–5 years (for infrastructure), and eight years for the operation of the Games. The argumentation of blank cheques cannot be followed because the IOC has no power, other than that which is fixed in the HCC, and that only binds the host to keeping its promise. It is noteworthy that the HCC gets adjusted from one Games to another and tight coupling is no longer the fact, nor can it be seen as an accelerator for cost overruns. As the long-term planning horizon is inherent in such a mega project, the IOC, host city, and partners constantly renegotiate changes to lower the costs. The Eternal Beginner argument may be true for the OCOG, but it is certainly not true for the venue and the general construction projects, as every city has already been doing that for centuries.
The interpretation of the suspicious statistical results and the six management suggestions of the Oxford Study are made on assumptions that are partly outdated and are partly disregarding the interests of other stakeholders.
Acknowledgments
The author has no conflict of interest in this paper. There is no funding by any OCOG, host city, or the IOC. The author thanks Wladimir Andreff, emeritus Professor Paris I Panthéon Sorbonne for discussion and his thoughts. I also thank Maike Weitzmann for doublechecking the calculations and Andreas Runkel for helping with the data on GDP growth.
Disclosure statement
No potential conflict of interest was reported by the author(s).
References
- Ahiaga-Dagbui, D.D. and Smith, S.D., 2014. Rethinking construction cost overruns: cognition, learning and estimation. Journal of financial management of property and construction, 19 (1), 38–54. doi:https://doi.org/10.1108/JFMPC-06-2013-0027
- Andreff, W., 2012. The winner’s curse: why is the cost of sports mega-events so often underestimated? In: W. Maennig and A. Zimbalist, eds. International handbook on the economics of mega sporting events. Cheltenham: Edward Elgar, 37–69.
- Ansar, A., et al., 2014. Should we build more large dams? The actual costs of hydropower megaproject development. Energy Policy, 69, 43–56. doi:https://doi.org/10.1016/j.enpol.2013.10.069
- Balfousia-Savva, S., et al., 2001. The economic effects of the athens Olympic Games. In: Centre of planning and economic research, Athens.
- Block, J. and Kuckertz, A., 2018. Seven principles of effective replication studies: strengthening the evidence base of management research. Management review quarterly, 68 (4), 355–359. doi:https://doi.org/10.1007/s11301-018-0149-3
- Bondonio, P. and Campaniello, N., 2006. Torino 2006: what kind of olympic winter games were they? A preliminary account from an organizational and economic perspective. Olympika, 15, 355–380.
- Budzier, A. and Flyvbjerg, B., 2011. Double whammy – how ict projects are fooled by randomness and screwed by political intent, Working Paper, Saïd Business School, University of Oxford, August 2011.
- DCMS (Department for Culture, Media and Sport), 2012. London 2012 Olympic and Paralympic Games Quarterly Report Oct 2012, London.
- Dubi, C., 2017. Letter to POCOG president Lee, Ref. No 2017 /CHD/LHD, March 27th, typoscript.
- Dubi, C., 2021. Letter to head of Olympic study centre, maria bogner. May 11th, typoscript.
- Essex, S. and Chalkley, B., 2004. Mega-sporting events in urban and regional policy: a history of the Winter Olympics. Planning Perspectives, 19 (2), 201–232. doi:https://doi.org/10.1080/0266543042000192475
- Flyvbjerg, B., 2011. Over budget, over time, over and over again: managing major projects. In: P.W.G. Morris, J.K. Pinto, and J. Söderlund, eds. The oxford handbook of project management. Oxford: Oxford University Press, 321–344.
- Flyvbjerg, B., Budzier, A., and Lunn, D., 2020. Regression to the tail: why the Olympics blow up. Environment and planning a: economy and space. doi:https://doi.org/10.1177/0308518X20958724
- Flyvbjerg, B. and Stewart, A., 2012. Olympic Proportions: cost and Cost Overrun at the Olympics 1960-2012, Saïd Business School working papers. Said Business School.
- Flyvbjerg, B., Stewart, A., and Budzier, A., 2016. The oxford olympics study 2016: cost and cost overrun at the games. Saïd Business School Research papers. Said Business School.
- Fort, R., 2010. Observation, replication, and measurement in sports economics. Journal of Sports Economics, 11 (1), 3–16. doi:https://doi.org/10.1177/1527002509354889
- Funk, D.C., 2017. Introducing a sport experience design (SX) framework for sport consumer behaviour research. Sport management review, 20 (2), 145–158. doi:https://doi.org/10.1016/j.smr.2016.11.006
- HCC, 2016. Explanatory notes to host city contract 2024 – principles. Retrieved 25.11.2021. www.uniglobalunion.org/sites/default/files/imce/host_city_contract_2024_-_principles.pdf
- Invernizzi, D.C., Locatelli, G., and Brookes, N.J., 2018. Cost overruns – helping to define what they really mean. Proceedings of the ICE - Civil Engineering, 171 (2), 85–90.
- IOC, 2018. Olympic Agenda 2020: the new norm. PyeongChang. Retrieved 10.10.2020 at https://stillmed.olympic.org/media/Document%20Library/OlympicOrg/News/2018/02/2018-02-06-Olympic-Games-the-New-Norm-Report.pdf
- Jackson, S. 2002. Project cost overruns and risk management. In Greenwood, D., Proceedings of the 18th Annual ARCOM Conference 2-4 September 2002, University of Northumbria. Association of Researchers in Construction Management, 24 September 2002. Vol. 1, 99–108. Newcastle: Northumbria.
- Jennings, W., 2012. Why costs overrun: risk, optimism and uncertainty in budgeting for the London 2012 Olympic games. Construction management and economics, 30 (6), 455–462. doi:https://doi.org/10.1080/01446193.2012.668200
- Kasimati, E. and Dawson, P., 2009. Assessing the impact of the 2004 olympic games on the Greek economy: a small macroeconometric model. Economic modelling, 26 (1), 139–146. doi:https://doi.org/10.1016/j.econmod.2008.06.006
- Lind, H. and Brunes, F., 2015. Explaining cost overruns in infrastructure projects: a new framework with applications to Sweden. Construction management and economics, 33 (7), 554–568. doi:https://doi.org/10.1080/01446193.2015.1064983
- London 2012 olympic games: the official report, organising committee for the olympic and paralympic games in London in 2012, London: LOCOG.
- Love, P.E.D., 2011. ‘Plugging the gaps’ between optimum bias and strategic misrepresentation and infrastructure cost overruns. Procedia engineering, 14, 1197–1204. doi:https://doi.org/10.1016/j.proeng.2011.07.150
- Madden, J., 2006. Economic and fiscal impacts of mega sporting events: a general equilibrium assessment. Public finance and management, 6, 346–394.
- Papanikos, G., 1999. Tourism Impact of the 2004 Olympic Games. Athens: Tourism Research Institute.
- Preuss, H., Andreff, W., and Weitzmann, M., 2019. Cost and Revenue Overruns of the Olympic Games 2000-2018. Wiesbaden: SpringerGabler Verlag.
- Preuss, H. and Schnitzer, M., 2015. Organization costs for a FIFA world cup and their significance during a bid. Event management, 19 (1), 57–72. doi:https://doi.org/10.3727/152599515X14229071392981
- Preuss, H. and Solberg, H.A., 2006. Attracting major sporting events: the role of local residents. European sport management quarterly, 6 (4), 391–411. doi:https://doi.org/10.1080/16184740601154524
- Price, J. and Wolfers, J., 2012. Biased Referees?: reconciling Results with the NBA’s analysis. Contemporary economic policy, 30 (3), 320–328. doi:https://doi.org/10.1111/j.1465-7287.2011.00268.x
- TOCOG, 2007. Official Report. Vol 2., retrieved 11.10.2020 at www.la84foundation.org
- Vettas, N. ZonZilos, Demian, E., Papdakis, E., Paratsiokas, N., Danchey, S. IOBE (Foundation for Economic and Industrial Research), 2015. The impact of the 2004 Olympic Games on the Greek economy. Athens.
- Von Rekowsky, R., August, 2013. Are the Olympics a golden opportunity for investors? Leadership series: investment insights. Boston: Fidelity Investments,
- Winfree, J.A., 2010. Issues with replicating results in sports economics. Journal of Sports Economics, 11 (1), 48–59. doi:https://doi.org/10.1177/1527002509354892