
Abstract
The annual cost of eculizumab maintenance therapy in paroxysmal nocturnal hemoglobinuria (PNH) and atypical hemolytic–uremic syndrome (aHUS) exceeds $300,000 per patient. A better understanding of eculizumab pharmacokinetics and subsequent individual dose adjustment could reduce this cost. We measured the trough eculizumab concentration in 9 patients with maintenance therapy (aHUS, n = 7; PNH, n = 2) and determined: 1) the intra- and inter-individual variability; 2) the influence of weight on eculizumab pharmacokinetics; and 3) the rate of elimination of eculizumab following discontinuation. A one-compartment model was developed to describe the pharmacokinetics of eculizumab and predicted complement activity by body weight. Trough eculizumab concentrations were >50 µg/mL in 9/9, >100 µg/mL in 8/9, and >300 µg/mL in 5/9 of patients. Intra-individual variability was low but eculizumab concentrations, closely correlated with patient weight (R2 = 0.66, p = 0.034), varied broadly (55 ± 12 to 733 ± 164 µg/mL). Pharmacokinetic modeling showed that the elimination half-life varied greatly, with an increase from 7.8 d in a patient weighing 100 kg to 19.5 d in a 40 kg patient. We predicted that infusions of 1200 mg could be spaced every 4 or 6 weeks in patients weighing <90 and <70 kg, respectively. In this pilot study, the current recommended use of a fixed eculizumab dose for maintenance therapy is associated with excessively high trough concentrations in many patients. Further prospective larger studies are now required to support an individualized schedule adjusted for patient weight and based on the observed trough serum eculizumab concentration.
Abbreviations
| PNH | = | paroxysmal nocturnal hemoglobinuria |
| aHUS | = | atypical hemolytic–uremic syndrome |
| ELISA | = | enzyme-linked immunosorbent assay |
| CH50 | = | hemolytic complement activity. |
Introduction
Eculizumab (Soliris®, Alexion Pharmaceuticals) is a humanized monoclonal antibody that binds with high affinity to complement protein C5. It prevents the formation of the membrane attack complex and could inhibit the release of C5a, a powerful inflammatory mediator. The latter effect is still under dispute.Citation1-3 The original indication for eculizumab was paroxysmal nocturnal hemoglobinuria (PNH), but the drug subsequently received approval for atypical hemolytic–uremic syndrome (aHUS) from the U.S. Food and Drug Administration (FDA) and the European Medicines Agency (EMA).Citation4,5 Eculizumab is highly effective in both of these chronic diseases, with no evidence of cumulative toxicity when used for several years, hence treatment is rarely discontinued once patients have been established on the drug.Citation6,7 However, the therapy is very expensive, with an annual per patient drug cost of ≤327,600 (US $645,000) for an adult in the United Kingdom, 381,612€ (US $573,720) in France and $350,000 in the United States.Citation8,9 Therefore, the optimization of eculizumab administration and, in particular, an accurate determination of the minimum effective dose, is extremely important in economic terms.
Eculizumab monitoring is currently based on hemolysis biomarkers (i.e., lactate dehydrogenase and haptoglobin levels) and complete inhibition of complement activity. While such efficacy biomarkers show whether the treatment is working or not, they do not indicate whether eculizumab is given in excess to the patients, and do not provide any useful information as to whether a reduction in dose or further spacing of infusions could be safely considered. Measurement of the trough eculizumab concentration could facilitate the calculation of a minimum effective dose on an individual patient basis. To date, no published study and no regulatory agency has indicated the minimum trough concentration required to completely inhibit complement-mediated hemolysis, but targets of 50 and 35 µg/mL have been reported for aHUS and PNH, respectively.Citation5-10
We therefore aimed to measure the trough eculizumab concentration in patients with aHUS and PNH, in order to determine intra- and inter-variability of eculizumab pharmacokinetics and determine whether eculizumab dosing could be adapted on an individual patient basis, leading to a potentially significant reduction in treatment costs.
Results
Patient characteristics
In this retrospective study, the trough eculizumab concentration was measured in 9 adult patients (median age 40.9 years, range 23.9–67.0 years). Baseline characteristics and eculizumab concentrations are reported in . All patients were Caucasian and 7/9 were female. Seven patients, (Patients 1–7) received eculizumab for aHUS; 2 (Patients 6 and 7) had undergone kidney transplantation. It should be noted that Patient 6 experienced kidney graft loss because of disease recurrence despite plasma exchange treatment. Four patients carried a mutation in complement factor H gene and one patient had a C3 gene mutation. None had anti-factor H antibodies. All patients demonstrated disease control, except for Patient 8, in whom hemolysis and thrombocytopenia persisted, although hemolytic complement activity was not detectable. Eculizumab was discontinued in this patient in 2013, following 15.5 months of treatment.
Table 1. Clinical and biological patient characteristics
Eculizumab pharmacokinetics
Sera were mainly collected during maintenance therapy. Additionally, eculizumab concentrations were measured during the induction period in 2 patients with aHUS (Patients 1 and 7). In these 2 patients, trough eculizumab concentration was >100µg/mL during the first month.
Analysis of eculizumab pharmacokinetics during maintenance treatment allowed us to estimate trough and maximal concentrations, and intra-individual and inter-individual eculizumab variability (). Intra-individual variations were low, with a coefficient of variation ≤ 25% (18.4 ± 4.6%). By contrast, inter-individual variability was high. Indeed, trough eculizumab concentration ranged from 55 ± 12 to 733 ± 164 µg/mL, with a coefficient of variation of 63%. As shown in , the mean trough eculizumab concentration was >50 µg/mL in 9/9 (100%) of patients, >100 µg/mL in 8/9 (88.9%) of patients and >300 µg/mL in 5/9 (55.6%) of patients. As expected, trough eculizumab concentration was lower in patients with PNH than in aHUS patients, since the former received a lower dose of eculizumab (900 vs. 1200 mg every 2 weeks). In seven patients treated for aHUS, the mean trough eculizumab concentration ranged from 43.8 to 947.0 µg/mL (408.8 ± 187.7 µg/mL), with an inter-individual coefficient = 45.9%. If the cut-off value for trough eculizumab concentration associated with complete complement inhibition is 50 µg/mL,Citation5 then the observed mean trough concentrations were 7.2 times greater than the reference value in these patients. In Patient 4, the heaviest patient in the study, trough eculizumab concentration ranged from 50 to 100 µg/mL. Contrastingly, trough eculizumab concentration was >300 µg/mL in the 6 patients whose weight was <65 kg. Weight is a classical parameter explaining inter-individual variability, and it has previously been suggested that recommended doses may not be sufficient in heavy patients.Citation11 In our 7 aHUS patients, trough eculizumab concentration during a maintenance regimen was inversely correlated with weight (; R2 = 0.66, p = 0.034).
Figure 1. Trough free serum eculizumab concentration correlated with weight in patients with atypical hemolytic–uremic syndrome (aHUS).
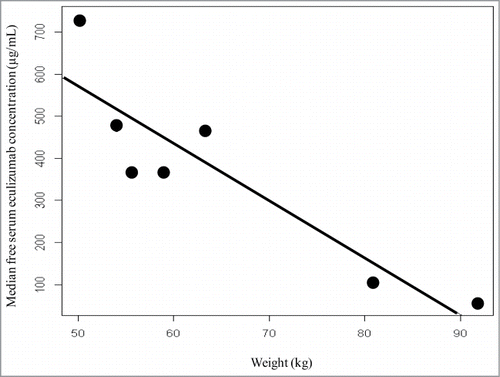
Table 2. Serum free eculizumab trough concentrations
Eculizumab clearance
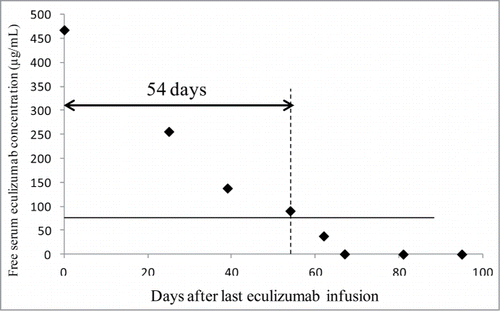
The high trough eculizumab concentrations found in several patients are likely to have an economic impact, the degree of which is mainly dependent on the elimination rate of eculizumab. Preliminary data were obtained for Patient 2 after discontinuation of eculizumab (). Free eculizumab concentration was 90 and 38 µg/mL at 54 and 62 d after eculizumab discontinuation, respectively. Considering a target of 50 µg/mL, the interval between infusions could have been extended to almost 2 months in this patient.
Figure 2. Decrease in free serum eculizumab concentration in patient 2 after eculizumab was discontinued.
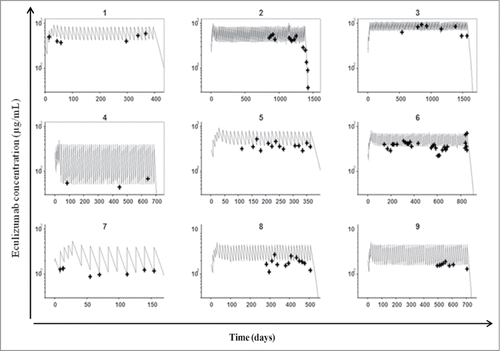
To describe the pharmacokinetics of eculizumab, we developed a one-compartment model with both first-order and Michaelis–Menten rates. The model was able to satisfactorily describe eculizumab pharmacokinetics (). The volume of distribution, clearance, maximum saturable elimination rate and Michaelis constant were estimated (relative standard error) at 3.2 L (10%), 0.18 L/day (7%), 5.0 mg/L/day (4%) and 1.1 mg/L (33%), respectively. Inter-individual standard deviations for volume of distribution and clearance (relative standard error) were 15.0% (4.4%) and 14.6% (3.7%), respectively. The inter-individual standard deviation for maximum saturable elimination rate and the Michaelis constant could not be accurately estimated, and were therefore fixed to 0. Proportional standard deviations were 0.25 (1.6%).
Figure 3. Pharmacokinetic estimation of free eculizumab concentration. Observed (crosses) and model-predicted (lines) trough eculizumab concentrations as a function of time for the 9 study patients.
As often reported for therapeutic antibodies,Citation12 clearance was significantly related to body weight (βWT = 2.5, p<0.0001). Finally, the elimination half-life in a medium-weight (63 kg) patient was estimated at 12.4 days, but was observed to fall from 19.5 to 7.8 d with a body weight increase from 40 to 100 kg.
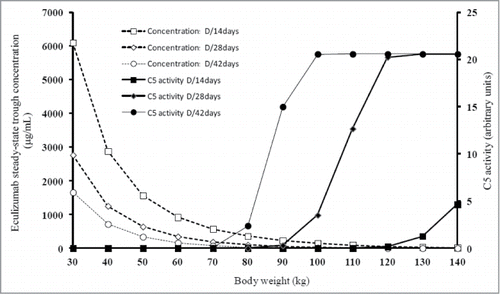
Following this, we predicted eculizumab concentrations and complement activity in relation to body weight (). We observed that an infusion of 1200 mg every 14 d maintained null complement activity in patients weighing less than 120 kg. We therefore predicted complement activity with infusions of 1200 mg spaced every 4 and 6 weeks. Keeping in mind the goal of fully blocking complement activity between eculizumab infusions, it appeared possible to space the infusions to 4 weeks in patients weighing less than 90 kg and 6 weeks in patients under 70 kg.
Figure 4. Prediction of eculizumab concentrations and complement activity. Simulations of steady-state trough eculizumab concentrations (broken lines) and complement activity (bold lines) according to body weight for a 1200 mg maintenance dose given every 14 d (squares), every 28 d (diamonds) and every 42 d (circles).
Discussion
This is one of the first studies specifically reporting the pharmacokinetics of eculizumab during the maintenance phase. The small intra-individual variability and large inter-individual variability support the idea that therapeutic drug monitoring could help with adaptation of the dose or frequency of administration of eculizumab, with a view to achieving appropriate trough levels, at least during the maintenance period. Our study indicated that a fixed dosing schedule for eculizumab is associated with excessively high trough concentrations in the majority of patients, hence we propose a weight-based schedule to maintain permanent and fully blocking complement activity.
Of the 7 patients with aHUS, 5 had mean trough eculizumab concentrations above 300 µg/mL. In two trials assessing the efficacy of eculizumab in aHUS, Legendre et al. reported mean trough eculizumab concentrations in adults during the maintenance period of 149 µg/mL and 214 µg/mL.Citation5 These results are much lower than those observed in our study (409 µg/mL). However, maximum values and patients´ weights were not reported and therefore cannot be compared with our patients. It must be noted that our study was carried out on a small number of patients, insufficient to constitute a representative cohort. However, the volume of distribution was not greatly overestimated, suggesting that our enzyme-linked immunosorbent assay (ELISA) did not overestimate eculizumab concentrations. Otherwise, the eculizumab concentrations observed in the 2 PNH patients during the maintenance period were similar to those previously published in adults.Citation4 Recently a pilot study in 7 pediatric patients (aged from 11 to 17 years) weighing less than 70 kg (48 to 68 kg) has been published. In agreement with our results, trough eculizumab concentrations were >100 µg/mL in all patients and very variable, reaching about 400 µg/mL in one child.Citation13
Complement activity is the biomarker currently used to determine eculizumab efficiency, even though recent, new tools, such as the measurement of in vitro endothelial complement inhibition, seem worth exploring.Citation9 During our assessment of the concentration-effect relationship of eculizumab no liposome lysis was detected when the eculizumab concentration was ≥20 µg/mL. This indicates that, despite its common use, this assay is not sensitive enough and does not detect slightly underexposed patients. By contrast, we established a clearer relationship between the in vitro C5b-9 complex formation detected by ELISA and eculizumab concentration. A full blockade of the complement cascade was obtained for free eculizumab concentrations higher than a threshold of between 44 and 59 µg/mL, in accordance with the previously proposed target.Citation5
The results show a major effect of body weight on eculizumab trough levels, in fact this was the main determinant of the inter-individual variability within our study patient group. Trough eculizumab concentrations were inversely correlated with weight. Clearance was also significantly related to body weight, with decreased body weight being accompanied by decreased clearance and therefore extended elimination half-life, as has often been reported for therapeutic antibodies.Citation12 As a consequence, all patients weighing <70 kg had free eculizumab concentrations above 300 µg/mL. Currently, schedules using fixed doses of eculizumab are in use worldwide for both PNH and aHUS. Such a strategy, which makes no adjustment for patient weight, could and probably should be challenged. Since drug elimination was not linear, it could be predicted that reducing the individual dose would be a better strategy than increasing the dosing interval, in order to maintain a trough concentration of 50 µg/mL, while keeping the quantity of eculizumab administered to a minimum. However, the packaging of eculizumab limits such an approach because the 300 mg vials cannot be easily divided and stored for future infusions. Taking into account this constraint, the following weight-based schedule could be proposed: 90 to 120 kg: 1200 mg every 2 weeks; 70 to 90 kg: 1200 mg every 4 weeks; <70 kg: 1200 mg every 6 weeks. It should be noted that 1200 mg every 2 weeks might not be sufficient to obtain a total blockade of C5 cleavage. Recently, Cugno et al. spaced infusions at intervals of every 3 or 4 weeks in stable patients, with complete inhibition of complement (measured using the Wieslab Complement System).Citation14 They showed that complement activity was completely suppressed in all patients when infusions were spaced at 3 week intervals. This was still the case for most patients when the infusions were performed every 4 weeks. No biological disease activity was observed in these patients. Greatly reduced dosing and hence cost may therefore be considered for patients weighing < 90 kg.
Admittedly, our pilot study involved a small number of patients, PNH and aHUS being rare diseases. The biological procedures used also need to be tested over time and fully validated. However, these preliminary results provide a basis for therapeutic drug monitoring and suggest potential economic benefit by reducing or spacing the doses, which warrants performing a multicenter study. Finally, the relationship between eculizumab concentration and complement blockade, assessed by using different assays and by measurement of disease activity, should be further evaluated in larger studies. This would enable the validation of a new body weight based dosing schedule for the maintenance phase.
In conclusion, the use of a fixed eculizumab dose for maintenance therapy in PNH and aHUS is likely to be associated with an excessive trough concentration in many patients, particularly those of low body weight. Given the high cost of treatment, it seems probable that major cost savings could be achieved by using therapeutic drug monitoring to tailor the dose of eculizumab to individual patient needs, thus avoiding potentially unnecessary and excessive use of the drug and reducing the risk of side effects. However, results of this pilot study should now be confirmed in larger cohorts of PNH and aHUS patients.
Patients and Materials/Methods
Patient selection
Nine adult patients who received eculizumab for aHUS or PNH were identified in the nephrology and hematology units of the Tours University Hospital, France. Eculizumab was administered according to the standard manufacturer´s recommendations. Patients with PNH and aHUS received a weekly injection of 600 and 900 mg eculizumab, respectively, during the first 4 weeks of therapy, followed by a dose of 900 and 1200 mg, respectively, in the fifth week. These higher doses were subsequently continued as maintenance therapy every 2 weeks. All patient files were reviewed for adherence to the protocol, and clinical and biological data were collected.
As recommended, total hemolytic complement activity (CH50) was regularly measured just prior to the infusion of eculizumab and the 97 serum samples obtained were stored at −80°C. The eculizumab concentration was measured in all samples. Moreover, one patient (Patient 6) agreed to repeat blood sampling between 2 of the infusions and written informed consent was obtained for this. Additionally, serum samples were collected after eculizumab discontinuation in a further patient (Patient 2). These measurements provided essential information about eculizumab clearance.
Measurement of eculizumab trough levels
The trough eculizumab concentration in the serum samples was measured by an ELISA specifically developed in our laboratory for this purpose. The plates (NuncPolysorp F96, ThermoFisher, ref. 10449672) were coated with 100 µL of purified human complement component C5 (Quidel, ref. A403) at a concentration of 2 µg/mL and incubated for 16 hours at 4°C in a carbonate buffer. After three washes with 300 µL of phosphate-buffered saline (PBS, ref. 20452335)-0.05% Tween, 200µL of PBS–1% BSA (Sigma Aldrich, ref. A7030) was added and the plates were incubated for 90 minutes at room temperature. The patient sera were diluted to 1:20 or 1:40 and incubated for 30 minutes at room temperature, together with standards (0.5, 1, 5, 10, 25, 35 and 50 µg/mL eculizumab) and controls. The standard curve was prepared in fetal calf serum (Fisher, ref. M3381D) and not in human normal serum (the expected normal biological matrix) since circulating bovine C5 is not recognized by eculizumab (www.freepatentsonline.com/6355245.html) and hence does not interfere with the measurement. The controls, however, were prepared by spiking pooled sera from 75 healthy blood donors (male: 55%, mean age: 43.4 ± 13.4 years) provided by EFS (Etablissement Français du Sang, Tours, France) with different eculizumab concentrations. After three washes, an anti-human IgG goat F(ab')2 coupled with peroxidase (Sigma Aldrich, ref. A2290) was added at a 1:3500 dilution in PBS 1% BSA. Revelation was performed using Ortho-Phenylene Diamine (Sigma Aldrich, ref. P9187) for 30 minutes and stopped with a 4N H2SO4 solution before automated reading using the Evolis 6370 (BioRad, Marnes-la-Coquette, France). No false-positive responses were observed on testing the serum from 30 healthy donors and from 30 patients with autoimmune diseases.
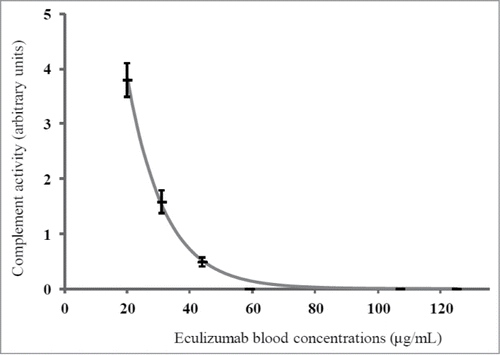
To study the relationship between inhibition of complement activity and free eculizumab concentration, pooled sera from healthy blood donors was spiked in order to obtain 7 samples with eculizumab concentrations ranging from 20 to 166 µg/mL. Complement activity was determined by measurement of liposome lysis (CH50 SPAPLUS®, The Binding Site), which is our routine method of monitoring patients, and by an ELISA kit that detects the final C9 neoantigen that is formed when the complete pathway has been activated (Diasorin, Stillwater, ref. 6300). The latter method was used because of higher accuracy in detecting low to moderate depression of complement activity; with this method the blockage of complement activity was considered as complete when complement activity was <0.5 U/mL (normal range 63–145 U/mL), corresponding to CH50 <10%.Citation12,15 Complement activity was found to be abolished in all samples containing eculizumab when using the liposome technique but was detectable using ELISA when the eculizumab concentration was <59 µg/mL. The relationship between free eculizumab concentration and complement activity was described using regression technique as follows: A = β0 × exp(β1 × C), where A is complement activity, C is eculizumab concentration, and β0 and β1 are the model parameters to be estimated. The relationship between complement activity and free eculizumab concentration was A = 20.6 × exp (− 0.084 × C), as shown in .
Figure 5. Relation between measured free serum eculizumab concentration and complement activity. Complement activity was measured using ELISA (Diasorin), and was expressed in arbitrary units. Measurements were performed in triplicate. The relationship between eculizumab concentrations and complement activity was described using regression technique (gray line).
Pharmacokinetic study
The eculizumab serum concentration was analyzed by population pharmacokinetic modeling with Monolix 4.3.2 (Lixoft, Orsay, France). All free eculizumab concentrations were used to establish the model. The process of population pharmacokinetic modeling is detailed in supplementary data. Briefly, one and 2-compartment models with first-order distribution and an elimination rate constant were tested. To account for a possible target-mediated elimination of eculizumab, we added a Michaelis-Menten elimination term.Citation16 The inter-individual (η) and residual (ε) variability of the pharmacokinetic variables (e.g., volume of distribution and elimination rate constant) were described with exponential and proportional models, respectively. Owing to the small number of patients, only one covariate was tested. Since body weight has been reported to influence the pharmacokinetics of therapeutic antibodies,Citation17 we tested weight as a covariate as follows: ln(θi) = ln(θ) = βWT. (WT/med(WT)), where θ is a given pharmacokinetic parameter, WT is body weight, med(WT) is median body weight in the population and βWT quantifies the effect of WT on θ. The influence of BW was assessed by a likelihood ratio χ2 test; BW was kept in the final model on each pharmacokinetic parameters for which influence of BW was significant for α = 0.02. In addition, we calculated the elimination half-life (T1/2), independent of the eculizumab target, for a medium weight patient as follows: T1/2 = ln(2)/V/CL.
Prediction of eculizumab concentrations and complement activity
Using eculizumab pharmacokinetics and the models describing the relationship between eculizumab concentration and complement activity, steady-state eculizumab concentrations and complement activity were computed for a 1200 mg maintenance dose given 1) every 14 days, 2) every 28 d and 3) every 42 days, for body weights ranging from 30 to 140 kg. For each body weight value, the maximum spacing of infusions giving null complement activity was considered.
Disclosure of Potential Conflicts of Interest
No potential conflicts of interest were disclosed.
Supplemental Material
Supplemental data for this article can be accessed on the publisher's website.
Supplemental_Material.docx
Download MS Word (63.6 KB)Acknowledgments
We are grateful to Aurore Gibaud who did technical experiments. We thank Laura Smales (BioMedEditing, Toronto, Canada) for her initial editing of the manuscript.
Funding
This work was supported by the French Higher Education and Research ministry under the program “Investissements d'avenir” Grant Agreement: LabEx MAbImprove ANR-10-LABX-53–01.
References
- Thomas TC, Rollins SA, Rother RP, Giannoni MA, Hartman SL, Elliott EA, Nye SH, Matis LA, Squinto SP, Evans MJ. Inhibition of complement activity by humanized anti-C5 antibody and single-chain Fv. Mol Immunol 1996; 33:1389-401; PMID:9171898; http://dx.doi.org/10.1016/S0161-5890(96)00078-8
- Rother RP, Rollins SA, Mojcik CF, Brodsky RA, Bell L. Discovery and development of the complement inhibitor eculizumab for the treatment of paroxysmal nocturnal hemoglobinuria Nat Biotechnol 2007; 25:1256-64; PMID:17989688; http://dx.doi.org/10.1038/nbt1344
- Burwick RM, Burwick NR, Feinberg BB. Eculizumab fails to inhibit generation of C5a in vivo. Blood 2014; 124:3502-3; PMID:25431478; http://dx.doi.org/10.1182/blood-2014-07-589366
- Hillmen P, Young NS, Schubert J, Brodsky RA, Socié G, Muus P, Röth A, Szer J, Elebute MO, Nakamura R, et al. The Complement Inhibitor Eculizumab in Paroxysmal Nocturnal Hemoglobinuria. N Engl J Med 2006; 355:1233-43; PMID:16990386; http://dx.doi.org/10.1056/NEJMoa061648
- Legendre CM, Licht C, Muus P, Greenbaum LA, Babu S, Bedrosian C, Bingham C, Cohen DJ, Delmas Y, Douglas K,. Terminal Complement Inhibitor Eculizumab in Atypical Hemolytic–Uremic Syndrome. N Engl J Med 2013; 368:2169-81; PMID:23738544; http://dx.doi.org/10.1056/NEJMoa1208981
- Hillmen P, Muus P, Röth A, Elebute MO, Risitano AM, Schrezenmeier H, Szer J, Browne P, Maciejewski JP, Schubert J, et al. Long-term safety and efficacy of sustained eculizumab treatment in patients with paroxysmal nocturnal haemoglobinuria. Br J Haematol 2013; 162:62-73; PMID:23617322; http://dx.doi.org/10.1111/bjh.12347
- Fakhouri F, Delmas Y, Provot F, Barbet C, Karras A, Makdassi R, Courivaud C, Rifard K, Servais A, Allard C, et al. Insights from the use in clinical practice of eculizumab in adult patients with atypical hemolytic uremic syndrome affecting the native kidneys: an analysis of 19 cases. Am J Kidney Dis 2014; 63:40-8; PMID:24021908; http://dx.doi.org/10.1053/j.ajkd.2013.07.011
- Editor MBH. Health chiefs refuse to pay for lifesaving kidney treatment [Internet]. The Times. [cited 2014 Aug 3]. Available at: http://www.thetimes.co.uk/tto/health/news/article3775905.ece
- Noris M, Galbusera M, Gastoldi S, Macor P, Banterla F, Bresin E, Tripodo C, Bettoni S, Donadelli R, Valoti E, et al. Dynamics of complement activation in atypical HUS and how to monitor eculizumab therapy. Blood 2014; 124: 1715-26; PMID:25037630; http://dx.doi.org/10.1182/blood-2014-02-558296
- Nishimura J, Yamamoto M, Hayashi S, Ohyashiki K, Ando K, Brodsky AL, Noji H, Kitamura K, Eto T, Takahashi T, et al. Genetic Variants in C5 and Poor Response to Eculizumab. N Engl J Med 2014; 370:632-9; PMID:24521109; http://dx.doi.org/10.1056/NEJMoa1311084
- Ring T. Eculizumab in Atypical Hemolytic–Uremic Syndrome. N Engl J Med 2013; 369: 1377-80; PMID:24088106; http://dx.doi.org/10.1056/NEJMc1308826
- Jaskowski TD, Martins TB, Litwin CM, Hill HR. Comparison of three different methods for measuring classical pathway complement activity. Clin Diagn Lab Immunol 1999; 6:137-9; PMID:9874678
- Reiss U, Schwartz J, Sakamoto K, Puthenveetil G, Ogawa M, Bedrosian CL, Ware RE. Efficacy and safety of eculizumab in children and adolescents with paroxysmal nocturnal hemoglobinuria: Eculizumab in Children with PNH. Pediatr Blood Cancer 2014; 61:1544-50; PMID:24777716; http://dx.doi.org/10.1002/pbc.25068
- Cugno M, Gualtierotti R, Possenti I, Testa S, Tel F, Griffini S, Grovetti E, Tedeschi S, Salardi S, Cresseri D, et al. Complement functional tests for monitoring eculizumab treatment in patients with atypical hemolytic uremic syndrome. J Thromb Haemost 2014; 12: 1440-8; PMID:24853860; http://dx.doi.org/10.1111/jth.12615
- Delmas Y, Bordes C, Loirat C, Fremeaux-Bacchi V, Combe C. Post-partum atypical haemolytic-uraemic syndrome treated with eculizumab: terminal complement activity assessment in clinical practice. Clin Kidney J 2013; 6: 243-4; PMID:26019860; http://dx.doi.org/10.1093/ckj/sfs185
- Gibiansky L, Gibiansky E. Target-mediated drug disposition model: relationships with indirect response models and application to population PK-PD analysis. J Pharmacokinet Pharmacodyn 2009; 36: 341-51; PMID:19578985; http://dx.doi.org/10.1007/s10928-009-9125-9
- Dirks NL, Meibohm B. Population pharmacokinetics of therapeutic monoclonal antibodies. Clin Pharmacokinet 2010; 49:633-59; PMID:20818831; http://dx.doi.org/10.2165/11535960-000000000-00000