 ?Mathematical formulae have been encoded as MathML and are displayed in this HTML version using MathJax in order to improve their display. Uncheck the box to turn MathJax off. This feature requires Javascript. Click on a formula to zoom.
Abstract
Highly concentrated antibody solutions often exhibit high viscosities, which present a number of challenges for antibody-drug development, manufacturing and administration. The antibody sequence is a key determinant for high viscosity of highly concentrated solutions; therefore, a sequence- or structure-based tool that can identify highly viscous antibodies from their sequence would be effective in ensuring that only antibodies with low viscosity progress to the development phase. Here, we present a spatial charge map (SCM) tool that can accurately identify highly viscous antibodies from their sequence alone (using homology modeling to determine the 3-dimensional structures). The SCM tool has been extensively validated at 3 different organizations, and has proved successful in correctly identifying highly viscous antibodies. As a quantitative tool, SCM is amenable to high-throughput automated analysis, and can be effectively implemented during the antibody screening or engineering phase for the selection of low-viscosity antibodies.
Monoclonal antibodies (mAbs) are one of the most common classes of biopharmaceutical molecules, and it is expected that new mAbs will continue to be discovered and developed for treating human diseases. Because most mAb-based therapies require parenteral (intravenous or subcutaneous) administration, highly concentrated antibody solutions (> 100 mg/mL) are often needed to achieve therapeutically relevant dosing of mAbs in a small injection volume. End-user convenience is a key requirement for mAb therapeutics indicated for chronic conditions. While development of a high concentration liquid formulation can provide such a convenience to patients through reduced dosage frequency, high concentrations often lead to challenges such as aggregation and solution viscosity. Highly viscous antibodies are difficult to inject via the subcutaneous route (especially in geriatric patients), and are challenging to handle during manufacturing and processing.
In traditional approaches, during formulation development a mechanistic understanding of the observed undesired solution properties like viscosity is undertaken and formulation controls are designed or developed accordingly to control viscosity. In addition, antibody molecules that have high viscosity do not fit into any platform formulation or technologies, and likely require custom formulation or containers, which adds to the resources, cost and time of development. One approach that is gaining wide-spread acceptance by the biopharmaceutical industry to tackle challenges associated with the development of high-concentration liquid formulation is the early identification, screening and engineering of problematic candidate drugs. However, it is not practical or efficient to screen and address high concentration liabilities at the early discovery stage because both resources and material availability are often limited. Development of novel in silico predictive tools or high throughput methods to screen for and reduce or eliminate such problematic candidate is a prerequisite for successful developability studies. While some hypotheses have been proposed regarding the properties of the antibody that are responsible for high viscosity,Citation1-5 there is currently no way of making validated predictions. Thus, whether a given antibody will exhibit high viscosity can only be determined empirically at the later stages.
An approach that can identify highly viscous antibody candidates early in the discovery phase would be highly beneficial in addressing the issue of antibody viscosity. The identified antibody can either be engineered (at the protein sequence level via single or multiple point mutations in such a way that biological activity is retained) or eliminated from the antibody panel so that only antibodies with lower viscosities are moved forward to the development phase.Citation6 In general, limited quantities of antibodies are generated at low concentrations during the discovery or optimization phases; thus, the experimental determination of the viscosity at the therapeutic dose is not feasible early in the development process. In lieu of experimental techniques, computational approaches that identify highly viscous antibodies from their sequence/structure can be efficiently employed in a high throughput manner during discovery and optimization.
In this work, we present a novel, high-throughput, in silico tool, termed spatial charge map (SCM), for identifying highly viscous antibodies from their sequence using homology modeling to obtain 3D structures. This tool is based on a molecular understanding of the origin of viscosity. Several previously published computational approaches have shown promise in the predictive capabilities of electrostatics-based methods for antibody viscosities.Citation2,3,7-9 One such variable fragment (Fv) sequence-based method that incorporates electrostatic-based predictors was recently reported by Sharma et al. Citation9 Their method, which has 4 fitted parameters, calculates viscosities based on 3 parameters: 1) hydrophobicity index, 2) net charge at the formulation pH, and 3) charge symmetry (see Figs. 4–6 in the supporting information for a performance of their method for the experimental dataset used in this report).
Here, we build upon the previously published electrostatics-based methods and develop a quantitative, and thus amenable to automation, score for viscosity prediction. The predictions of this tool against the experimentally measured viscosities of a number of antibodies were validated in collaboration with Novartis, Pfizer and MedImmune.
In general, the viscosity of antibody solutions under physiological conditions is driven by intermolecular (i.e., between antibody molecules) interactions, although the detailed nature of these interactions is not known. For example, short-range interactions (e.g., driven by hydrophobic association) could be a driver for antibody viscosity, or long-range interactions (e.g., driven by electrostatic association) could be a driver for antibody viscosity. Furthermore, viscosity-driving interactions could depend on the antibody solution concentration and other factors such as formulation, temperature, and shear rate. However, for highly concentrated antibody solutions, published studies have suggested a role of electrostatic interactions in antibody viscosity. For example, antibodies have high viscosity near their isoelectric point (pI) values at low ionic strength conditions.Citation2,10 Furthermore, negative charge-based descriptorsCitation1,3,7,9,11 have shown good correlation with the viscosity of highly concentrated solutions.
Following these promising reports, we developed a phenomenological, electrostatics-based model that is fully quantitative and thus amenable to automation and high-throughput analysis, to identify highly viscous antibodies. The SCM tool quantifies (negative) electrostatic patches on the antibody surface using the antibody structure as an input. In our previous work, we demonstrated the application of the spatial summation of residue normalized-hydrophobicity (normalized for the fractional exposed surface area of each residue) to identify aggregation prone regionsCitation12 and to rank antibodies according to their aggregation propensity.Citation13 Here, we compute the spatial summation of residue charge (only for the surface-exposed residues) and demonstrate that this quantity (termed SCM) can be used to identify highly viscous antibodies.
The input to the SCM tool is the 3-dimensional antibody structure. Because the structure of the non-Fv domain is highly identical among IgG1 antibodies, we perform SCM analysis only on the Fv region. In general, the experimental structures of the Fv domain of antibodies are seldom available; therefore, we employ homology-modeling techniques to obtain the Fv structures from the antibody sequence. Using the structure of the Fv domain, we compute the SCM value for each atom and the SCM score for the Fv domain as follows:where H is the Heaviside function, and |.| is the absolute value function. When multiple (i.e., an ensemble of) Fv domain structures are available from experiments or molecular dynamics simulations, the SCMatom,i is calculated as the average value over these multiple structures (see supporting information).
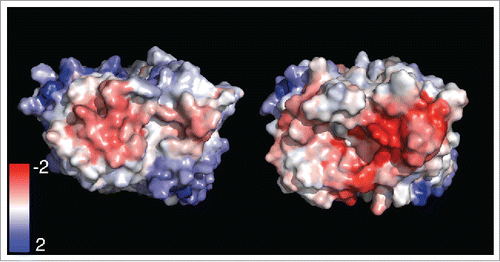
The SCM score, as computed above, represents both the extent and the magnitude of the exposed negative electrostatic patch on the Fv domain (see ). Published studies have reported that the presence of a negative patch on an Fv domain is correlated with high antibody viscosity, so we expect that high values of the SCM score would be correlated with high antibody viscosity. Because the SCM score does not incorporate the conditions (e.g., excipients, buffers, temperature) and experimental setup used to measure the viscosity, it should be considered a measure of the intrinsic propensity to exhibit high viscosity. For validation purposes, the SCM scores among antibodies should be compared with viscosity data obtained under similar formulation and temperature conditions. Furthermore, because we compute SCM scores only on the Fv domain, for validation purposes, we compare the viscosities of solutions of antibodies of similar isotypes. In this study, we focus on IgG1 antibodies because most of the experimental viscosity data were available for this isotype, and this isotype does not exhibit structural heterogeneity, as opposed to the IgG2 antibodies, which exhibit structural heterogeneity due to hinge region disulfide isoforms.Citation14
Figure 1. Projection of the SCMatom,i values on the Fv domain. (Left) antibody with a low SCM Score, Rituximab (right) antibody with a high SCM Score, N4. Fv domains are oriented so that the light chain is on the left side and the complementarity-determining regions of the antibodies are visible. Red patches indicate electronegative regions, whereas blue patches indicate electropositive patches.

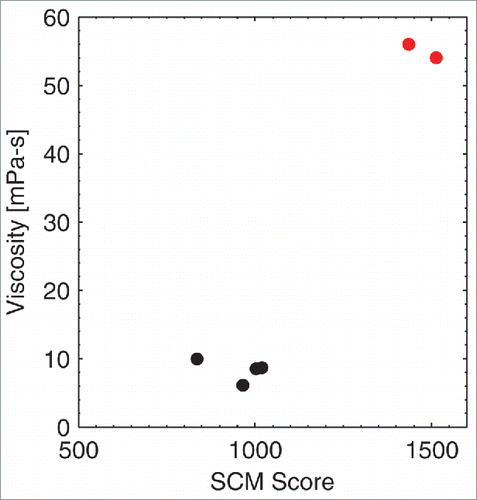
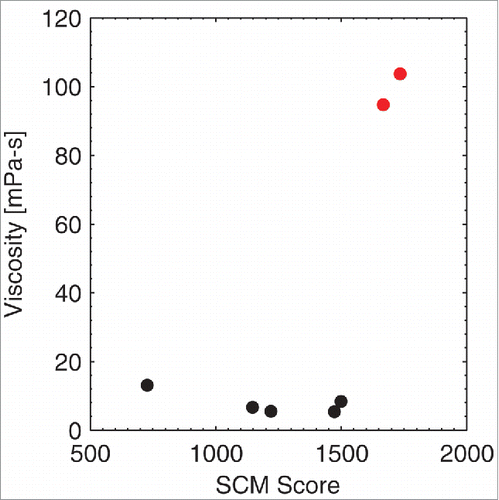
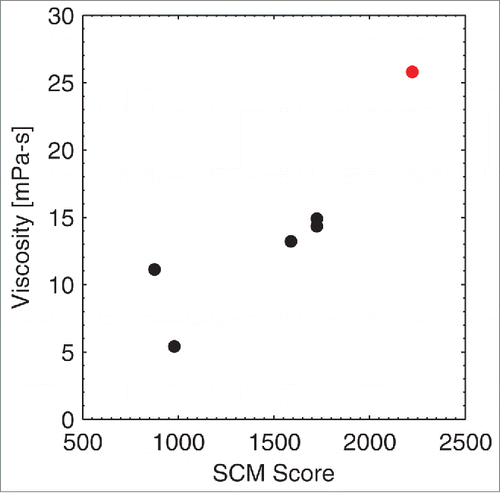
The experimental viscosities of the IgG1 antibodies reported in this manuscript were measured by their respective organizations; however, different experimental setups and different formulations were used during the experimental viscosity measurements. As a consequence of the methodology and formulation differences, a range of viscosity values were found by the 3 organizations. Therefore, we did not attempt a direct comparison of these experimental viscosities with the computed SCM scores, but report 3 separate comparisons. We plotted the experimental viscosity from each organization against the computed SCM score (). A high SCM score is indicative of high viscosity. Because different formulation conditions and experimental setups were used at these organizations, the SCM score threshold for differentiating low and high viscosity antibodies (i.e., antibodies that have viscosity greater than ˜20 mPa-s) is different in each of these figures. For example, an SCM score of greater than ˜1200 is a good predictor for a highly viscous antibody at Novartis, whereas an SCM score of greater than ˜1600 is a good predictor for a highly viscous antibody at Pfizer.
Figure 2. Correlation of the SCM Score with Novartis antibodies. An SCM score of greater than ∼1200 is a good predictor for highly viscous antibodies (shown in red) at Novartis.

Figure 3. Correlation of the SCM Score with Pfizer antibodies. An SCM score of greater than ∼1600 is a good predictor for highly viscous antibodies (shown in red) at Pfizer.

Figure 4. Correlation of the SCM Score with MedImmune antibodies. An SCM score of greater than ˜2000 is a good predictor for highly viscous antibodies (shown in red) at MedImmune.

Intermolecular interactions driven by non-Fv regions could also be responsible for the high viscosity of antibodies. Therefore, parameters in addition to the SCM score, which was computed only on the Fv region in this report, could be required to further refine the predictions. To obtain these additional parameters, additional experimental data are required to distinguish the role of the non-Fv region (e.g., to distinguish the role of CL in κ versus the λ light chain; see ). The Fv-based SCM score is capable of rapid, high-throughput and accurate identification of highly viscous antibodies in a typical antibody discovery-development program where most of the sequence dissimilarities among the candidate antibodies is limited to the Fv region.
Table 1. Antibody isotype, viscosity and SCM scores for Novartis antibodies
Table 2. Antibody isotype, viscosity and SCM scores for Pfizer antibodies
Table 3. Antibody isotype, viscosity and SCM scores for MedImmune antibodies. IgG1κ-YTE has triple mutations in the Fc domain for higher FcRn bindingCitation19
In conclusion, we present here a phenomenological model, termed SCM, for the coarse quantification of electronegative potential patch on the Fv domain of antibodies. Published studies indicate that the presence of electronegative patches on the Fv domain plays a role in the high viscosity of certain antibodies solutions. However, the electrostatic potential itself is not amenable to a direct, high throughput analysis. Furthermore, the electrostatic potential analysis itself is quite subjective and could lead to researcher-to-researcher variability. Analysis of the electrostatic potential on an ensemble of structures (as generated via molecular-dynamics simulations) is also not feasible, leaving only static analyses, which might depend significantly on the static structure chosen.
On the other hand, the SCM score quantifies the extent and the magnitude of electronegative patches on the Fv domain surface and hence overcomes all the above limitations. The SCM score has been extensively cross-validated for discrimination between low and high-viscosity antibodies at 3 different organizations, and it has been shown that a high SCM score is an accurate predictor of a highly viscous antibody. Hence, the SCM tool can be applied early in a development program to identify molecules from the antibody panel that are likely to have high viscosity. These antibodies could be either engineered to lower their SCM score (thus lowering their viscosity) or could be eliminated from the antibody panel. This strategy could be effective in ensuring that only antibodies displaying low viscosity in highly concentrated solutions are moved forward into development.
Structure Modeling
Novartis mAbs
The structures of the Fv domain of antibodies were obtained from our previous study.Citation13 Briefly, the structure of the Fv domain was generated from the sequence using the WAM modeling tool.Citation15 In a few cases, the structure of 3–4 residues at the C-termini of the chains were not generated by the above protocol; the coordinates of these residues were generated using the “Add Residue” utility of the Swiss PdbViewerCitation16 program. The coordinates of hydrogen atoms were generated for each of the structures using the PSFGEN plugin of VMD.Citation17 This final model was used for SCM calculation.
Pfizer mAbs
Molecular models for the Fv regions of 7 Pfizer mAbs were made using the antibody modeler in MOE. For each mAb, up to 625 intermediate (25 backbone models and 25 side chain models per backbone model) homology-based models were created for the Fv region. The intermediates were optimized to the root mean square gradient (RMSG) of 0.01 kcal/mol/Å2 via energy minimizations using the AMBER99 force-field with the reaction field implicit solvation model. The internal dielectric was set to 4, and the external dielectric was 80. Cut-off distances of 10 and 12 Å were used to screen the non-bonded interactions. The intermediates were ranked according to GB/VI score, and the best model was chosen as the final model. The C-termini of the VL and VH domains in the final model were neutralized via amidation. The final model was also re-protonated via Protonate3D to mimic pH 5.8. The final model was then re-optimized via energy minimizations to RMSG below 0.00001. This final re-optimized model was used for the SCM calculation.
MedImmune mAbs
The Fv domain structures of the MedImmune antibodies were generated using the “Build Antibody Fab Regions” tool in the Discovery Studio software from Accelrys. For each Fv domain sequence, high resolution and highly identical light chain, heavy chain and interface templates were selected, and 20 intermediate models were generated via homology modeling for the antibody framework. These intermediate models were optimized by a simulated annealing step. The model with the lowest PDF (probability density function describing the restraints on the geometric features) total energy was selected for detailed complementarity-determining region (CDR) loop modeling. Twenty intermediate models were selected during the CDR loop modeling, and each of these models were further optimized by molecular dynamics annealing. Lowest energy model was used for the SCM calculation.
Spatial Charge Map Calculation
The SCM profile was computed using the fully atomistic 3-dimensional structure of the protein as:
Here, a residue was considered to be solvent exposed if the sum-total of the solvent accessible area of the side-chain atoms of the residue in the protein structure was ≥10 Å2. The partial charge on each atom was computed at the formulation pH using CHARMM22 force field.Citation18 Once the SCM profile for each Fv was obtained, the SCM score of the Fv domain was calculated as:where H is the Heaviside function, and |.| is the absolute function.
Viscosity Measurement
Novartis mAbs
Viscosity data were generated for the Novartis mAbs, N1-N5 and rituximab prepared in the same formulation buffer and pH (of 5.8). All mAbs were concentrated to their apparent solubility limits and were then diluted to 150 mg/ml in the formulation buffer. Viscosity measurements on all mAbs were performed using a Malvern Kinexus Ultra viscometer at 25°C, and the protein concentrations were determined by UV absorbance at 280 nm with calculated extinction coefficients. The experimental conditions were maintained the same in all experiments.
Pfizer mAbs
Viscosity data were generated on 7 Pfizer mAbs, prepared in the same formulation buffer and pH (of 5.8). All mAbs were concentrated to their apparent solubility limits and were then diluted to 150 mg/ml in the formulation buffer. Viscosity measurements on all mAbs were performed using an Anton Paar cone-plate viscometer at 25°C, and the protein concentrations were determined using a SoloVPE instrument. The experimental conditions were maintained the same in all experiments. There was no salt added to the formulation buffer.
MedImmune mAbs
All mAbs were first concentrated (Amicon Ultra-15 Centrifugal Filter Units - 30,000 NMWL @ 3500 rpm, ˜90 min) to a target 150 mg/ml concentration in formulation buffer. This was followed by 1:500 dialysis (2X) into 25 mM histidine/HCl, pH 6.0. Osmolality and total protein were verified (gravimetric, A280) and adjusted if necessary to ˜150 mg/ml by either diluting with formulation buffer or concentrating again by centrifuge.
Viscosity was determined under standard operating methods using an Anton-Paar MCR 301 rheometer with cone and plate attachments (CP40-1, Diameter: 39.986 mm, Angle: 1.003°, Load Volume: 350 uL). The experimental conditions for this method included a shear rate of 1000…10 (1/s) followed by 10…1000 (1/s) with a slope of 5 pts/dec. The samples were pre-equilibrated at 25°C prior to the run.
Disclosure of Potential Conflicts of Interest
No potential conflicts of interest were disclosed.
Supplemental Material
Supplemental data for this article can be accessed on the publisher's website.
Agrawal et al Supplemental Files
Download PDF (149.8 KB)Acknowledgments
We thank Atanas Koulov for providing the experimental viscosity data for Novartis antibodies. N.J.A. and B.L.T. acknowledge funding support from Novartis Pharma AG and the Singapore-MIT Alliance. B.H. is an employee of Novartis Pharma AG; S.K., L.L. P.M.B. are employees of Pfizer, Inc.; N.M, H.A.S and H.S.S are employees of MedImmune.
References
- Chaudhri A, Zarraga IE, Yadav S, Patapoff TW, Shire SJ, Voth GA. The role of amino acid sequence in the self-association of therapeutic monoclonal antibodies: insights from coarse-grained modeling. J Phys Chem B 2013; 117:1269-79; PMID:23316912; http://dx.doi.org/10.1021/jp3108396
- Liu J, Nguyen MD, Andya JD, Shire SJ. Reversible self-association increases the viscosity of a concentrated monoclonal antibody in aqueous solution. J Pharm Sci 2005; 94:1928-40; PMID:16052543; http://dx.doi.org/10.1002/jps.20347
- Yadav S, Laue TM, Kalonia DS, Singh SN, Shire SJ. The influence of charge distribution on self-association and viscosity behavior of monoclonal antibody solutions. Mol Pharm 2012; 9:791-802; PMID:22352470; http://dx.doi.org/10.1021/mp200566k
- Yadav S, Shire SJ, Kalonia DS. Factors affecting the viscosity in high concentration solutions of different monoclonal antibodies. J Pharm Sci 2010; 99:4812-29; PMID:20821382; http://dx.doi.org/10.1002/jps.22190
- Yadav S, Shire SJ, Kalonia DS. Viscosity analysis of high concentration bovine serum albumin aqueous solutions. Pharm Res 2011; 28:1973-83; PMID:21491149; http://dx.doi.org/10.1007/s11095-011-0424-7
- Nichols P, Li L, Kumar S, Buck PM, Singh SK, Goswami S, Balthazor B, Conley TR, Sek D, Allen MJ. Rational design of viscosity reducing mutants of a monoclonal antibody: hydrophobic versus electrostatic inter-molecular interactions. MAbs 2015; 7:212-30; PMID:25559441; http://dx.doi.org/10.4161/19420862.2014.985504
- Li L, Kumar S, Buck PM, Burns C, Lavoie J, Singh SK, Warne NW, Nichols P, Luksha N, Boardman D. Concentration dependent viscosity of monoclonal antibody solutions: explaining experimental behavior in terms of molecular properties. Pharm Res 2014; 31:3161-78; PMID:24906598; http://dx.doi.org/10.1007/s11095-014-1409-0
- Yadav S, Liu J, Shire SJ, Kalonia DS. Specific interactions in high concentration antibody solutions resulting in high viscosity. J Pharm Sci 2010; 99:1152-68; PMID:19705420; http://dx.doi.org/10.1002/jps.21898
- Sharma VK, Patapoff TW, Kabakoff B, Pai S, Hilario E, Zhang B, Li C, Borisov O, Kelley RF, Chorny I, et al. In silico selection of therapeutic antibodies for development: viscosity, clearance, and chemical stability. Proc Natl Acad Sci U S A 2014; 111:18601-6; PMID:25512516; http://dx.doi.org/10.1073/pnas.1421779112
- Salinas BA, Sathish HA, Bishop SM, Harn N, Carpenter JF, Randolph TW. Understanding and modulating opalescence and viscosity in a monoclonal antibody formulation. J Pharm Sci 2010; 99:82-93; PMID:19475558; http://dx.doi.org/10.1002/jps.21797
- Buck PM, Chaudhri A, Kumar S, Singh SK. Highly viscous antibody solutions are a consequence of network formation caused by domain-domain electrostatic complementarities: insights from coarse-grained simulations. Mol Pharm 2015; 12:127-39; PMID:25383990; http://dx.doi.org/10.1021/mp500485w
- Chennamsetty N, Voynov V, Kayser V, Helk B, Trout BL. Design of therapeutic proteins with enhanced stability. Proc Natl Acad Sci U S A 2009; 106:11937-42; PMID:19571001; http://dx.doi.org/10.1073/pnas.0904191106
- Lauer TM, Agrawal NJ, Chennamsetty N, Egodage K, Helk B, Trout BL. Developability index: a rapid in silico tool for the screening of antibody aggregation propensity. J Pharm Sci 2012; 101:102-15; PMID:21935950; http://dx.doi.org/10.1002/jps.22758
- Dillon TM, Ricci MS, Vezina C, Flynn GC, Liu YD, Rehder DS, Plant M, Henkle B, Li Y, Deechongkit S, et al. Structural and functional characterization of disulfide isoforms of the human IgG2 subclass. J Biol Chem 2008; 283:16206-15; PMID:18339626; http://dx.doi.org/10.1074/jbc.M709988200
- Whitelegg NR, Rees AR. WAM: an improved algorithm for modelling antibodies on the WEB. Protein Eng 2000; 13:819-24; PMID:11239080; http://dx.doi.org/10.1093/protein/13.12.819
- Guex N, Peitsch MC. SWISS-MODEL and the Swiss-PdbViewer: an environment for comparative protein modeling. Electrophoresis 1997; 18:2714-23; PMID:9504803; http://dx.doi.org/10.1002/elps.1150181505
- Humphrey W, Dalke A, Schulten K. VMD: visual molecular dynamics. J Mol Graph 1996; 14:33-&; PMID:8744570; http://dx.doi.org/10.1016/0263-7855(96)00018-5
- MacKerell AD, Bashford D, Bellott M, Dunbrack RL, Evanseck JD, Field MJ, Fischer S, Gao J, Guo H, Ha S, et al. All-atom empirical potential for molecular modeling and dynamics studies of proteins. J Phys Chem B 1998; 102:3586-616; PMID:24889800; http://dx.doi.org/10.1021/jp973084f
- Dall'Acqua WF, Kiener PA, Wu H. Properties of human IgG1s engineered for enhanced binding to the neonatal Fc receptor (FcRn). J Biol Chem 2006; 281:23514-24; PMID:16793771; http://dx.doi.org/10.1074/jbc.M604292200
