 ?Mathematical formulae have been encoded as MathML and are displayed in this HTML version using MathJax in order to improve their display. Uncheck the box to turn MathJax off. This feature requires Javascript. Click on a formula to zoom.
Abstract
Biodistribution coefficients (BC) allow estimation of the tissue concentrations of proteins based on the plasma pharmacokinetics. We have previously established the BC values for monoclonal antibodies. Here, this concept is extended by development of a relationship between protein size and BC values. The relationship was built by deriving the BC values for various antibody fragments of known molecular weight from published biodistribution studies. We found that there exists a simple exponential relationship between molecular weight and BC values that allows the prediction of tissue distribution of proteins based on molecular weight alone. The relationship was validated by a priori predicting BC values of 4 antibody fragments that were not used in building the relationship. The relationship was also used to derive BC50 values for all the tissues, which is the molecular weight increase that would result in 50% reduction in tissue uptake of a protein. The BC50 values for most tissues were found to be ~35 kDa. An ability to estimate tissue distribution of antibody fragments based on the BC vs. molecular size relationship established here may allow better understanding of the biologics concentrations in tissues responsible for efficacy or toxicity. This relationship can also be applied for rational development of new biotherapeutic modalities with optimal biodistribution properties to target (or avoid) specific tissues.
Introduction
Protein therapeutics (biologics) have become an important part of the pharmaceutical portfolio. To establish a clinically translatable exposure-response relationship for these molecules, it is important to comprehend their concentrations at the site-of-action, as well as in the tissues responsible for toxicity. One way to estimate the tissue concentrations of protein therapeutics is to derive them based on the plasma concentrations measured at the same time. In the past, we established this methodology for monoclonal antibodies (mAbs) by quantifying universal ratios of tissue and plasma mAb concentrations, which were termed biodistribution coefficients (BC).Citation1 We demonstrated that these BC values for mAbs, first derived based on mouse biodistribution studies, were applicable to rat, monkey, and human. Further, BC values were not dependent on the concentrations of mAbs and the time of measurement post dosing. Thus, the BC values allow for the prediction of tissue concentrations of mAbs based on the plasma concentrations.
The BC values represent the extent of distribution of a protein in given tissue, and it is important to understand the determinants for these values. Comparing plasma concentrations of proteins with different tissue concentrations allows for investigation of the relative uptake and clearance processes of proteins in different tissues. Uptake of macromolecules into tissues is mainly driven by convection through different size pores in the vascular wall. Rippe et al.Citation2 established the theoretical foundations for this extravasation process of large molecules via the 2-pore model. They postulated that, due to the convective flux and diffusion through many small and few large pores in the vascular wall, macromolecules such as antibodies are "filtered" from blood into extravascular space. A second process possibly contributing to tissue uptake of macromolecules may be fluid phase endocytosis into endothelial cells and subsequent transcytosis. It is known that after endocytic uptake FcRn protects mAbs from catabolism in the vascular endothelium, and hence this could contribute to the transportation of antibodies to the interstitial space. Both these processes (i.e., crossing the vascular wall via pores and transcytosis) could positively influence uptake of mAbs into tissues, and therefore contribute toward a higher BC value. On the other hand, the BC value is negatively influenced by the local clearance of macromolecules from the extravascular space. There are 2 main processes that determine local clearance of macromolecules, transport back to the systemic circulation via the lymph and cellular uptake leading to catabolism. For mAbs, these local clearance processes are typically faster than the uptake processes, resulting in tissue concentrations lower than plasma concentrations, and resultant BC values smaller than one.
Here, we show that smaller proteins (e.g., mAb fragments) show a similar constant relationship between tissue and plasma concentrations that can be expressed as BC values. Additionally, we establish a continuous quantitative relationship between protein size and BC values for each tissue. To derive the relationship, we first employ the biodistribution data of mAb (150 kDa), F(ab')2 (100 kDa), Fab' (50 kDa), and scFv (27 kDa). Subsequently, the biodistribution data from scFv-Fc (105 kDa), minibody (80 kDa), dimeric scFv (60 kDa), and nanobody (13 kDa) is used for validation of the established relationship between molecular size and BC values. This relationship describes how the size of a protein therapeutic determines tissue concentrations and influences the BC value.
Results
Estimation of biodistribution coefficients for F(ab')2, Fab' and scFv
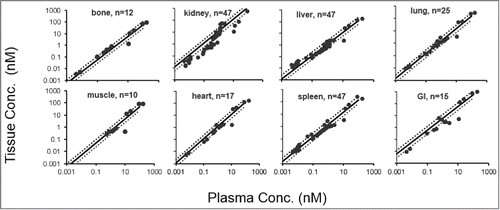
To analyze the relationship between plasma and tissue concentrations of antibody fragments, we extracted biodistribution data from various publications (see Material and Methods). The resulting tissue vs. plasma concentration profiles generated for F(ab')2, Fab', and scFv are provided in . We observed linear relationships for the 3 proteins in all tissues over a wide range of concentrations (more than 10,000-fold for F(ab')2 and Fab', and more than 100,000-fold for scFv). These linear relationships were found to be independent of the sampling time post dosing, which is consistent with the observation reported with mAbs.Citation1 The estimated BC values for each antibody fragment in different tissues are provided in , along with the estimated coefficient of variation (CV%) for each BC value. The solid lines in the figures represent the line fitted using EquationEquation 3(Eq.3)
(Eq.3) (Material and Methods) and the dotted line represents the 2-fold error envelope around the solid line. Coefficient of variation values for the estimated BC were below 25% for F(ab')2, below 35% for Fab', and below 25% for scFv. Most data points fell evenly around the fitted line and were within the 2-fold error envelope. In few cases, such as for F(ab')2 molecules in the spleen, more scattered data were observed around the linear relationship, which we hypothesize could be due to experimental variability.
Table 1. Estimated Biodistribution Coefficient (BC) values for proteins included in the building dataset, along with the estimated coefficient of variation for each BC value.
Figure 1. Tissue vs. plasma concentration profiles generated for F(ab')2. Black solid circles represents observed data, the black solid line represents fitted tissue vs. plasma F(ab')2 concentration relationship based on the estimated BC values, and the black dotted lines represent the 2-fold error envelope. The 'n' value in each panel represents the number of observed data points for each tissue.
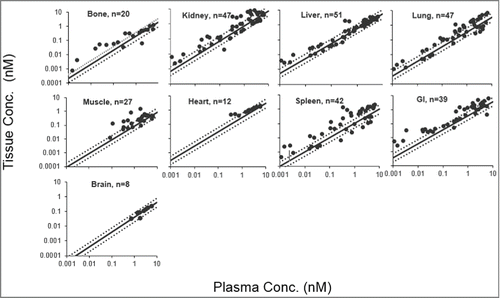
Figure 2. Tissue vs. plasma concentration profiles generated for Fab'. Black solid circles represents observed data, the black solid line represents fitted tissue vs. plasma Fab' concentration relationship based on the estimated BC values, and the black dotted lines represent the 2-fold error envelope. The 'n' value in each panel represents the number of observed data points for each tissue.
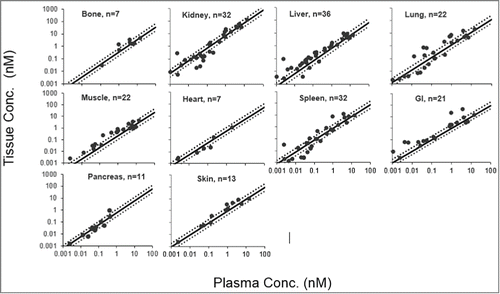
Figure 3. Tissue vs. plasma concentration profiles generated for scFv. Black solid circles represents observed data, the black solid line represents fitted tissue vs. plasma scFv concentration relationship based on the estimated BC values, and the black dotted lines represent the 2-fold error envelope. The 'n' value in each panel represents the number of observed data points for each tissue.
Building the relationship between BC and protein size
BC vs. molecular weight plots for each tissue are provided in . These relationships were characterized using the following equation:
Figure 4. BC vs. protein molecular weight profiles. Black solid circles represent the data derived BC values for scFv (~27 kDa), Fab' (~50 kDa), F(ab')2 (~100 kDa) and mAb (~150 kDa). The black solid line represents fitted BC vs. molecular weight relationship for each tissue. Black bars represent the standard deviation (SD) of each fitted BC values. Goodness of fitting for each tissue is represented by R2 values.
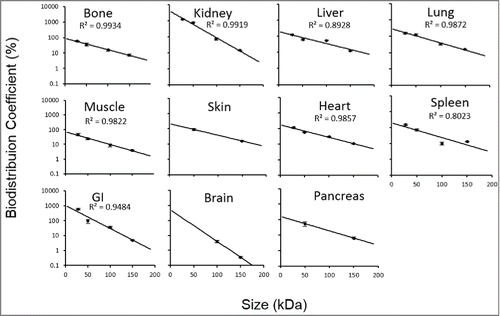
Two independent variables, a and b, were fitted as model parameters. "a" can be understood as the ln BC% of a hypothetical protein with molecular weight approaching zero, and the slope parameter "b" represents the rate of decrease in the BC value with an increase in protein size. Dividing the natural log of 2 with parameter b provides a value in kDa, representing the molecular weight increase that results in 50% reduction of the BC value (BC50) and tissue uptake. Estimates of these parameters for each tissue, as well as the R2 values of the fittings, are listed in . The model fittings are shown as the solid line in the . The resultant equation well captured the data in all the tissues with good R2 values. No R2 value was reported for skin, brain, and pancreas because only 2 BCs were available for fitting these 3 tissues.
Table 2. Estimated parameters for the BC vs. protein molecular weight relationship.
BC vs. protein radius (ae) plots for each tissue are provided in the Figure S1. These relationships were characterized using the following equation:(Eq.2)
(Eq.2)
Two independent variables, A and B, were fitted as model parameters. "A" could be understood as the ln BC% of a hypothetical protein with radius approaching zero, and the slope parameter "B" represents the rate of decrease in the BC value with an increase in the protein radius. Estimates of these parameters for each tissue, as well as the R2 values of the fittings, are listed in Table S1. The model fittings are shown as the solid line in the Figure S1.
Validation of the relationship between BC and protein size
Four additional classes of mAb fragments with different sizes were used for validation: scFv-Fc (105 kDa), minibody (80 kDa), dimeric scFv (60 kDa), and nanobody (13 kDa). The tissue vs. plasma concentration profiles generated for these 4 proteins are provided in Figures S2–5. The derived BC values for each antibody fragment in different tissues are provided in Table S2. The solid lines in the supplementary figures represent the line fitted using EquationEquation 3(Eq.3)
(Eq.3) (Material and Methods) and the dotted line represents the 2-fold error envelope around the solid line.
To validate the derived relationship between protein size and BC values (EquationEquations 1 and 2), we tested how well this relationship could predict the BC values of the validation proteins. shows the data-derived BC values for each validation protein superimposed over the established BC vs. molecular weight relationship. The percentage predictive error (%PE) for each BC value, generated from the BC vs. molecular weight relationship, is provided in .
Figure 5. BC vs. molecular weight profiles with validation data points. Black solid circles represent fitted BC values for scFv (~27 kDa), Fab' (~50 kDa), F(ab')2 (~100 kDa) and mAb (~150 kDa). The black solid line represents fitted BC vs. molecular weight relationship for each tissue. Open symbols represent validation proteins. The open circle represents BC values for nanobody (13 kDa), open diamond for sc(Fv)2 (60 kDa), open square for minibody (80 kDa), and open triangle for scFv-Fc (105 kDa).
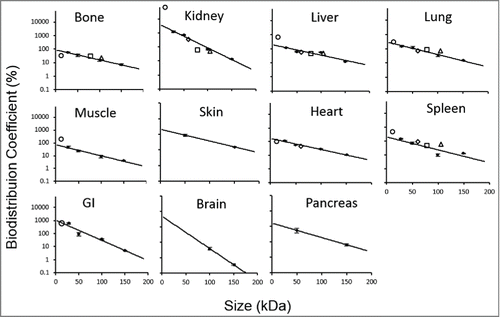
Table 3. Validation of BC vs. molecular weight relationship using proteins included in the validation data set. Predictive errors are calculated using the equation-5.
The estimated BC values for each validation protein superimposed over the established BC vs. ae relationship for each tissue are displayed in Figure S6. The %PE for each BC value, generated from the BC vs. ae relationship, is provided in Table S2.
As evident from and , the BC vs. molecular weight relationship was able to predict the BC values for all 4 validation proteins in most of the tissues with less than 1-fold predictive error. The only exceptions were bone for nanobody and kidney for minibody. This could be due to either the limited amount of biodistribution data available to estimate those BC values with confidence or a more complex relationship between the BC value and molecular weight for those tissues than the one portrayed by equation 1. BC vs. protein radius relationship also performed reasonably well in terms of predicting the BC values of the validation proteins based on their radius (Figure S6 and Table S2). This relationship had similar aberrations in predicting the BC value of minibody in kidney and the BC value of nanobody in bone.
Discussion
Better understanding of quantitative structure-pharmacokinetic (PK) relationships for biologics is important for a priori prediction of their absorption, distribution, metabolism, and excretion (ADME) properties. Such relationships enable rational (e.g.,, model based) drug development and minimize the dependence on animals to gain ADME information. Toward this goal, here we established the first ever continuous quantitative relationship between protein size and tissue distribution by deriving BC values for different antibody fragments using biodistribution data from numerous published studies.
A general comparison of the extent of tissue distribution between mAb and the fragments () reveal that the distribution of mAb fragments into the tissues is higher compared to mAb. These findings are expected and consistent with the reports that suggest that tissue penetration of smaller proteins is relatively easier due to their greater extravasation through the pores of vascular capillary wall.Citation2,3 Additionally, when the BC values were compared across the investigated proteins, several other general trends were observed.
First, kidney represented the most significant distribution site for mAb fragments. BC values in kidney were estimated to be the highest for all 3 fragments (0.71 for F(ab')2, 7.34 for Fab' and 12.35 for scFv). For mAb, the BC value in kidney was much lower (0.14), and did not exceed above all other tissues.Citation1 We hypothesize that this observation is probably due to renal filtration of smaller antibody fragments, followed by their extensive reabsorption.Citation4 It is known that molecules with an effective radius of less than 1.8 nm (or < 12 kDa) are freely filtered, and molecules with 4.2 nm (or >70 kDa) are filtered to a limited extent.Citation5 However, even molecules larger than 70 kDa have been reported to accumulate in kidney to a limited extent.Citation6-8 Another factor that could influence these high BC values for the kidney is the distribution of the free label to the kidney. However, since we find increasing BC values with decreasing size of antibody fragments irrespective of the labeling, this effect may not contribute significantly.
Second, it was observed that clear differences in fitted BC values could be found between "tight" and "leaky" tissues. "Leaky" tissues, such as liver, lung and spleen had higher BC values than "tight" tissues like muscle, heart and brain. It was also observed that scFv demonstrated very high distribution into the gastro-intestinal (GI) tract. In our knowledge there is no published information available to explain this phenomenon, but one hypothesis could be that this is related to a hepatobiliary elimination process.
Lastly, compared to mAb BC values, the BC value of F(ab')2 in brain showed the greatest (more than 10-fold) increase. This could either be related to the reduced protein size or possibly due to the absence of the Fc fragment, which has been hypothesized to contribute to mAb efflux from the brain.Citation9,10
It should be noted that BC values describe the protein concentrations in tissues as a percentage of the concentration in plasma at any given time after dosing. Therefore, BC values are useful to compare how easily different antibody fragments can distribute into different tissues. However, to compare resulting exposure of different sizes proteins in tissues, the plasma PK of the respective proteins needs to be taken into account.Citation11 Further, it might be more appropriate to derive the interstitial concentrations of proteins based on the BC values by employing the respective volumes of vascular and interstitial compartments.Citation12 It is also important to note that the tissue concentrations derived based on the BC values are valid only for non-target expressing tissues, and does not take into account the target-mediated drug disposition (TMDD) of proteins in target expressing tissues. Based on the expression profile and internalization levels of a target in a given tissue, the TMDD effect can lead to higher or lower interstitial concentrations of a protein than the one predicted using a BC value. Thus, to predict the tissue concentrations of targeted proteins in target-expressing tissues, a more integrated approach like the use of a physiologically-based PK (PBPK) model would be needed.Citation13,14
Our analysis also revealed that most of the tissues (except kidney, brain and GI) had different BC values, but very similar values for "b" (which represents the rate of decrease in the BC value with an increase in protein size). This suggests that, although the extent of tissue penetration in these tissues may be different, the penetration decreases in a similar fashion with increasing sizes of proteins. This phenomenon may be potentially explained by similar distribution pattern of different size pores in the capillary wall of these tissues. The value of "b" for kidney, brain and GI were higher than for other tissues. This means that, compared to other tissues, the extent of biodistribution for these tissues changes much faster with changing protein size. This difference may result from the presence of special barriers or vascular membrane properties in these tissues.
We have observed with mAbs that the BC values derived from mouse data were translatable to other animal species and human.Citation1 If this holds true for other proteins, these relationships can also be employed to predict tissue exposures of therapeutic proteins in humans based on their size. Accordingly, here derived BC values will be very useful toward our efforts for the development of next-generation platform PBPK models for biologics.Citation13
Of note, the contribution of FcRn in facilitating transcytosis of Fc-containing proteins (including mAbs) is still under debate. While few reports suggest FcRn may not contribute significantly toward tissue distribution of mAbs,Citation14 a recent report proposes that FcRn may play a significant role in mAb biodistribution.Citation15 Our data () shows that the relationship between protein size and tissue uptake holds true for both FcRn binding and non-FcRn binding antibody fragments, suggesting an insignificant contribution of FcRn in transcytosis-mediated tissue uptake.
In summary, we demonstrated that the linear relationship between tissue and plasma concentrations can be generalized to different sizes of antibody fragments. Also, for the first time, we have established a continuous quantitative relationship between tissue distribution and protein size. Using these relationships, one can predict the tissue PK of an antibody fragment based on the plasma PK and known protein size. Also, the derived BC values will be especially valuable for building platform PBPK models that allow the prediction of the PK of proteins based on their size, and in the future is capable of including other molecular properties such as charge. Although the relationship between BC and protein size was developed based on mouse data, our experience with mAbs suggest that they could be applicable to other preclinical species and human. However, to verify this hypothesis, more preclinical and clinical data on the biodistribution of different size proteins in different species would be needed.
Materials and Methods
Datasets for biodistribution coefficient estimation
Two different data sets were created for the estimation of BC values. One dataset, termed the building data set, included the proteins whose BC values were used to build the BC vs. protein size relationship. The other dataset, termed the validation data set, included the proteins whose BC values were used to validate the BC vs. protein size relationship.
The building dataset included mice biodistribution studies from 10 different F(ab')2, 9 different Fab', and 7 different scFv molecules. The validation data set included mice biodistribution studies from 3 different scFv-Fc, 1 minibody, 1 (scFv)2, and 2 different nanobody molecules. A detailed description of each published biodistribution study is provided in the Table S3. To avoid the effect of target-mediated disposition, only data from the tissues that were not targeted by the studied protein is used from each study. Biodistribution of the proteins was studied using various radiolabels e.g., iodine-131, iodine-125, astatine-211, technetium-99m and gallium-67. Of 33 different biodistribution studies, 30 employed non-residualizing isotopes (Table S3). The concentration data was obtained by digitization using the software 'Grab It! XP'. To ensure uniformity the units of tissue and plasma concentrations were converted to nanomolar (nM) before analysis.
Estimation of BC
Tissue vs. plasma concentration plots generated for each class of proteins in each tissue were fitted using the following equation:(Eq.3)
(Eq.3)
The fittings were performed using the software WinNonlin (version 6.3, Pharsight Corp., Mountain View, CA). As shown in the EquationEquation 3(Eq.3)
(Eq.3) , BC is essentially the estimated slope of each fitted line.
Building the relationship between BC and protein size
To establish a continuous quantitative relationship between the protein size and the extent of protein distribution, BC vs. molecular weight relationships were generated for each tissue using the BC values estimated for mAb, F(ab')2, Fab', and scFv. The molecular weights chosen were: mAbs, 150 kDa; F(ab')2, 100 kDa, Fab', 50 kDa; and scFv, 27 kDa. The BC vs. molecular weight data for each tissue was fitted by several equations, using the software Microsoft Excel 2013. The best-fitting equation was determined by visual inspection and comparing R2 values. The equation with overall highest R2 values in all the tissues was considered the most accurate in describing the relationship between BC and protein size.
In order to represent the protein size by the radius of the protein (ae), we also characterized the BC vs. ae relationship for each tissue with several equations, using the software MATLAB→ 2014a. The following equation was used to calculate the radius of a protein based on the molecular weight:Citation16(Eq.4)
(Eq.4)
The best-fitting equation was determined by visual inspection and comparing R2 values. The equation with overall highest R2 values in all the tissues was considered the most accurate in describing the relationship between BC and ae.
Validation of the relationship between BC and protein size
BC vs. molecular weight and BC vs. protein radius relationships were validated using scFv-Fc, minibody, dimeric scFv, and nanobody, as the validation proteins. The molecular weights used were: scFv-Fc, 105 kDa; minibody, 80 kDa; dimeric scFv, 60 kDa; and nanobody, 13 kDa. The BC values for each of these proteins in all the tissues were calculated based on the relationships established here, and these values were compared with the respective values obtained based on their mice biodistribution data. The ability of each equation to predict the BC value of a protein based on the protein size was assessed by calculating mean percentage predictive error (%PE) using the following equation:(Eq.5)
(Eq.5)
Above, BCPred is the BC value predicted based on the established BC vs. protein size equations, and BCObs is the BC value estimated based on the linear tissue vs. plasma concentration profiles.
Disclosure of Potential Conflicts of Interest
No potential conflicts of interest were disclosed.
Supplementary Material
Supplemental data for this article can be accessed on the publisher's website.
Li et al Supplemental Data
Download Zip (305.6 KB)Acknowledgments
This work was in part supported by NIH grant GM114179 to DKS. SS was supported by the post-doctoral fellowship from Roche. We thank the members of the Quantitative and Systems Pharmacology Group at Roche pRed for valuable discussion regarding disposition of large molecules.
References
- Shah DK, Betts AM. Antibody biodistribution coefficients: inferring tissue concentrations of monoclonal antibodies based on the plasma concentrations in several preclinical species and human. mAbs 2013; 5:297-305; PMID:23406896; http://dx.doi.org/10.4161/mabs.23684.
- Rippe B, Haraldsson B. Transport of macromolecules across microvascular walls: the two-pore theory. Physiol Rev 1994; 74:163-219; PMID:8295933
- Yuan F, Dellian M, Fukumura D, Leunig M, Berk DA, Torchilin VP, Jain RK. Vascular permeability in a human tumor xenograft: molecular size dependence and cutoff size. Cancer Res 1995; 55:3752-6; PMID:7641188
- Beckman RA, Weiner LM, Davis HM. Antibody constructs in cancer therapy: protein engineering strategies to improve exposure in solid tumors. Cancer 2007; 109:170-9; PMID:17154393; http://dx.doi.org/10.1002/cncr.22402
- Vegt E, de Jong M, Wetzels JF, Masereeuw R, Melis M, Oyen WJ, Gotthardt M, Boerman OC. Renal toxicity of radiolabeled peptides and antibody fragments: mechanisms, impact on radionuclide therapy, and strategies for prevention. J Nucl Med 2010; 51:1049-58; PMID:20554737; http://dx.doi.org/10.2967/jnumed.110.075101
- Hong H, Zhang Y, Orbay H, Valdovinos HF, Nayak TR, Bean J, Theuer CP, Barnhart TE, Cai W. Positron emission tomography imaging of tumor angiogenesis with a (61/64)Cu-labeled F(ab')(2) antibody fragment. Mol Pharm 2013; 10:709-16; PMID:23316869; http://dx.doi.org/10.1021/mp300507r
- Sandstrom K, Haylock AK, Spiegelberg D, Qvarnstrom F, Wester K, Nestor M. A novel CD44v6 targeting antibody fragment with improved tumor-to-blood ratio. Int J Oncol 2012; 40:1525-32; PMID:22307465
- Sarin H. Physiologic upper limits of pore size of different blood capillary types and another perspective on the dual pore theory of microvascular permeability. J Angiogenesis Res 2010; 2:14; PMID:20701757; http://dx.doi.org/10.1186/2040-2384-2-14
- Cooper PR, Ciambrone GJ, Kliwinski CM, Maze E, Johnson L, Li Q, Feng Y, Hornby PJ. Efflux of monoclonal antibodies from rat brain by neonatal Fc receptor, FcRn. Brain Res 2013; 1534:13-21; PMID:23978455; http://dx.doi.org/10.1016/j.brainres.2013.08.035
- Schlachetzki F, Zhu C, Pardridge WM. Expression of the neonatal Fc receptor (FcRn) at the blood-brain barrier. J Neurochem 2002; 81:203-6; PMID:12067234; http://dx.doi.org/10.1046/j.1471-4159.2002.00840.x
- Schmidt MM, Wittrup KD. A modeling analysis of the effects of molecular size and binding affinity on tumor targeting. Mol Cancer Ther 2009; 8:2861-71; PMID:19825804; http://dx.doi.org/10.1158/1535-7163.MCT-09-0195
- Boswell CA, Mundo EE, Ulufatu S, Bumbaca D, Cahaya HS, Majidy N, Van Hoy M, Schweiger MG, Fielder PJ, Prabhu S, et al. Comparative physiology of mice and rats: radiometric measurement of vascular parameters in rodent tissues. Mol Pharm 2014; 11:1591-8; PMID:24702191; http://dx.doi.org/10.1021/mp400748t
- Shah DK, Betts AM. Towards a platform PBPK model to characterize the plasma and tissue disposition of monoclonal antibodies in preclinical species and human. J Pharmacokinet Pharmacodyn 2012; 39:67-86; PMID:22143261; http://dx.doi.org/10.1007/s10928-011-9232-2
- Garg A, Balthasar JP. Physiologically-based pharmacokinetic (PBPK) model to predict IgG tissue kinetics in wild-type and FcRn-knockout mice. J Pharmacokinet Pharmacodyn 2007; 34:687-709; PMID:17636457; http://dx.doi.org/10.1007/s10928-007-9065-1
- Chen N, Wang W, Fauty S, Fang Y, Hamuro L, Hussain A, Prueksaritanont T. The effect of the neonatal Fc receptor on human IgG biodistribution in mice. mAbs 2014; 6:502-8; PMID:24492305; http://dx.doi.org/10.4161/mabs.27765
- Venturoli D, Rippe B. Ficoll and dextran vs. globular proteins as probes for testing glomerular permselectivity: effects of molecular size, shape, charge, and deformability. Am J Physiol Renal Physiol 2005; 288:F605-13; PMID:15753324; http://dx.doi.org/10.1152/ajprenal.00171.2004
