
ABSTRACT
The regulatory bodies request full sequence data assessment both for innovator and biosimilar monoclonal antibodies (mAbs). Full sequence coverage is typically used to verify the integrity of the analytical data obtained following the combination of multiple LC-MS/MS datasets from orthogonal protease digests (so called “bottom-up” approaches). Top-down or middle-down mass spectrometric approaches have the potential to minimize artifacts, reduce overall analysis time and provide orthogonality to this traditional approach. In this work we report a new combined approach involving middle-up LC-QTOF and middle-down LC-MALDI in-source decay (ISD) mass spectrometry. This was applied to cetuximab, panitumumab and natalizumab, selected as representative US Food and Drug Administration- and European Medicines Agency-approved mAbs. The goal was to unambiguously confirm their reference sequences and examine the general applicability of this approach. Furthermore, a new measure for assessing the integrity and validity of results from middle-down approaches is introduced – the “Sequence Validation Percentage.” Full sequence data assessment of the 3 antibodies was achieved enabling all 3 sequences to be fully validated by a combination of middle-up molecular weight determination and middle-down protein sequencing. Three errors in the reference amino acid sequence of natalizumab, causing a cumulative mass shift of only −2 Da in the natalizumab Fd domain, were corrected as a result of this work.
Abbreviations
| ETD | = | electron transfer dissociation |
| ISD | = | in-source decay |
| mAb | = | monoclonal antibody |
| MD | = | middle-down |
| MDS | = | middle-down sequencing |
| MW | = | molecular weight |
| SC | = | sequence coverage |
| SVP | = | sequence validation percentage |
| TD | = | top-down |
| TDS | = | top-down sequencing |
| UHR | = | ultra-high resolution |
Introduction
MAbs and related products are the fastest growing class of human therapeutics.Citation1 More than 50 IgGs and IgG derivatives have been approved for use in various indications such as cancer and inflammatory diseases, and over 50 more are currently being investigated in late-stage clinical trials.Citation2 Most of the current recombinant mAbs are produced in CHO, NS0 or SP2/0 cells.Citation3 From a structural standpoint, chimeric, humanized and human IgGs are tetrameric glycoproteins with molecular weights (MWs) ca. 150 kDa, and are composed of 2 heavy chains (HC, ca. 50 kDa) and 2 light chains (LC, ca. 25 kDa). Most clinically approved mAbs are selected from 3 isotypes (IgG1, IgG2, IgG4) defined by different HC amino acid sequences. Their three dimensional structure (HC2LC2 homo/heterodimers) is maintained by disulfide bridges (16 for IgG1 and IgG4; 18 for IgG2) and non-covalent interactions. The HC and LC are linked by one disulfide bond, and the HCs are linked by 2 (for IgG1 and IgG4) or 4 (for IgG2) disulfide bonds located in the hinge region.
Confirmation of the primary structure of mAbs is generally provided by the well-established approach of obtaining 100% sequence coverage (SC) of the amino acid backbone. This is typically achieved by proteolytic digestion using a number of enzymes such as trypsin, Lys-C, Glu-C, chymotrypsin, followed by LC-MS/MS and the subsequent combination of the resultant multiple LC-MS/MS data sets into a gross peptide map. Although this approach is broadly applied, there are several disadvantages, such as time-consuming sample preparation, data acquisition and analysis, as well as the significant inability to detect partial or unexpected modifications. In addition, proteolytic digestion under acidic or basic conditions and/or with extended digestion times may lead to over-deamidation events that potentially render the determination of the intrinsic deamidation of the biopharmaceutical prior to the digestion inaccurate.Citation4 For these reasons, alternatives involving less time-consuming sample manipulation are of interest.
Top-down (TD) and middle-down (MD) approaches potentially provide such alternatives. However, they are not widely applied to innovator sequence validation yet because the most common TD technique, electron transfer dissociation (ETD) on electrospray mass spectrometry platforms, does not typically achieve SCs exceeding 30-50% for full-length antibodies or 50% to 70% for antibody subunits.Citation5-8 An alternative platform for TD mass spectrometry that has matured over several years but is still not widely exploited is in-source decay (ISD) on matrix-assisted laser desorption/ionization (MALDI)-based platforms.Citation9-12 Much like ETD, ISD involves fast transfer reactions; in this case the transfer of hydrogen radicals abstracted from the MALDI matrix causes fragmentation at the site of radical attachment.Citation13,14 MALDI-ISD has been successfully applied to the analysis of modifications such as sequencing of O-glycoproteins or the localization of PEGylation sites.Citation15,16
In recent work our groups established TD and MD protein sequencing (TDS and MDS, respectively) using MALDI-ISD for de novo protein sequencing of a 13.6 kDa camelid nanobody and obtained ca. 70% SC of the cetuximab LC in order to curate innovator database sequence errors. In the latter work, MDS was combined with intact high resolution and high mass accuracy MW determination of antibody LC, Fc/2 and Fd domains (middle-up analysis) with isotopic resolution and fidelity.Citation17,18 The determination of precise MWs and isotopic distributions at the sub-ppm level permitted the detection of sequence aberrations and validation of the sequences established by MALDI-ISD.
It must be noted that MDS analysis of antibody domains by MALDI-ISD is not without its limitations (see Discussion section). These limitations have the potential to cause gaps in the sequence readout, and hence a reduction in the SC. However, examination of the whole data set can confirm the absence/presence of expected amino acids, point mutations and other modifications. Therefore, a new measure quantifying the validity and integrity of the results from MD approaches was developed, the so called “Sequence Validation Percentage” (SVP), and applied to this study. Further discussion of the SVP is provided below.
The work presented here further develops the LC-MALDI-ISD method for MDS so as to achieve full sequence information of 3 representative mAbs: cetuximab (chimeric IgG1 produced in Sp2/0 cells), panitumumab (human IgG2 produced in CHO cells) and natalizumab (humanized IgG4 produced in NS0 cells). This MDS approach involves cleavage of the antibody HC by Immunoglobulin G-degrading enzyme of S.pyogenes IdeS in the hinge region into the Fc/2 and Fd domains and reductive separation of the LC followed by MALDI-ISD analysis.Citation19,20 To our knowledge, this is the first time that the entire primary structure of IgG antibodies has been established by a mass spectrometric MDS approach. Full sequence validation in this study (i.e., SVP), however, relies on tolerating gaps (terminal residues and proline gaps) within the sequence readout and safeguarding the results with accurate domain molecular weight information using Ultra High Resolution (UHR) QTOF mass spectrometry, which provides accurate mass and isotopically resolved MW determination of the Fc/2, Fd and LC fragments delivering complementary information useful for sequence variant detection and for sequence validation.
Results
Panitumumab
Panitumumab is a recombinant, human IgG2κ monoclonal antibody that binds specifically to the human epidermal growth factor receptor (EGFR). The reference sequence of panitumumab was obtained from the IMGT database (http://www.imgt.org/PDF/CritRevOncolHematol/64_210-225_2007.pdf).
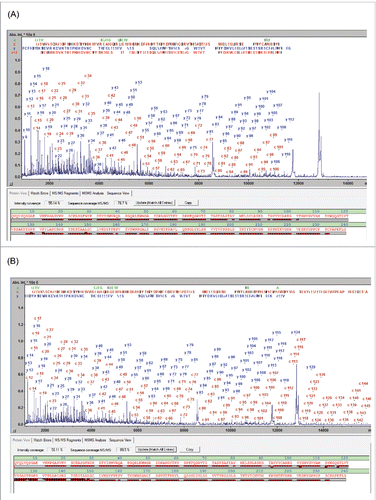
The MALDI-ISD spectra resulting from the analysis of the 3 subunits generated following IdeS digestion exhibit abundant ion signals from the N-terminal a- and c-ions and the C-terminal y- and z+2-ions (). Throughout this work SC was used as a numeric parameter to qualify the characterization of these spectra and is defined by the fraction of peptide bonds that is accounted for by at least one ISD fragment. The panitumumab fragment ISD spectra showed SCs of 92.1, 90.5 and 87.2% for LC, Fc/2 and Fd, respectively ().
Figure 1. MD MALDI-ISD spectra of panitumumab subunits from the separation shown in Fig. S1: (A) Fd, (B) Fc/2 IgZERO treated, C-term des-Lys, and (C) LC, The N-terminal c-ions and the C-terminal y- and z+2-ions are assigned in the spectra. In each sequence panel the fragment ion matches are visualized as red bricks; the top and bottom rows representing N- and C-terminal fragment ions, respectively. Mass errors of fragments are < 0.1 Da up to 6 kDa and < 0.5 Da up to approx. 15 kDa.
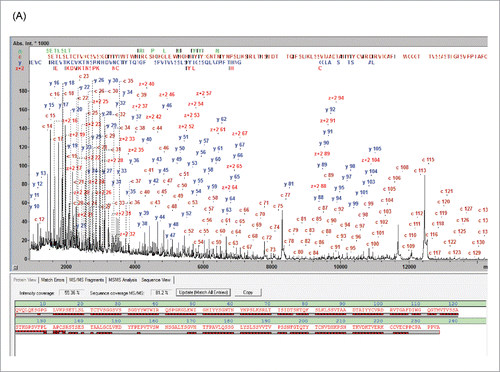
Figure 1. Continued
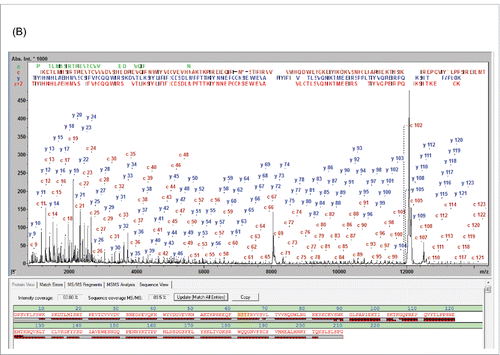
Figure 1. Continued
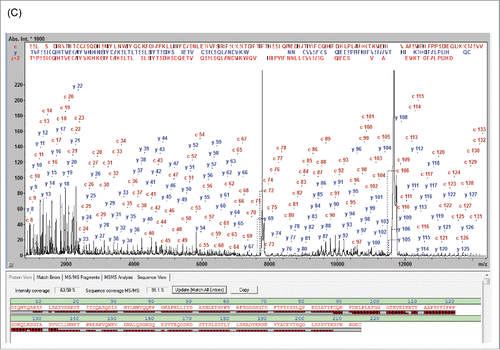
Table 1 Compilation of Middle-Up and Middle-Down Results of the Three Antibodies
Confirmation of the terminal sequences can, for example, be achieved by T3-sequencing. T3-sequencing of the c13 ion from the Fd domain resulted in the detection of the fragment ions b1-b12 (Fig. S2), confirming unambiguously the expected terminal sequence. However, a typical sequence validation may not require this proof level to validate terminal sequences. In general, correctly matching m/z values of the near-terminal fragment ions typically permit validation of the upstream sequence. The degree to which the protein sequence is validated is quantified by the “Sequence Validation Percentage” (SVP %) parameter, which we propose to use in this context (). The SVP was calculated to be 100% for LC and Fc/2 fragments. However, for the Fd fragment the SVP was 97.9%, suggesting that, for 2.1% of the Fd sequence (amino acid residues 155-160), no direct information was available (other than the accurate intact mass) as to whether or not sequence variations or PTMs were present.
Middle-up analysis by LC-UHR-QTOF-MS of the panitumumab subunit mixture enabled the monoisotopic MWs to be determined (Fig. S3). The maXis II UHR-QTOF affords a mass resolution of ca. 85,000 for the deconvoluted spectra, enabling the isotope patterns of the antibody subunits to be fully resolved. This isotopic resolution permits the monoisotopic MWs of the subunits to be determined with a mass accuracy of better than 1 ppm (Fig. S3). One-hundred percent of the protein mass is represented in such data points, and experimental data precisely matched to the calculated isotopic peak pattern provide strong evidence to confirm the reference sequence without proteolytic digestion. In addition, both the middle-up and the middle-down data confirm that the panitumumab HC N-terminus is pyroglutamylated and the C-terminal Lys residue has been clipped off, leaving a C-terminal Gly.
Cetuximab
Cetuximab is a chimeric (mouse/human) monoclonal IgG1 antibody directed against EGFR. In a recent study we elucidated and corrected the reference sequence of cetuximab for which an incorrect sequence was retrieved from the IMGT database and the literature.Citation18,21,22 Using the same analysis strategy described for panitumumab in this work, the reported near C-terminal Ala-213 was determined to be Glu-213. In that study, e.g., ˜70% SC were obtained for the LC. So we also revisited the sample to see the effect the further improved methodology that was employed in the current study on the sequence coverage.
The cetuximab subunits were analyzed by MALDI-MS after IdeS fragmentation and Fc-deglycosylation by EndoS.Citation23 The LC was represented in the spectrum by a single peak at m/z 11714.5 (z = 2, MW 23426.93, mass error +0.2 Da /+9 ppm), which confirmed the average MW 23426.72 Da of the LC. The EndoS-truncated Fc was present in 2 forms, Lys (+/−): one without the C-terminal lysine residue (MW 24140.04 Da; approx. 70%) and a second one with it (MW 24268.21 Da; approx. 55%). Also, a low abundant high mannose form was detected in both lysine (+/−) forms at MW 25135.97/25007.79 Da. The fully glycosylated Fd fragment was detected with the neutral glycan forms only; Gal4GlcNAc4Man3Fuc being the single most abundant species (MW 27547.29 Da). The average mass error across all assigned fragments in this spectrum was 0.56 Da/20.9 ppm, which is typical for measurements under the described conditions. The cetuximab subunits were then analyzed by MALDI-ISD (Fig. S4).
The fragment ions in the MALDI-ISD spectrum of the cetuximab LC were annotated with the corrected sequence from (Fig. S4-A).Citation18 The N- and C-terminal fragment ions covered the sequence until c127 and y107, respectively, thus redundantly covering the core sequence [92-128] and yielding 100% SVP and 92.5% SC. ()
The analysis of cetuximab Fc/2 fragment after EndoS deglycosylation (Fig. S4-B) provided comparable results (100% SVP, 91.9% SC). EndoS truncates the hinge region glycan at FcN61, yielding fucosyl-GlcNAc and thus removing the typical heterogeneity of the glycosylation site; generating a single well defined and small glycan structure, which enables verification of the glycosylation site and facilitates MDS analysis. Fragment ions downstream of c60 up to c123 were observed.
The cetuximab Fd fragment has an additional glycosylation site at N88, which was not removed for the initial analysis (Fig. S4-C). In that case the uninterrupted N-terminal sequence readout was still possible up to c94 (12 kDa), which included the glycosylation site. Due to the MW of the glycan, approx. 30 residues fewer were covered on the N- compared to the C-terminal sequence, leaving an uncovered gap in the cetuximab Fd between residues 104 and 115. This resulted in a reduced SC of 87.0% and 96.2% SVP (). The major glycoform Gal4GlcNAc4Man3Fuc was also detected directly in this spectrum. The mass difference between c88 and c87 of (2206.7879 Da) was in agreement with the expected MW (2206.7880 Da) +/− 1 mDa.
To further increase the SC of the cetuximab Fd, the sample was treated with PNGase F prior to analysis by LC-MALDI-ISD (Fig. S4-D). As expected, the reduction of heterogeneity and MW increased the readout length from c94 to c141, providing a fragment ion overlap with the C-terminal sequence (˜ y126) in the core region [117-141]. After PNGase digestion, Asn-88 was confirmed in its deamidated form (shown as N* in Fig. S4-D). Deglycosylation of the Fd is not trivial and was achieved, albeit still incomplete, through a combination of IdeS and EndoS digestion with reduction under denaturing conditions prior to the PNGase digestion. The successfully deglycosylated Fd yielded 92.9% SC and 100% SVP, which is a further improvement from previous results (). Glycosylated Fd present as a result of incomplete deglycosylation were fully separated chromatographically from its deglycosylated derivative with the detected mass of 25454.18 Da (mass error 0.2 Da /8 ppm) and did not interfere in this analysis.
Cetuximab LC contains 2 disulfide bridges, Cys-23 Cys-88 and Cys-134 Cys-194. Since denaturing of the antibodies using high molar concentration of urea or guanidinium chloride was not performed prior to LC-MALDI-ISD analysis, incomplete reduction of the internal cysteine bonds was observed. Chromatographic separation of incompletely reduced cetuximab LC revealed 3 distinct peaks, and each was subjected to MALDI-ISD analysis. The LC variant at retention time (Rt) 27 min was identified as the fully reduced LC, with both the N- and C-terminal ISD-fragments observable until c120 and y120, respectively, thus providing 100% SVP (Fig. S5-A).
In contrast, the ISD spectra obtained from the 2 remaining peaks revealed an abrupt drop in fragment ion intensity in a series of ions (Fig. S5-D). This results in decreased amino acid readout and is indicative of incomplete reduction and the presence of a cyclic structure. Using this approach, information about the cysteine bridges within the subunits can be directly obtained.
The peak at Rt 25.5 min was identified as partially reduced LC, C134#C194 remaining intact. The N-terminal ISD-fragments were observed until c117 fully reading through the reduced C23#C88 disulfide bond. In contrast, the y-ion series suffered a drop in ion abundance after y20, and thus a significantly reduced coverage in the range between y20 and y60 and an overall ˜50% SVP (Fig. S5-B) was observed.
The peak at Rt 24.5 min was identified as partially reduced LC, C23#C88 remaining intact, indicated by a strong drop in abundance downstream of c22 (Fig. S5-C). Consistently, the N-terminal ISD-fragments were observable until c117, interrupted by a long gap of weak or entirely missing fragment ions between c22 and c88, suggesting the C23#C88 disulfide bond was at least partially intact. In contrast, the y-ion series uninterruptedly reached until y116. A significantly reduced ∼64% SVP was observed.
Natalizumab
Natalizumab, which targets the cell adhesion molecule α4-integrin, is a humanized monoclonal IgG4 antibody produced in murine myeloma cells. No reference sequence is available in databases such IMGT or the Drug Data base, so a sequence reconstituted from different non-public sources was provided by the Center d'Immunologie Pierre Fabre. (Seq. S1-A).
The expected average MWs for IdeS-generated and EndoS-trimmed natalizumab subunits were calculated using Bruker's Sequence Editor Program to be 23556.06 Da (LC), 24123.90 Da (Fc/2) and 25662.64 Da (Fd). The experimentally determined average MWs for the natalizumab subunits obtained by MALDI-TOF-MS were 23556.01 Da (LC: −0.05 Da/−2 ppm), 24124.06 Da (Fc/2: +0.16 Da /+ 8 ppm) and 25664.81 Da (Fd: +2.17 Da /+ 86 ppm) (). The Fd fragment significantly exceeded the mass tolerance of approx. 10-20 ppm for antibody subunits on the MALDI-TOF, indicating that there was a discrepancy between the Fd region and the reference sequence.
Figure 2. Natalizumab sequence validation based on subunit MWs. (A) MALDI-TOF spectrum obtained without prior chromatographic separation showing M2+ molecular ions. (B) Isotopically resolved UHR-QTOF spectrum of the natalizumab Fd (black) overlaid against the theoretical isotope pattern (red) calculated from Seq. S1-A showing a clear shift in the patterns and a 2 Da/78 ppm mass error. (C) The same spectrum (black) was matched against the isotopic pattern calculated from the sequence Seq. S1-B - Wang et al. 2009; red- established by MALDI-ISD providing a good match and 0.83 ppm mass accuracy.Citation24.
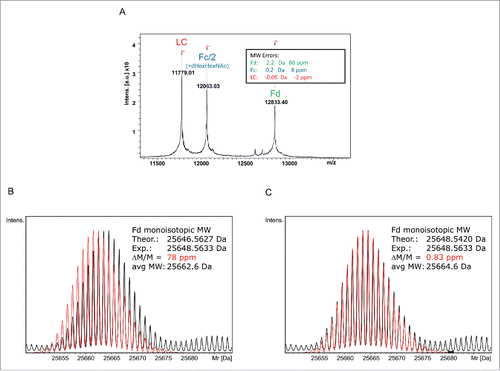
To confirm the initial findings, the IdeS-treated natalizumab sample was analyzed by LC-MS on the maXis II UHR-QTOF. The UHR enabled the isotopes of the antibody subunits to be resolved and the monoisotopic MWs to be determined as 23541.5693 Da (LC: +0.66 ppm), 25204.3871 Da (Fc/2-K+G0F: +0.83 ppm) and 25648.5633 Da (Fd: +78 ppm, +1.99 Da) (). Both the MALDI-TOF and the UHR-QTOF data indicate an anomaly in the Fd region causing a +2 Da mass shift compared with the reference sequence.
MALDI-ISD analysis of the Fd subunit also revealed that the N-terminal sequence readout stopped after Tyr-101, thus creating a gap at residues 102-127 not covered by MD fragments, indicating a possible sequence conflict in that sequence range (). This resulted in a low SC of 79.9% and an SVP of 90% ().
Figure 3. MALDI-ISD spectrum of natalizumab Fd fragment assigned with the internal reference sequence (Seq. S1-A) (A) and with the sequence according Wang et al. 2009 (B).Citation24 The MALDI-ISD spectrum covers the entire sequence, including the core region with the 3 sequence errors at positions 102, 125 and 127.
The sequence downstream of Tyr-101 was determined from the MALDI-ISD spectrum de novo and 3 sequence differences were revealed relative to the reference sequence Seq S1-A): F102Y, K125S and T127K. The resulting gross mass shift was calculated to be +2 Da. A literature search revealed a matching sequence for natalizumab in the public domain.Citation24 Using this sequence, MW determinations of the natalizumab Fd fragment on the QTOF and MALDI-TOF were in good agreement with the predicted values (). The average MW 25664.61 Da calculated from the Wang sequence was in good agreement with the experimental MW from the MALDI measurement (25664.81 Da; +0.2 Da/7.7 ppm) as well. Furthermore, the experimentally determined monoisotopic MW of 25648.5536 Da using the UHR-QTOF matched the calculated monoisotopic MW from the Wang sequence (25648.5429 Da) with a high mass accuracy (+0.012 Da /+ 0.45 ppm) ().
Discussion
The role of intact subunit MW in sequence validation and the importance of monoisotopic mass
Sequence validation is a key requirement for biosimilar and biotherapeutic development, particularly in the confirmation of the proper sequence for raw drug batches. MW determinations alone may already provide access to fast sequence and overall primary structure screening given a sufficiently high mass accuracy. Here, we further developed a MALDI-MS method using the established DHAC matrix preparation from Gorman et al., which generates multiple charge states of proteins with high intensity ().Citation25 The doubly charged ions produce greater resolved peaks compared to the MH+ ion, enabling better mass accuracies of less than 21 ppm (<0.6 Da) to be achieved for antibody subunits in the 25 kDa range. These mass errors were achieved after smoothing the partially resolved isotopic peaks to approx. 9 Da peak widths – identical to the theoretical isotope window. This observed mass accuracy for MALDI-TOF is sufficient to prevent needless sequencing studies with the goal to detect sequence deviations or analysis of cysteine oxidation states. Even a 2 Da MW change was safely detected. Such a triple error in antibody sequence, as observed for natalizumab, would not be accepted as a biosimilar in the European Union.Citation26
It should be noted that the MALDI data obtained in this study provided average mass MW information. However, MW determination of proteins using average mass determination suffers systematic restrictions. The average mass of a protein of this size is significantly affected by the 13C/12C ratio. The variation of this ratio reported for laboratory animals only allows the calculation of a protein´s average mass to within ±8 ppm, equivalent to 0.2 Da.Citation27,28 If the resolution is too low to match the isotopic envelop or if calibrants and analytes are not derived from sources with a similar 13C/12C ratio, the mass accuracy likely is even lower. The mass errors we report here for MALDI-TOF (8-21 ppm) are near this theoretical limit. Instruments with decoupled mass analyzers, such as hybrid QTOF instruments, can only improve the mass accuracy to below 2 ppm if a) isotopic mass resolution is obtained, and b) if the quality of the experimentally determined isotopic distribution is high enough to safely assign the monoisotopic peak and not introduce a ±1 Da uncertainty to the mass assignment.Citation29 The UHR-QTOF used in this study provides approx. 85 000 resolving power in the deconvoluted spectra, enabling a high fidelity in the representation of the isotopes across the entire isotopic distribution ( and S3), providing the instrumental basis for safe monoisotopic mass assignments of larger proteins. For data processing we used the SNAP II algorithm (a modification to the initially published algorithm) in combination with the Averagine concept to yield safe assignments of the antibody subunit monoisotopic MWs below the 1 ppm level.Citation30,29 This is despite the fact that the monoisotopic peak is 16 Da lower than the average MW or the base peak of the isotopic distribution, and is therefore not visible in these antibody subunit spectra. UHR-QTOF data permit the safe annotation of an accurate monoisotopic mass because the large ion populations provide a strong statistical base.
Intact monoisotopic MW information of antibody subunits at the <1ppm level is an efficient filter or screening tool that can safely detect non-isobaric structure modifications. In this work, the mass accuracy by the UHR-QTOF enabled point mutations or sequence errors in the reference sequence to be reliably detected (as demonstrated by the cetuximab and natalizumab case studies). Also artifacts such as incomplete reductive disulfide bond cleavage (ΔM= −2 Da) or protein deamidation (ΔM= +1 Da) can be detected on the subunit level. As the process of IdeS digestion plus reduction only takes 30 min, deamidation is not typically observed as a digestion artifact in contrast to tryptic digestion often used in bottom-up approaches.Citation4
Once sequence anomalies have been identified, MDS analysis of the subunit is an effective way to localize the sequence or structure variations and to validate the correctness of the sequences. As highlighted here, the correct sequence selection based on mass spectrometry can save substantial time and money. MS evaluation of the degree of similarity between a biosimilar and a reference innovator product should therefore be done right at the beginning of a new biosimilar project.
While mass measurements alone cannot be used for verification of originator sequences, they can function as screening tool as discussed before, and they represent a specific validation tool in addition to fragmentation strategies. For example, for the panitumumab Fd fragment, the SVP was 97.9% corresponding to amino acid residues 155-160 being not covered, here the accurate mass information allowed to confirm that residues 155-160 are in line with the reference sequence. Accurate mass can thus serve as a powerful screening tool initially and as final gross validation data point - in conjunction with extensive fragment information.
Overcoming limitations of MDS by MALDI-ISD method refinements to increase sequence coverage
For a new protein sequencing method such as MALDI-ISD to become routinely applied to biologics sequence validation, it is crucial that it provides reliable results. An important aspect of this work was evaluating the possible factors that might contribute to failed analyses or reduction of the sequence readout length, which in turn would render sequence validation more time consuming.
Sample amount and sample quality are the most important factors for achieving good quality MALDI TDS/MDS results, e.g., use more than 10 pmole of protein, ideally up to 100 pmole on the MALDI-target. Salts, detergents or other “MALDI unfriendly” components need to be removed prior to analysis. Single protein solutions are preferred as ISD fragments from other protein components will overlap in the spectra and will reduce peak abundance for the target protein, and hence, the readout length. Therefore, HPLC separation of the antibody subunits with direct spotting of eluting fractions to a MALDI target is advised.
As mentioned previously, limitations of MDS analysis for antibody subunits are known and include: (a) the inability to distinguish isobaric Leu and Ile residues; (b) sequences typically read downstream of the 8th-10th residue from each terminus and do not directly cover the terminal residues 1-10; and (c) cyclic structures cannot be sequence analyzed by single-bond cleavage and so there is no read through of cyclic structures such as loops formed by disulfide bonds and the N-Cα-bond of proline residues that are required for the formation of z+2- and c-ions.Citation12,13 However, strategies for overcoming these limitations on MALDI-based platforms are possible. For example, Leu and Ile distinction is possible using high-energy collisionally induced decomposition (heCID) on MALDI-TOF/TOF instrumentation in bottom-up LC-heCID workflows or by T3-sequencing subsequent to MALDI-ISD analysis. Citation10,11,17,31 The gaps caused by the presence of proline residues are entirely predictable and can be closed in the software by screening for matching XP, XPP or even XPPP sequence motifs. Experimental confirmation using pseudo-MS3; has also been recently applied to closing proline gaps in MALDI-ISD spectra.Citation32
As demonstrated here, cysteine disulfide bonds also cause interruptions or can result in relatively short readout lengths (Fig. S5-B, C). For this reason, the reduction of the antibodies must be driven toward full reduction as a precondition to achieving 100% SC. Incomplete reduction, however, provides information about the oxidative state and enables the localization of the intact disulfide bonds (Fig. S5-B, C). These disulfide bond specific sequence gaps in the MALDI-ISD spectra have also been observed previously in ECD/ETD spectra.Citation7
Sequence readout is also reduced by the introduction of structural heterogeneity such as partial C-terminal Lys excision (e.g., cetuximab Fc/2) or modification heterogeneity such as partial N-terminal pyroglutamylation. Glycosylation is the major cause of structural heterogeneity and its effect on readout length by TDS/MDS is significant as was demonstrated for the glycosylated cetuximab Fd subunit where the c-ion series readout length was improved 50% by PNGase F digestion (Fig. S4).
Another factor known to either shorten the readout length or lead to the loss of the entire terminal sequence is the presence of negatively charged residues near either terminus that prevents an efficient positive ionization of terminal fragments. In such cases, negative ionization mode ISD can be used (unpublished data).
In summary, the best results for the MDS of therapeutic antibodies are achieved following LC purification of 50-100 pmole amounts, the truncation of glycan side chains and the full reduction of disulfide bonds.
Data confidence in the context of Sequence validation from TDS/MDS approaches
In this work, different parameters were used to quantify the degree to which the sequences were determined by MDS: the SC and the SVP. The SC is most commonly used to describe the percentage of the entire sequence accounted for by sequencing the spectra. SC is defined as the fraction of peptide bonds for which specific fragment ions are observed in a spectrum. Depending on the distribution of fragments across a sequence, these matches can be more or less error prone, since long contiguous sequence tags provide a much higher chance of being correct compared to disperse hits that do not provide direct sequence readout. So if all fragments in such a 30% SC antibody fragment derive from the N-terminus, it can be considered safely sequenced while the C-terminus remains entirely unaccounted for. In other words, the SC alone does not indicate the percentage of the sequence that can be regarded as confirmed or validated (). For this reason, the authors introduced here the SVP into the discussion of MDS validation. The SVP is designed to estimate the proportion of the sequence that can be regarded as validated. We propose that gaps still are compatible with assigning validated sequence stretches if the sequence tags read precisely at the expected fragment ion masses downstream such an N- or C-terminal gap, proline gaps or short random gaps so that the upstream sequence is considered validated since sequence length variations or unexpected modifications can be safely excluded. Because the SVP tolerates gaps within the sequence readout, e.g., those caused by proline gaps and at the termini, it is a better representation of the fraction of the sequence that can be accepted as validated than the SC. An SVP <100% is a clear indication that some residues have not been covered by fragment information and could still contain undetected modifications or sequence aberrations, and an SVP 100% clearly excludes such possibilities. The SC does not provide such specific information – 93% SC is just a bit better than 87% SC.
However, it should be noted that TDS/MDS utilizing MALDI-ISD or ESI-ETD mass spectrometry cannot exclude isobaric sequence aberrations. Therefore, sequence permutations within a gap or Leu-to-Ile exchanges throughout the sequence cannot be specifically excluded in such a validated sequence. A SVP of 95%, therefore, means that in 95% of the sequence any sequence/PTM changes can be excluded that are not isobaric. Only 5% of the sequence remain uncovered in this case and may need to be validated by further experiments such as T3-sequencing, bottom-up studies that may include high-energy CID to distinguish Ile and Leu, Edman sequencing or intact accurate mass measurements like in this study.Citation10,31,17,33 With the rules and caveats described previously, the SVP provides a reasonable estimation of the fraction of the sequence for which further data need to be obtained to call the sequence fully validated. The SVP can easily be utilized for automated sequence validation purposes through the use of dedicated software.
Comparison of MALDI-ISD with ESI-ETD
While MALDI-ISD is not commonly known or used in the biopharmaceutical industry with some exceptions, ESI-ETD is very well established for TD or MD protein sequence validation and identification.Citation16,34,35,36 The utility of MALDI-ISD for this field was highlighted in recent years by the group of De Pauw, who introduced the DAN matrix based on the mechanism elucidated by Takayama.Citation37,13
Unique to MALDI-ISD is the low variation of fragment ion abundance along the sequence, with a- and c-, y- and z+2-ions formed; the c-ions systematically display the highest abundance of all ion series in isotopically resolved reflector mode spectra.Citation11 This uniform ion series abundance of singly charged fragment ions permits relatively simple assignment of MALDI-ISD spectra with interactive validation and direct inspection of sequences with the respective fragment ions. In this study, full validation of the target sequences of the 25 kDa antibody subunits by MDS analysis was achieved in this manner. Furthermore de novo sequencing is possible due to the long contiguous singly charged ion series produced and was exploited previously to fully sequence an unknown 13.6 kDa protein.Citation17 This performance level is currently not within reach of ETD approaches. ETD spectra in such MDS analyses typically provide relatively short stretches of amino acid sequences, and it is very common to observe only single fragments, increasing the danger of misassignments of a target sequence. In ETD spectra fragment ion families of, for example, z-2, z-1, z, z+1, z+2, are typically observed. Even a 1-2 ppm mass accuracy does not add sufficient specificity, as the precise annotation of the ion type remains a challenge and +/− 1 or 2 Da misassignments can easily happen.Citation29 For example, the 3 sequence errors in the natalizumab Fd-fragment reference that were corrected in this MALDI-ISD study went undetected in a recent FTMS-ETD study.Citation38
Given the nature of the fragmentation, SCs of 50% or less are typically achieved by MDS using ETD compared with SC > 90% with MALDI-ISD.Citation8 This limitation triggered the development of new “extended bottom-up” strategies using Sap9 protease for analysis creating approx. 3.5 kDa proteolytic peptides that allow obtaining increased sequence coverage by LC-ESI-ETD.Citation39
However, advantages of ETD vs. MALDI-ISD are the ability to select precursor ions from protein mixtures and that ETD frequently permits the direct readout of the first 10 residues from the terminus, whereas MALDI-ISD only provides fragment ions starting approx. at the 10th residue from both termini.Citation43 This is because in the lower m/z range the sequence readout is obscured by clusters of matrix and adduct ions. Therefore, the pseudo-MS3 approach called “T3-Sequencing” is useful (Fig. S2), which provides direct access to the terminal sequences by MS/MS analysis of ISD fragment ions.Citation10 If heCID is used for the MS/MS step, even Leu/Ile distinctions are possible with T3-Sequencing.Citation17
In conclusion, the combined use of UHR-QTOF analysis and MALDI-TOF/TOF in the described middle-up/down approach turned out to be very effective at determining structural aberrations safely and to characterizing them thoroughly. Assigning monoisotopic masses of antibody LC, Fc/2 and Fd fragments in UHR-QTOF data and a high fidelity of isotopic pattern representation were essential for the successful and fast application of these methods. The resulting 1 ppm mass accuracy, allowed detection of reference sequence inconsistencies even when the gross mass shift of multiple “point mutations” was as low as 2 Da.
MS-based protein sequencing using MALD-ISD reliably provided long and uninterrupted sequence reads from both termini. Singly charged MALDI spectra were visually validated easily. The well-defined ion series (a, c, y, z+2) extend to even overlap in the core sequence of these antibody fragments so that 99-100% of the investigated sequences of 3 mAbs were validated.
Compared to our previous work, the coverage of the cetuximab sequence was further improved by several means described in the order of influence: Citation18
1. Sample amount is a critical parameter for ISD analysis, and thus sample loss during chromatography on columns should be avoided. In our work described in Ayoub et al., we used a C8 column (Zorbax, Agilent) and observed rather weak recovery. The C4 column we used for this work (Phenomenex) showed a similar high loading capacity, but its high recovery of LC, Fd and Fc/2 was an important factor for the increase of sequence readouts.
2. The complete reduction of cysteine bonds further contributed to increased sequence readout. Cysteines at position 22 in the heavy and position 23 in the light chain are linked to cysteines at position 95 and 88, respectively. The cyclic structures of the disulfide bridges prevent detection of ISD fragments between these residues. We used a denaturing step here with 6 M guanidinium chloride to allow maximal reduction of all disulfide bonds of the antibody subunits, and thus a further increase of the analyte amount in a form compatible with middle-down sequence analysis.
3. Post-translational modifications introduce mass shifts and heterogeneity to the protein. In the case of cetuximab Fd subunit, glycosylation of ASN 88 did not prevent identification of the most abundant glycoform (G4F), but rather reduced sequence readout. After cleavage of the glycans with PNGase F, sequence readout was increased from c94 to c141 to achieve 100% SVP.
The combination of these 3 interventions allowed the full validation of the 3 antibodies investigated in this study.
The combination of sub ppm molecular weight determination and near 100% levels of sequence validation appears to be quite promising in biopharmaceutical reference sequence validation and curation as it dramatically extends Edman sequencing capabilities at very short analysis times.
Methods
Sample preparation
Cetuximab (chIgG1, SP2/0, Erbitux, Merck), panitumumab (huIgG2, CHO, Vectibix®, Amgen), and natalizumab (hzIgG4, NS0, Tysabri®, Biogen) were obtained in their formulation buffers and versions approved in the European Union. They were not further purified. The concentration of panitumumab was 20 mg/mL, cetuximab 5 mg/mL and natalizumab 20 mg/mL.
For LC-MALDI-TDS analysis, 100 µg of each antibody were added to a vial containing lyophilized EndoS and/or IdeS including digestion buffer (IgGZERO and FabRICATOR, Genovis, Lund, Sweden). The enzymes were provided either separately or in a mixture for simultaneous digestion. Depending on the concentration of the sample, deionized water was added to a final volume of 25 µL in each vial. Digestion was performed at 37°C for 30 min per enzyme or in a mixture of both enzymes with the same results for simultaneous or separate incubation. After digestion, either tris(2-carboxyethyl)phosphine (TCEP; concentration of 50 mM in vial) or dithiothreitol (DTT; 100-150 mM in vial) were added and incubated for 1 h at 37°C. The reduced subunits were then prepared as a mixture for intact MW analysis by MALDI-MS or subjected to LC separation and fractionation prior to MALDI-ISD. Separation and fractionation were achieved using an Agilent 1200 system coupled with UV detector and fraction collector (Proteineer fc II, Bruker) controlled by the Bruker Hystar 3.2 software. Four µg of the reduced subunit mixture were injected onto a Jupiter 5 µm C4 300 A column (150 mm, Phenomenex) held constantly at 60°C. A 30 min linear gradient from 25% B to 48% B (with aqueous 0.1% trifluoroacetic acid (TFA) as solvent A and acetonitrile and 0.1% TFA as solvent B) eluted the subunits at a capillary flow rate of 15 µL/min and the LC-eluate was collected every 15 sec in 3 µL fractions and spotted automatically on a MTP 384 BigAnchor target (Bruker).
For MS analyses of the subunits by UHR-QTOF, 100 µg of each antibody were added to a vial containing lyophilized IdeS including digestion buffer and reduced for 45 min at 37°C with 50 mM TCEP in 5 M guanidinium chloride. As the glycosylation site at Asn-88 of the cetuximab HC cannot be cleaved by EndoS, an additional deglycosylation protocol was developed. After IdeS and EndoS digestion, the sample was incubated with guanidinium-HCl (4 M) and DTT (130 mM) for 30 min at 37°C. The denaturation buffer was then removed using an Amicon Ultra 0.5 10 K cutoff filter (Millipore). An aliquot of 20 units of PNGase F (Promega) was added to the sample and digestion was performed for 3 h at 37°C.
MALDI-MS analysis and MDS of antibody subunits
MALDI matrices (Bruker) were used without further purification: DHAC matrix (2,6-dihydroxyacetophenone/diammonium-hydrogen citrate) was used for intact mass determination and was prepared as recommended in the protocol provided by the supplier.Citation40 SDHB (super DHB: mixture of 2,5-dihydroxybenzoic acid and 2-hydroxy-5-methoxybenzoic acid, 9:1) was used for ISD fragmentation and was prepared by dissolving 25 mg of sDHB in 1 mL 50% ACN/water/0.1% TFA.
For intact mass determination, an aliquot of the subunit mixture was diluted 1:20 and mixed with 2% TFA and the DHAC solution as described in the supplier´s protocol. One µL of the mixture was spotted on a BigAnchor target and left to dry. Protein Calibration Standard I (Bruker) prepared identically was used for external calibration. For MDS analysis, the spotted and dried LC fractions of the separated subunits were overlaid with 1 µL of sDHB matrix. Ten pmole of bovine ubiquitin (Sigma-Aldrich) in sDHB were used for ISD spectra calibration.
All MALDI mass spectra were acquired using an ultraflex - treme MALDI-TOF/TOF mass spectrometer (Bruker). Compass 1.4 software was used for data acquisition and processing and BioTools 3.2 SR 5 for MDS analysis. For intact mass determination of the unseparated subunits, spectra were acquired in reflector mode using a parameter set optimized for the mass range between 8 and 17 kDa as provided by the manufacturer. Singly charged ions of the protein calibration standard were used to calibrate the doubly charged ions of the subunits. Approximately 4000 to 8000 laser shots per spectrum were acquired at 2 kHz laser repetition rate. Intact MWs of the subunits were determined automatically with a Compass script that uses the multiply-charged ions produced in the mixture with DHAC to calculate the MW of each subunit and create a PDF report of the results. The LC fractionated subunits were analyzed in a 2-step approach. First, all fractions were automatically analyzed in linear positive ion mode using the WARP-LC 1.3 software. The results were visualized in the SurveyViewer of the same program (Fig. S1). Fractions containing subunits were further analyzed manually in positive reflector ion mode at slightly elevated laser power and parameters optimized for a mass range from 1-8 kDa, as previously described and extended to 15 kDa.Citation17 T3-spectra were acquired using the default LIFT method provided by the manufacturer.Citation10 An ISD fragment of the c-ion series between 1500 and 2500 Da was selected as precursor; 2000 laser shots were used to acquire the parent ion spectrum and another 8000 shots for the fragment ions. Monoisotopic peaks were annotated using the SNAP algorithm, TDS/MDS spectra were automatically matched to a user defined sequence database and the results for best matching sequences were reported. Sequence tags were automatically generated in BioTools and interactive sequence assignments were obtained using the Compass software.Citation17 The software routines permitted the assignment of dipeptide sequences in order to close proline gaps.Citation41 The ISD fragment ions were initially assigned with an MS/MS tolerance of 0.5 Da below 8 kDa and of 1.0 Da above.
The degree to which the protein sequence is validated by its matched upstream sequence was quantified by the “Sequence Validation Percentage” (SVP %) parameter. For the SVP calculation, all peptide bonds accounted for by fragments are added. In addition, those gaps are added and count as validated if: (a) sequence readout begins no later than at the 13th residue from either terminus, which is typically the case with a matching sequence: (b) they can be attributed to PX or PPX proline gaps: and (c) the gap is 1 residue long or is shorter than 6 residues with at least twice the number of continuously matching fragments downstream the sequence. For example, if the sequence tags read precisely at the expected fragment ion masses downstream of such a gap, the upstream sequence is considered validated since sequence length variations or unexpected modifications can be safely excluded. The SVP values throughout this work were calculated by division of this sum of validated peptide bonds by the total number of peptide bonds in the sequence. SVP values were automatically determined by the BioTools software.
LC-UHR-QTOF middle-up measurements
Thirty µL of each of the IdeS-digested antibody samples were analyzed by LC-MS using an Acquity UPLC H-Class system (Waters, MA, USA) coupled to a maXis II UHR-QTOF mass spectrometer (Bruker) and controlled by BioPharma Compass 1.1 (Bruker). A detailed description of the TOF mass analyzer components (i.e., collision cell, reflector and detector) is described elsewhere.Citation42
Four µg of the mixture were loaded on the column and eluted using a gradient program at a flow rate of 0.2 mL/min (23 min at 5% solvent B followed by a linear gradient of 5-24% solvent B in 3 min, 24–40% in 30 min, 40–80% in 1 min, 5 min at 80% and reconditioning of the column at 5%). Following data acquisition, the raw spectra from the detected chromatographic peaks were deconvoluted using the Maximum Entropy algorithm and monoisotopic MWs of the subunits were then determined by the SNAP algorithm. For mass calculations, Sequence Editor software uses a Periodic table based on the NIST Atomic Weights and Isotopic Compositions (version 2.3.1, http://www.nist.gov/pml/data/comp-version.cfm).Citation43
Disclosure of potential conflicts of interest
No potential conflicts of interest were disclosed.
Author Information
Author Contributions The manuscript was written through contributions of all authors. All authors have given approval to the final version of the manuscript.
KMAB_A_1128607_s02.docx
Download MS Word (2.3 MB)References
- Beck A, Wurch T, Bailly C, Corvaia N. Strategies and challenges for the next generation of therapeutic antibodies. Nat Rev Immunol 2010; 10(5):345–52; PMID:20414207; http://dx.doi.org/10.1038/nri2747
- Reichert JM. Antibodies to watch in 2016. MAbs 2016; 8(2): in press
- Wurch T, Lowe P, Caussanel V, Bes C, Beck A, Corvaia N. Development of novel protein scaffolds as alternatives to whole antibodies for imaging and therapy: status on discovery research and clinical validation. Curr Pharm Biotechnol 2008; 9(6):502–9; PMID:19075688; http://dx.doi.org/10.2174/138920108786786385
- Du Y, Wang F, May K, Xu W, Liu H. Determination of deamidation artifacts introduced by sample preparation using 18O-labeling and tandem mass spectrometry analysis. Anal Chem 2012; 84(15):6355–60; PMID:22881398; http://dx.doi.org/10.1021/ac3013362
- Fornelli L, Damoc E, Thomas PM, Kelleher NL, Aizikov K, Denisov E, Makarov A, Tsybin YO. Analysis of intact monoclonal antibody IgG1 by electron transfer dissociation Orbitrap FTMS. Mol Cell Proteomics 2012; 11(12):1758–67; PMID:22964222; http://dx.doi.org/10.1074/mcp.M112.019620
- Tsybin YO, Fornelli L, Stoermer C, Luebeck M, Parra J, Nallet S, Wurm FM, Hartmer R. Structural analysis of intact monoclonal antibodies by electron transfer dissociation mass spectrometry. Anal Chem 2011; 83(23):8919–27; PMID:22017162; http://dx.doi.org/10.1021/ac201293m
- Mao Y, Valeja SG, Rouse JC, Hendrickson CL, Marshall AG. Top-down structural analysis of an intact monoclonal antibody by electron capture dissociation-Fourier transform ion cyclotron resonance-mass spectrometry. Anal Chem 2013; 85(9):4239–46; PMID:23551206; http://dx.doi.org/10.1021/ac303525n
- Fornelli L, Ayoub D, Aizikov K, Beck A, Tsybin YO. Middle-down analysis of monoclonal antibodies with electron transfer dissociation orbitrap fourier transform mass spectrometry. Anal Chem 2014 Mar 18; 86(6):3005–12; PMID:24588056; http://dx.doi.org/10.1021/ac4036857
- Lennon JJ, Walsh KA. Direct sequence analysis of proteins by in-source fragmentation during delayed ion extraction. Protein Sci. 1997; 6(11):2446–53; PMID:9385647; http://dx.doi.org/10.1002/pro.5560061118
- Suckau D, Resemann A. T3-sequencing: targeted characterization of the N- and C-termini of undigested proteins by mass spectrometry. Anal Chem. 2003; 75(21):5817–24; PMID:14588022; http://dx.doi.org/10.1021/ac034362b
- Suckau D, Resemann A, Schuerenberg M, Hufnagel P, Franzen J, Holle A. A novel MALDI LIFT-TOF/TOF mass spectrometer for proteomics. Anal Bioanal Chem. 2003; 376(7):952–65; PMID:12830354; http://dx.doi.org/10.1007/s00216-003-2057-0
- Hardouin J. Protein sequence information by matrix-assisted laser desorption/ionization in-source decay mass spectrometry. Mass Spectrom Rev. 2007; 26(5):672–82; PMID:17492750; http://dx.doi.org/10.1002/mas.20142
- Takayama M. N-Ca Bond Cleavage of the Peptide Backbone via Hydrogen Abstraction. J Am Soc Mass Spectrom. 2001; 12:1044–49; http://dx.doi.org/10.1016/S1044-0305(01)00289-6
- DemeureK, GabelicaV, De PauwEA. New advances in the understanding of the in-source decay fragmentation of peptides in MALDI-TOF-MS. J Am Soc Mass Spectrom 2010; 21(11):1906–17; PMID:20832332; http://dx.doi.org/10.1016/j.jasms.2010.07.009
- Hanisch FG. Top-down sequencing of O-glycoproteins by in-source decay matrix-assisted laser desorption ionization mass spectrometry for glycosylation site analysis. Anal Chem 2011; 83(12):4829–37; PMID:21526855; http://dx.doi.org/10.1021/ac200493c
- Yoo C, Suckau D, Sauerland V, Ronk M, Ma M. Toward top-down determination of PEGylation site using MALDI in-source decay MS analysis. J Am Soc Mass Spectrom 2009; 20(2):326–33; PMID:19019698; http://dx.doi.org/10.1016/j.jasms.2008.10.013
- Resemann A, Wunderlich D, Rothbauer U, Warscheid B, Leonhardt H, Fuchser J, Kuhlmann K, Suckau D. Top-down de Novo Protein Sequencing of a 13.6 kDa Camelid Single Heavy Chain Antibody by Matrix-Assisted Laser Desorption Ionization-Time-of-Flight/Time-of-Flight Mass Spectrometry. Anal Chem 2010; 82(8):3283–92; PMID:20329751; http://dx.doi.org/10.1021/ac1000515
- Ayoub D, Jabs W, Resemann A, Evers W, Evans C, Main L, Baessmann C, Wagner-Rousset E, Suckau D, Beck A. Correct primary structure assessment and extensive glyco-profiling of cetuximab by a combination of intact, middle-up, middle-down and bottom-up ESI and MALDI mass spectrometry techniques. MAbs 2013; 5(5):699–710; PMID:23924801; http://dx.doi.org/10.4161/mabs.25423
- von Pawel-Rammingen U, Johansson BP, Björck L. IdeS, a novel streptococcal cysteine proteinase with unique specificity for immunoglobulin G. EMBO J. 2002; 21(7):1607–15; PMID:11927545; http://dx.doi.org/10.1093/emboj/21.7.1607
- An Y, Zhang Y, Mueller HM, Shameem M, Chen X. A new tool for monoclonal antibody analysis: Application of IdeS proteolysis in IgG domain-specific characterization. MAbs. 2014; 6(4):879–93; PMID:24927271; http://dx.doi.org/10.4161/mabs.28762
- Li S, Schmitz KR, Jeffrey PD, Wiltzius JJ, Kussie P, Ferguson KM. Structural basis for inhibition of the epidermal growth factor receptor by cetuximab. Cancer Cell 2005; 7(4):301–11; PMID:15837620; http://dx.doi.org/10.1016/j.ccr.2005.03.003
- Dubois M, Fenaille F, Clement G, Lechmann M, Tabet JC, Ezan E, Becher F. Immunopurification and mass spectrometric quantification of the active form of a chimeric therapeutic antibody in human serum. Anal Chem 2008; 80(5):1737–45; PMID:18225864; http://dx.doi.org/10.1021/ac7021234
- Allhorn M, Collin M. Sugar-free antibodies–the bacterial solution to autoimmunity? Ann N Y Acad Sci 2009; 1173:664–9; PMID:19758213; http://dx.doi.org/10.1111/j.1749-6632.2009.04739.x
- Wang X, Das TK, Singh SK, Kumar S. Potential aggregation prone regions in biotherapeutics: A survey of commercial monoclonal antibodies. MAbs 2009; 1(3):254–67; PMID:20065649; http://dx.doi.org/10.4161/mabs.1.3.8035
- Gorman JJ, Ferguson BL, Nguyen TB. Use of 2,6-dihydroxyacetophenone for analysis of fragile peptides, disulphide bonding and small proteins by matrix-assisted laser desorption/ionization. Rapid Commun Mass Spectrom. 1996; 10(5):529–36; PMID:9053038; http://dx.doi.org/10.1002/(SICI)1097-0231(19960331)10:5<529::AID-RCM522>3.0.CO;2-9
- Beck A. Biosimilar, biobetter and next generation therapeutic antibodies. MAbs 2011; 3(2):107–10; PMID:21285536; http://dx.doi.org/10.4161/mabs.3.2.14785
- Schoeninger MJ, DeNiro MJ. Nitrogen and carbon isotopic composition of bone collagen from marine and terrestrial animals. Geochim Cosmochim Acta 1984; 48(12):625–39; http://dx.doi.org/10.1016/0016-7037(84)90091-7
- Beavis RC. Chemical mass of carbon in proteins. Anal Chem 1993; 65(4):496–7; http://dx.doi.org/10.1021/ac00052a030
- Senko MW, Beu SC, McLafferty FW. Determination of monoisotopic masses and ion populations for large biomolecules from resolved isotopic distributions. J Am Soc Mass Spectrom 1995; 6(4):229–33; PMID:24214167; http://dx.doi.org/10.1016/1044-0305(95)00017-8
- Köster C. Mass spectrometry method for accurate mass determination of unknown ions. 2001, US 6,188,064 B1
- Macht M, Asperger A, Deininger SO. Comparison of laser-induced dissociation and high-energy collision-induced dissociation using matrix-assisted laser desorption/ionization tandem time-of-flight (MALDI-TOF/TOF) for peptide and protein identification. Rapid Commun Mass Spectrom 2004; 18(18):2093–2105; PMID:23857929; http://dx.doi.org/10.1002/rcm.1589
- Asakawa D, Smargiasso N, De Pauw E. New approach for pseudo-MS(3) analysis of peptides and proteins via MALDI in-source decay using radical recombination with 1,5-diaminonaphthalene. Anal Chem 2014; 86(5):2451–7; PMID:24512348; http://dx.doi.org/10.1021/ac403285b
- Edman P. Sequence determination. Mol Biol Biochem Biophys 1970; 8:211–55; PMID:4950190
- Katta V, Chow DT, Rohde MF. Applications of in-source fragmentation of protein ions for direct sequence analysis by delayed extraction MALDI-TOF mass spectrometry. Anal Chem 1998; 70(20):4410–6; PMID:9796424; http://dx.doi.org/10.1021/ac980034d
- Bunger MK, Cargile BJ, Ngunjiri A, Bundy JL, Stephenson JL, Jr. Automated proteomics of E. coli via top-down electron-transfer dissociation mass spectrometry. Anal Chem 2008; 80(5):1459–67; PMID:18229893; http://dx.doi.org/10.1021/ac7018409
- Dang X, Scotcher J, Wu S, Chu RK, Tolić N, Ntai I, Thomas PM, Fellers RT, Early BP, Zheng Y, et al. The first pilot project of the consortium for top-down proteomics: a status report. Proteomics 2014; 14(10):1130–40; PMID:24644084; http://dx.doi.org/10.1002/pmic.201300438
- Lemaire P, Debois D, Smargiasso N, Quinton L, Gabelica V, De Pauw EA. Use of 1,5-diaminonaphthalene to combine matrix-assisted laser desorption/ionization in-source decay fragmentation with hydrogen/deuterium exchange. Rapid Commun Mass Spectrom 2013; 27(16):1837–46; PMID:23857929; http://dx.doi.org/10.1002/rcm.6627
- Ayoub D, Fornelli L, Srzentic K, Laskay U, Beck A, Tsybin YO. Middle-Down and Extended Bottom-Up Mass Spectrometry for In-Depth and Rapid Characterization of Immunoglobulins and Their Mixtures. 2014, Proc. of the 62nd ASMS Conference on Mass Spectrometry and Allied Topics; June 15–19, 2014, Baltimore, Maryland: MOE- 08:50
- Srzentić K, Fornelli L, Laskay LA, Monod M, Beck A, Ayoub D, Tsybin YO. Advantages of extended bottom-up proteomics using sap9 for analysis of monoclonal antibodies. Anal Chem 2014; 86(19):9945–53; PMID:25207962; http://dx.doi.org/10.1021/ac502766n
- Fornelli L, Parra J, Hartmer R, Stoermer C, Lubeck M, Tsybin YO. Top-down analysis of 30-80 kDa proteins by electron transfer dissociation time-of-flight mass spectrometry. Anal Bioanal Chem 2013; 405(26):8505–14; PMID:23934349; http://dx.doi.org/10.1007/s00216-013-7267-5
- Ma M, Chen R, Ge Y, He H, Marshall AG, Li L. Combining bottom-up and top-down mass spectrometric strategies for de novo sequencing of the crustacean hyperglycemic hormone from Cancer borealis. Anal Chem 2009; 81(1):240–7; PMID:19046072; http://dx.doi.org/10.1021/ac801910g
- Beck S, Michalski A, Raether O, Lubeck M, Kaspar S, Goedecke N, Baessmann C, Hornburg D, Meier F, Paron I, et al. The impact II, a very high resolution quadrupole time-of-flight instrument for deep shotgun proteomics. Mol Cell Proteomics 2015; 14(7):2014–29; PMID:25991688; http://dx.doi.org/10.1074/mcp.M114.047407
- Coursey JS, Schwab DJ, Dragoset RA. Atomic Weights and Isotopic Compositions. http://physics.nist.gov/Comp 2003, June 25, 2001, National Institute of Standards and Technology, Gaithersburg, MD, Vols. (version 2.3.1), [Online]