
 ?Mathematical formulae have been encoded as MathML and are displayed in this HTML version using MathJax in order to improve their display. Uncheck the box to turn MathJax off. This feature requires Javascript. Click on a formula to zoom.
ABSTRACT
Preferential interactions of weakly interacting formulation excipients govern their effect on the equilibrium and kinetics of several reactions of protein molecules in solution. Using vapor pressure osmometry, we characterized the preferential interactions of commonly used excipients trehalose, L-arginine.HCl and NaCl with three therapeutically-relevant, IgG1 monoclonal antibodies that have similar size and shape, but differ in their surface hydrophobicity and net charge. We further characterized the effect of these excipients on the reversible self-association, aggregation and viscosity behavior of these antibody molecules. We report that trehalose, L-arginine.HCl and NaCl are all excluded from the surface of the three IgG1 monoclonal antibodies, and that the exclusion behavior is linearly related to the excipient molality in the case of trehalose and NaCl, whereas a non-linear behavior is observed for L-arginine.HCl. Interestingly, we find that the magnitude of trehalose exclusion depends upon the nature of the protein surface. Such behavior is not observed in case of NaCl and L-arginine.HCl as they are excluded to the same extent from the surface of all three antibody molecules tested in this study. Analysis of data presented in this study provides further insight into the mechanisms governing excipient-mediated stabilization of mAb formulations.
Introduction
Monoclonal antibodies (mAbs) are a dominant class of therapeutic proteins that have been approved for the treatment of a variety of diseases in humans.Citation1-4 Subcutaneous administration of mAb products increase their relative ease of use and enhance patient compliance.Citation5 Such drugs typically require high concentration formulations due to the high dosage requirements of mAb therapies and the upper limit on injection volume for subcutaneous administration.Citation6,7 A major challenge in the development of high concentration mAb formulations is the increased propensity for physical stability issues like aggregation and high viscosity.Citation8,9 Apart from employing protein engineering approaches,Citation10-12 physical stability of high concentration mAb solutions can also be enhanced through addition of various excipients like sugars, salts and amino acids.Citation13,14 Due to the lack of clear mechanistic understanding of excipient-mediated stabilization, current approaches to formulation development involve high-throughput screening of several excipient combinations to identify a formulation that minimizes mAb instability.Citation15,16
A rational approach to formulation development requires both a detailed understanding of reaction pathways responsible for aggregation and high viscosity of mAb formulations, as well as the impact of protein-excipient interactions on the kinetics and equilibrium of critical reactions within these pathways. Significant work has been undertaken to understand and identify the critical steps involved in mAb aggregation and high viscosity,Citation17-20 but detailed understanding of the nature of mAb-excipient interaction is currently lacking.
Through their seminal papers, Schellman, TimasheffCitation21-24 and others have laid the foundation for the preferential interaction theory framework that describes the nature and magnitude of protein-excipient interactions in terms of the preferential interaction co-efficient (Γμ3). Using a modified Wyman-linkage function,Citation25 one can estimate the effect of excipient addition on the free energy of protein reactions from the value of Γμ3. Thus, the magnitude of protein-excipient interactions can be linked quantitatively to the effect of excipient addition on the kinetics and equilibrium of protein reactions in aqueous solutions. Hong et al.Citation26 have developed a vapor pressure osmometry based method to determine Γμ3. This method has the advantage of requiring smaller volume of protein solution, faster acquisition times and higher precision in the estimation of preferential interaction co-efficient, as compared to the traditional dialysis/densimetry method.
Although previous studies have explored the interaction of co-solutes with small model proteins,Citation27-30 preferential interaction data for excipients generally regarded as safe with therapeutically relevant mAbs in a concentration range suitable for parenteral formulations is lacking. In this study, we characterized the nature and magnitude of preferential interactions of trehalose, L-arginine.HCl and sodium chloride (NaCl), with three therapeutically relevant IgG1 mAbs. We also characterized the effect of these excipients on several physical instabilities of the antibody molecules, including protein unfolding and reversible self-association in dilute solution, and aggregation and viscosity at high protein concentration. Taken together, these data provide further insight into the mechanism of protein stabilization by these commonly used excipients.
Results
Antibodies
To understand the nature and magnitude of preferential interactions of formulation excipients, we chose three therapeutically-relevant IgG1 mAbs. To estimate the molecular weight of the three antibodies, we conducted a multi-angle light scattering (MALS) analysis on the native state monomeric antibodies fractionated using a size exclusion chromatography (SEC) column. As shown in , all three antibodies have similar molecular weights of ∼145–150 kDa. The spatial aggregation propensity (SAP) score, which quantifies the exposed hydrophobic surface area of an antibody, was calculated for each energy minimized and equilibrated antibody structure.Citation10 As listed in , the SAP score is highly similar for mAbA and mAbB at ∼580, but is significantly higher for mAbC at ∼677 units, indicating that mAbC is much more hydrophobic compared to mAbA and mAbB. The charge on each antibody was determined by assigning the predicted charged state for each side chain in the computational antibody models at a pH of 5.5 units and summing the charges for solvent-exposed amino acids. The positive and negative charges are similar for mAbA and mAbB and the net charge is positive. mAbC has fewer positive charges and a similar number of negative charges compared to mAbA and mAbB, and consequently has a lower net positive charge. Thus, the three antibodies have similar shape and size, but different surface hydrophobicity and net charge.
Table 1. Surface and molecular attributes of mAbA, mAbB and mAbC. Molecular weights of mAbA, mAbB and mAbC were determined by analyzing the monomer peak eluted from a size exclusion chromatography column using a miniDawn TREOS MALS detector. Partial molar volume of the antibodies was determined by performing a densimetry assay as a function of antibody concentration in 25 mM Na-acetate buffer at pH 5.5 at 20°C. Total point charges were determined by summing the predicted point charges of solvent accessible residues at pH 5.5 using a homology model of mAbA, mAbB and mAbC. The surface aggregation propensity (SAP) score which is a measure of the surface hydrophobicity of mAb molecules was calculated using molecular dynamics simulations.
Preferential interactions of trehalose, L-arginine.HCl and NaCl
We first determined the partial molar volumes of the three excipients and the three antibodies in the 25 mM Na-acetate buffer at pH 5.5. lists the partial molar volume data (2) for the three antibodies. The partial molar volumes for mAbB and mAbC are quite similar and equal to about 103.6 L/mol. The partial molar volume for mAbA is slightly higher at 104.6 L/mol. Supplementary Table 1 lists the partial molar volume data for the three excipients as a function of excipient molality. The partial molar volume for trehalose shows a linear trend and decreases with increasing molality. The partial molar volume for NaCl is also linearly related to the molality, but shows an increase with increasing molality. The partial molar volume for L-arginine.HCl shows a non-linear behavior with respect to its molality. The partial molar volume of L-arginine.HCl increases with increasing molality in the concentration range of 0–1 M, but the rate of increase is lower at higher molality.
Next, we quantified the chemical potential derivatives μ23,4 and preferential interaction co-efficients (Γμ3) for the three excipients using the method of Hong et al.Citation26 with a series of 16 binary and ternary solutions each for trehalose and NaCl and 24 binary and ternary solutions each for L-arginine.HCl. The osmolality values of the non-ideal ternary solutions deviate from their theoretical ideal solution value, and it is this difference between ideal and non-ideal solution osmolality that is used to capture the preferential interaction of excipients with the protein surface using the method of vapor pressure osmometry. The vapor pressure osmometry experiments were conducted at room temperature and atmospheric pressure conditions. As shown in , all three excipients have positive values for μ23,4 and consequently negative values of Γμ3 in the concentration range of 0–0.4 molal. Thus, all three excipients are excluded from the surface of all three mAb molecules characterized in this study.
Figure 1. Preferential interactions of mAbA (black), mAbB (red) and mAbC (blue) with the excipients trehalose (A, D), NaCl (B, E) and L-arginine.HCl (C, F) in the concentration range of 0–0.4 molal at room temperature. Vapor pressure osmometry measurements were carried out at room temperature to determine the differential change in protein chemical potential upon excipient addition, (A–C), and the corresponding preferential interaction co-efficient at constant co-solute chemical potential, Γμ3 (D–F), for each antibody-excipient combination as indicated. Error bars denote the propagated standard deviation of the osmolality data that is used to calculate
and Γμ3 at each concentration.
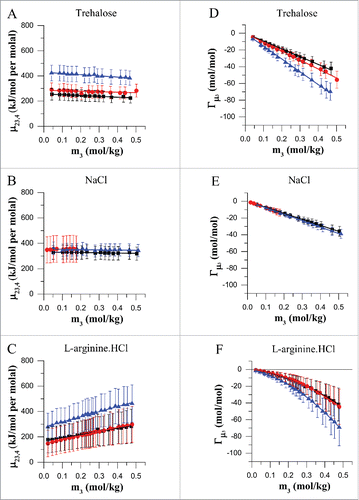
As shown in , the chemical potential derivative μ23,4 for trehalose is relatively constant in the concentration range of 0–0.4 molal with a value of roughly ∼240 kJ/mol of protein per molal of trehalose for mAbA, ∼270 kJ/mol per molal for mAbB and ∼400 kJ/mol per molal for mAbC. The preferential interaction co-efficient for trehalose is linear with respect to excipient molality (). This is consistent with previous literature for smaller globular proteins with trehalose and other sugars like sucrose that exhibit preferential exclusion behaviour.Citation29,31 As shown in , the Γμ3 for mAbA and mAbB are very similar and have a value of ∼ −12 at 0.1 M concentration of trehalose. By the definition of preferential interaction co-efficient, this means that addition of every molecule of protein requires the net removal of ∼12 molecules of trehalose to maintain trehalose chemical potential at 100 mM concentration of trehalose. As seen in and , the degree of exclusion of trehalose is significantly higher from the surface of mAbC antibody compared to mAbA and mAbB. As the three antibodies have similar shape and sizes, but significantly different surface hydrophobicity and net charge (), we conclude that the degree of exclusion of trehalose depends significantly on protein surface features. The potential for greater exclusion from a hydrophobic surface is supported by the observations of Hong et al.Citation32 who found that trehalose is excluded to a greater extent from aliphatic carbon in solution. Further analysis using molecular dynamic simulations will provide greater insight into the effect of protein surface features on the exclusion of trehalose.
Table 2. Best fit equations for the preferential interaction co-efficient at constant co-solute chemical potential, Γμ3, and transfer free energy, Δμ2, transfer, as a function of excipient molality. The preferential interaction co-efficient data for trehalose and NaCl was fitted using a linear fitting algorithm and that for L-arginine.HCl was fitted using a non-linear fitting algorithm in Origin. The error bars in the bracket denote the standard error of fit. Transfer free energy values, Δμ2, transfer were calculated by integrating the fitting equations for as a function of excipient molality (m3) for the indicated combinations of protein and excipient at room temperature using vapor pressure osmometry technique.
The chemical potential derivative μ23,4 for NaCl is also relatively constant with increasing NaCl molality in the range of 0–0.4 molal with a constant value of ∼350 kJ/mol of protein per molal of NaCl (). The magnitude of Γμ3 for NaCl is linearly related to excipient molality. As seen from the and , the degree of exclusion is lower than that for trehalose, throughout the concentration range tested in this study. The magnitude for the degree of exclusion is similar for the three antibodies tested, and is roughly equal to −8.0 molecules of NaCl per molecule of protein at 0.1 M concentration of NaCl. Thus, to maintain the chemical potential of NaCl, roughly 8 molecules of NaCl need to be removed for the addition of every protein molecule. The molarity of NaCl for the mAbB experiments was limited below 0.2 M as mAbB formed precipitates at NaCl concentration above 0.2 M.
For L-arginine.HCl, the chemical potential derivative μ23,4 shows a linear trend with increasing L-arginine.HCl concentration ranging in value between 150 to 450 kJ/mol per molal in the concentration range of 0–0.4 molal of L-arginine.HCl (). The Γμ3 value shows a non-linear dependence on the excipient molality (). The preferential interaction co-efficient decreases at a higher rate at higher concentrations of L-arginine.HCl. This behavior has previously been observed by Schneider et al.Citation27,33 with smaller globular proteins like lysozyme, α-chymotrypsinogen and bovine serum albumin (BSA). The magnitude of preferential interactions is very low at the low concentrations typically used for subcutaneous formulations. For example, at a concentration of ∼0.1 M the value of Γμ3 is ∼ −4 mols of L-arginine.HCl per mole of protein. Thus, addition of one molecule of protein requires the net removal of ∼4 molecules of L-arginine.HCl to maintain the chemical potential of L-arginine.HCl in a solution containing L-arginine.HCl, buffer, water and mAb. The magnitude of preferential interaction co-efficient for L-arginine.HCl is similar in the case of three antibodies. Thus, at least within the experimental error, no significant difference was found for the interaction of L-arginine.HCl with antibody surface features like hydrophobicity and net charge.
The preferential interactions of weakly interacting excipients modulates the thermodynamic equilibrium of protein reactions in solution by differentially changing the chemical potential of the reactant and product protein configurations in the solution. The change in the chemical potential of a protein molecule in the presence of an excipient molecule compared to a condition in the absence of the given excipient molecule is called the transfer free energy, Δμ2, transfer. The transfer free energy for a given protein excipient combination can be calculated using the following equation.
Thus, knowing the chemical potential derivative as a function of excipient molality, one can determine the transfer free energy for each protein in a given excipient solution. and list the transfer free energy for the three antibody molecules as a function of excipient molality. As exclusion of the co-solvent molecules leads to an unfavorable interaction between the protein and the co-solute at constant co-solute molality, the transfer free energy for the native state protein is positive for all combinations of antibodies and excipients tested in this study.
Figure 2. Transfer free energy for mAbA (A), mAbB (B) and mAbC (C). Transfer free energies, Δμ2,transfer, for mAbA, mAbB and mAbC were calculated for the transfer from 25 mM Na-acetate buffer at pH 5.5 to the same buffer containing, additionally either trehalose (black), sodium chloride (red) or L-arginine.HCl (blue) at 20°C.
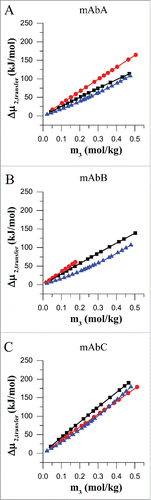
The trend of transfer free energy was found to be linear with respect to co-solute molality for both trehalose and NaCl. The transfer free energy was found to be non-linear, with the slope of the curve increasing at higher concentrations of L-arginine.HCl (). For all three antibodies, the transfer free energy is lowest in the case of L-arginine.HCl and has a magnitude of roughly ∼+18 kJ/mol at an L-arginine.HCl concentration of ∼0.1 molal (). The transfer free energy for trehalose and NaCl are similar in magnitude for mAbA () and mAbB () up to at least 0.2 molal concentration. Due to the enhanced exclusion of trehalose from the surface of mAbC (), the transfer free energy for trehalose is significantly higher (∼+84 kJ/mol at 0.2 molal trehalose) than that for NaCl (∼70 kJ/mol at 0.2 molal NaCl).
Effect of excipient addition on mAb unfolding and reversible self-association
To further understand the nature of excipient-protein interaction, we characterized the effect of excipient addition on two commonly reported parameters for protein formulations: shift in the midpoint transition temperature (ΔTm) in differential scanning calorimetry (DSC) analysis and dynamic light scattering (DLS) interaction parameter (kD). To characterize the effect on unfolding, we carried out a DSC assay to identify the midpoint melting transition temperature (Tm) of the antibodies in the presence and absence of excipients. Supplementary Table 2 lists the Tm values for the various domains of the three antibodies tested in this study. In all DSC runs, except in the presence of buffer alone and with trehalose for mAbA and in the presence of trehalose for mAbC, the antibody aggregated irreversibly by the end of the thermal scan. Thus, the transitions are irreversible and cannot be analyzed using assumptions of thermodynamic equilibrium. Nonetheless, in several protein formulation studies an increase in the Tm values has been found to be correlated with an increase in the conformational stability of mAb molecules.Citation16 Thus, we included the data on Tm shifts for comparison to other literature. indicates the deviation of Tm values, ΔTm, compared to the values for the corresponding domains in buffer alone.
Figure 3. ΔTm analysis for the Fab, P1 and P2 transitions of mAbA (A), mAbB (B) and mAbC (C). Shift in Tm values with respect to 25 mM Na-acetate buffer alone, ΔTm, are plotted. Positive ΔTm values indicate an increase in the Tm value compared to that in the presence of buffer alone and vice versa. NaCl and L-arginine.HCl were used at a final concentration of 100 mM, whereas trehalose was used at a final concentration of 200 mM.
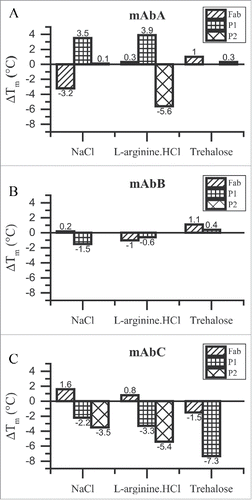
As shown in , trehalose stabilizes the Fab and P2 transition of the mAbA antibody () and the Fab and P1 transition of mAbB (). In both cases, the stabilization is greater in the case of the Fab domain compared to either P1 or P2 transition. Although trehalose is excluded to a greater extent from the mAbC at room temperature, it has a destabilizing effect on the Tm values of Fab and P1 transition of the mAbC (). This could be attributed to the dependence of Γμ3 on temperature. The effect of L-arginine.HCl on antibody melting seems to depend upon the individual domain. L-arginine.HCl stabilizes the P1 and Fab domains of mAbA, and Fab domain of mAbC. It destabilizes the P2 transition of mAbA, P1 and Fab domain of mAbB and P1 and P2 transitions of mAbC. The effect of NaCl also seems to depend upon the antibody domain. NaCl stabilizes the P1 and P2 transitions of mAbA and the Fab domains of mAbB and mAbC, whereas it destabilizes the Fab domain of mAbA, P1 transition of mAbB and P1 and P2 transition of mAbC.
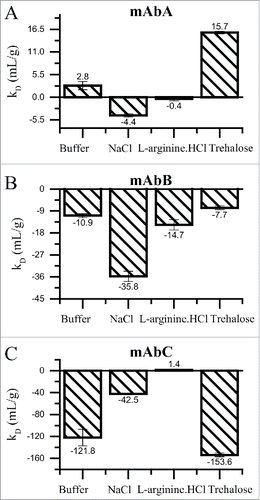
To characterize the effect of excipient addition on reversible self-association, we determined the DLS interaction parameter kD, as this parameter has been previously shown to be a good predictor of protein-protein interaction.Citation34,35 In general, an increase in the kD value indicates lowering of the protein-protein interaction. The DLS interaction parameter was characterized for the three mAbs in the presence of trehalose, L-arginine.HCl and NaCl, and in the presence of buffer alone. As shown in , colloidal stability decreases with the addition of trehalose in the case of mAbC, NaCl in the case of mAbA and mAbB and for L-arginine.HCl in the case of mAbA and mAbB. Interestingly, a decrease in protein-protein interaction is observed in the case of trehalose with mAbA and mAbB, and for NaCl and L-arginine.HCl with mAbC.
Figure 4. kD analysis for mAbA (A), mAbB (B) and mAbC (C) in 25 mM Na-acetate, pH 5.5 buffer alone or in combination with 100 mM sodium chloride, 100 mM L-arginine.HCl or 200 mM trehalose. DLS measurements were conducted at 25°C to estimate the apparent diffusion co-efficient of mAbA and mAbB in the concentration range of 0–25 mg/mL and from 0–4 mg/mL for mAbC. The resulting data were fit with Origin's linear fitting algorithm to estimate the DLS interaction parameter “kD” value, which has been previously shown to correlate with the reversible self-association of proteins in solution. Error bars represent the standard error in the estimation of the slope of the linear fit.
Effect of excipient addition on the accelerated aggregation kinetics of high-concentration solutions of mAbs
Weakly-interacting excipients can modulate the aggregation rate of proteins in solution by differentially changing the transfer free energy of the native state and the transition state for the rate determining step in the aggregation cascade. To probe the effect of excipient addition on their aggregation behavior, mAbA, mAbB and mAbC were incubated at an elevated temperature. The incubation temperature was chosen so as to obtain 5–10% aggregation in a period of 10–15 days. The low aggregation rate was purposefully chosen to obtain data that would be representative of the storage stability of mAb formulations where an aggregate content of more than 5% over the shelf life is undesirable and raises concerns of potential immunogenicity of protein aggregates.Citation36 The incubated mAb solutions were fractionated on a size-exclusion chromatography column to determine % monomer left in solution as a function of time. To ensure that the loss in monomer was primarily due to aggregation and not due to fragmentation or any other process, we also tracked the area under the curve for the corresponding fragment and aggregate peaks. As shown in Supplementary Fig. 1, monomer peak was identified in the aggregated sample by using the MALS detector. The resulting data for monomer loss was fitted to a first-order rate law to determine the monomer loss rate constant. To contextualize the impact of excipient addition on the aggregation reaction energetics compared to the impact on the energetics of the entire native antibody molecule, we determined the change in activation barrier upon excipient addition for a hypothetical single step, rate determining reaction, ΔΔμ2,transfer using the following equation:Citation37
shows the aggregation kinetics of the three antibodies in the presence of trehalose, L-arginine.HCl and NaCl. The data is presented in the form of k/k0 where k represents the first order monomer loss rate constant for the given excipient and k0 represents the monomer loss rate constant for the given antibody molecule in the presence of 25 mM Na-acetate, pH 5.5 buffer alone. As can be seen from , significant stabilization/destabilization effects are observed in the case of mAbA. For mAbB and mAbC, trehalose has slight stabilization of ∼1.4-fold for the aggregation kinetics compared to buffer alone. This means that the transition state barrier is increased by ∼0.8 kJ/mol compared to the native state. This is a very small increase compared to the transfer free energy of ∼50 kJ/mol for mAbB and ∼84 kJ/mol for mAbC native state. Trehalose also has a stabilizing effect of ∼2-fold on the aggregation kinetics of mAbA. The transition state barrier in this case is increased by 1.3 kJ/mol.
Table 3. Aggregation kinetics and apparent activation free energy change for aggregation of mAbA, mAbB and mAbC. mAbA and mAbB were incubated at 52.5 °C and mAbC was incubated at 42.5 °C with either 25 mM Na-acetate buffer at pH 5.5 alone or in combination with the indicated excipient. The % monomer loss data was fitted as a function of time to obtain a first order monomer loss rate constant “k”. The ratio k/k0 represents the ratio of the first order aggregation rate constant in the presence of the indicated excipient compared to the rate constant for a given antibody in the presence of 25 mM Na-acetate buffer alone. The activation transfer free energy, ΔΔμ2,transfer was determined from the k/k0 values by assuming a hypothetical kinetic pathway involving a single rate determining activation step. The values for mAbC in the presence of NaCl are omitted due to negligible change in % monomer over the course of incubation at the accelerated temperature of 42.5 °C.
NaCl and L-arginine.HCl increase the aggregation kinetics of mAbA. The transition state barrier is decreased by about 2.1 kJ/mol for NaCl and by 1.3 kJ/mol for L-arginine.HCl. Given that the transfer free energy of the native state mAbA in NaCl and L-arginine.HCl is 33.0 kJ/mol and 18.0 kJ/mol, respectively, the observed decrease is again a small fraction of the observed change in the chemical potential for the entire antibody surface.
Effect of excipient addition on the dynamic viscosity of high-concentration solutions of mAbs
The viscosity of high concentration mAb solutions has previously been shown to be dependent upon a combination of long- and short-range interactions between the protein molecules that result in the formation of protein networks.Citation38-40 Excipients are added to mAb solutions to minimize these interactions and break the interaction network, thereby reducing viscosity for a given mAb at a particular concentration and temperature.Citation41,42 To determine the effect of excipient addition on the viscosity of high concentration mAb solutions, we characterized protein solutions using cone and plate rheometry at a protein concentration of ∼100 mg/mL and a temperature of 20°C.
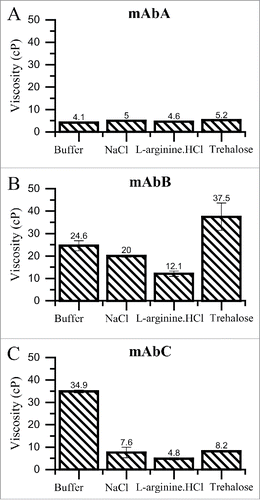
As shown in , mAbA solution in buffer alone has a low viscosity of 4.1 cP. Addition of trehalose, NaCl and L-arginine.HCl does not result in any significant changes in the viscosity of mAbA solutions. For mAbB, the viscosity in the presence of buffer alone is considerable higher and is equal to 24.6 cP. Addition of 100 mM NaCl results in the reduction of viscosity to 20 cP. In the presence of 100 mM L-arginine.HCl, the solution viscosity of mAbB is halved and it reduces to a value of 12.1 cP. On the other hand, addition of 200 mM trehalose results in an increase in the viscosity of mAbB solution. The reduction in viscosity observed in the presence of NaCl and L-arginine.HCl hints at the contribution of charged and aromatic side-chains to protein-protein interaction in mAbB solutions at high concentrations. mAbC solution also has a high viscosity of 34.9 cP in the presence of buffer alone. Interestingly, addition of 100 mM NaCl, 100 mM L-arginine.HCl or 200 mM trehalose, reduce viscosity of mAbC solutions to 7.6, 4.8 and 8.2 cP, respectively.
Figure 5. Viscosity of mAbA (A), mAbB (B) and mAbC (C) solutions at 20°C in the presence of the indicated excipient. Dynamic viscosity of concentrated solutions of mAbA, mAbB and mAbC were determined using cone and plate rheometry at 20°C at a final protein concentration of 100 mg/mL in either 25 mM Na-acetate, pH 5.5 buffer alone or with the addition of 100 mM NaCl, 100 mM L-arginine.HCl or 200 mM trehalose.
Discussion
Physical stability of high concentration liquid mAb formulations is governed by several reversible reactions of the protein in solution that can be classified into either conformational (protein unfolding) or colloidal (protein-protein self-association) destabilization pathways. Conformational destabilization results in an increase in the protein-water interfacial area whereas colloidal destabilization results in a decrease in the interfacial area. The addition of excipients to mAb solutions affects the conformational and colloidal destabilization pathways through their preferential interactions with the protein surface. Excipients that are excluded from the surface of mAb molecules increase the chemical potential of the protein-water interface. Excipients that are preferentially bound to the mAb surface decrease the chemical potential of the protein-water interfacial area. Thus, addition of excluded co-solutes favors a reduction in the protein-water interface. Addition of preferentially bound co-solutes, on the other hand, favors an increase in protein-water interfacial area. Thus, preferentially excluded excipients promote conformational stabilization and colloidal destabilization. Preferentially bound excipients favor conformational destabilization and colloidal stabilization.
In this study, we characterized the preferential interactions of three commonly used excipients, trehalose, NaCl and L-arginine.HCl, with the surface of three mAbs that have similar size, shape and charge, but differ in their surface hydrophobicity as represented by the SAP hydrophobicity score and net charge. We also characterized the effect of excipient addition on the reversible self-association, aggregation and viscosity behavior of high concentration solutions of these three antibodies. The knowledge of excipient preferential interaction with the native state of the mAb molecule, along with its effect on the reversible self-association, aggregation and viscosity behavior, provides an insight into the mechanisms governing the effect of the various excipients on the physical stability of mAb molecules.
Trehalose competes with water molecules to interact with the protein surface through its ability to form hydrogen bonds with amino acids on the surface of the mAb molecules. In this study, we find that trehalose is excluded from the surface of the antibody molecule at all concentrations of trehalose in the range of 0–0.4 molal. The degree of exclusion is linearly related to the concentration of trehalose molecule ( and ). This exclusion is in agreement with previous studies that observed preferential exclusion of sugars and polyols from the surface of protein molecules.Citation29,31 Xie et al.Citation29 have characterized the preferential interaction of trehalose with RNaseA, a small globular protein. The authors find that trehalose is excluded from the surface of the protein molecule, yielding a preferential interaction co-efficient of −4.33 mol/mol at 0.5 M concentration. This value is lower than that observed for the three mAb molecules (∼−60 mol/mol for mAbA and mAbB and ∼−87 mol/mol for mAbC at 0.5 M trehalose) in our study. The lower magnitude of Γμ3 is expected as preferential interaction co-efficient is an additive function that increases with increasing protein-water interfacial area. Thus, RNaseA (13.7 kDa), which is a much smaller protein compared to the mAb molecules (∼150 kDa), would have a smaller protein-water interfacial area, and consequently a lower magnitude of preferential interaction co-efficient. Interestingly, in this study, we found that trehalose is excluded to a significantly greater extent from the surface of mAbC molecule compared to mAbA and mAbB (, ). This suggests that trehalose exclusion is strongly dependent on the nature of the protein surface. This result is supported by the findings of Hong et al.Citation32 who found that, for model small molecule compounds in solution, the exclusion of trehalose from aliphatic carbon is greater compared to other surfaces. Molecular level details of the interaction of trehalose molecule with amino acid side chains are beyond the scope of this study.
NaCl competes with water molecules through its electrostatic interactions with the protein surface. L-arginine.HCl can similarly interact with the protein surface through electrostatic interactions. In addition to the electrostatic interactions, L-arginine.HCl can also form cation-pi interactions with the aromatic side chains on the protein surface.Citation43 In this study, we find that NaCl is excluded from the surface of the three antibody molecules at all concentrations in the range of 0–0.4 molal (, ). The degree of exclusion is also linearly related to the concentration of NaCl. At lower concentrations, L-arginine.HCl is neither excluded nor bound to the mAb surface (, ). As the concentration increases, L-arginine.HCl is strongly excluded from the surface of the mAb molecules. The degree of exclusion follows a non-linear trend with increasing concentrations of L-arginine.HCl. The preferential exclusion observed for NaCl from the surface of mAb molecules is consistent with the results obtained by Arakawa et al.Citation44 for the interaction of 1 M NaCl with the surface of small globular proteins like lysozyme (−5.8 mol/mol at pH 7.0 in 1 M NaCl), BSA (−16.5 mol/mol at pH 7.0 in 1 M NaCl) and β-lactoglobulin (−3.97 mol/mol at pH 7.0 in 1 M NaCl). The degree of exclusion for the smaller proteins is lower than that for mAb molecules (∼−80 mol/mol at 1 M NaCl) in our study. As expected, the magnitude of preferential exclusion is directly related to the protein size and follows the order mAb (∼150kDa) > BSA (∼66.5 kDa) > lysozyme (∼14.3 kDa) ∼ β-lactoglobulin (∼18.4 kDa). Interestingly, our data suggests that the exclusion trend is observed even at the lower concentrations of NaCl that are used for parenteral formulations. This observation of preferential interaction at low salt concentrations supports the specific ion effect observed for the charge screening ability of various salts by Gokarn et al.Citation45 The non-linear trend in the exclusion behavior of L-arginine.HCl was also previously observed by Schneider et al.Citation27 for three small globular proteins lysozyme, α-chymotrypsinogen and BSA. As in our study, Schneider et al.Citation27 observed a strong exclusion from the protein surface at high L-arginine.HCl concentration for lysozyme (−5.0 mol/mol at 1 M L-arginine.HCl), α-chymotrypsinogen (−9.6 mol/mol at 1 M L-arginine.HCl) and BSA (−21.5 mol/mol at 1 M L-arginine.HCl). These values are much lower than that obtained for the mAbs in our study (∼−205.0 mol/mol at 1 M L-arginine.HCl). At low concentrations, L-arginine.HCl interacted favorably with the surface of lysozyme (+0.44 mol/mol at 0.1 M L-arginine.HCl) but, as in this study with mAb molecules, was neither excluded nor bound to the surface of BSA (−0.06 mol/mol at 0.1 M L-arginine.HCl) and α-chymotrypsinogen (−0.015 mol/mol at 1 M L-arginine.HCl). The magnitude of preferential interaction of L-arginine.HCl at high concentration also increases with protein size and follows the order mAb > BSA > α-chymotrypsinogen > lysozyme. Due to the non-linear trend in its preferential interactions, L-arginine.HCl interacts more favorably than NaCl with the protein surface at low concentrations, but more unfavorably at higher concentration. The favorable interaction at low concentration could be due to the ability of L-arginine to interact with aromatic residues in addition to electrostatic interactions. In a molecular dynamics (MD) simulation study, Shukla et al.Citation33 demonstrated the formation of reversible L-arginine clusters at high concentrations. These clusters were shown to be excluded strongly from the surface of the protein molecule. Thus, L-arginine.HCl is excluded strongly from the protein surface at high concentrations.
The preferential interaction data provides an insight into the potential conformational stabilization behavior of these excipient molecules through the preferential interaction mechanism. For an excipient to affect the conformational stability of the mAb molecules, it must be excluded to a greater extent from the surface of a partially unfolded molecule compared to the native state of the molecule. Protein unfolding involves an increase in the protein-water interfacial area. As the magnitude of preferential interactions scales with increasing surface area, preferentially excluded excipients are excluded to a greater extent from the surface of the partially unfolded protein molecule compared to the native state. This results in stabilization of the protein unfolding pathway due to the addition of excluded excipients. Trehalose and NaCl are both excluded from the surface of the antibody. Thus, trehalose and NaCl are expected to enhance the conformational stability of mAb molecules. L-arginine.HCl on the other hand is not excluded from the surface of the antibody molecules at low concentrations (< 0.2 M) typically used in parenteral formulation. Therefore, it is not expected to have any effect on the conformational stabilization behavior of mAb molecules.
Excipients modulate the colloidal stability of protein solutions by modifying the electrostatic and hydrophobic self-interactions of the protein molecule. The net protein self-interactions can be determined using the DLS interaction parameter, kD.Citation34 The addition of salts to protein solutions reduces the electrostatic interactions between protein molecules through the charge screening effect.Citation46 At low concentrations, addition of salts reduces the colloidal stability of mAb molecules that have repulsive electrostatic interactions and enhances the colloidal stability of mAb molecules with attractive electrostatic interactions. As attractive protein-protein interactions result in a decrease in the protein-water interfacial area, addition of preferentially excluded excipients to protein solutions is expected to increase the protein-protein interaction reactions and reduce colloidal stability of the protein solution. In this study, addition of the salts NaCl and L-arginine.HCl results in a decrease in the colloidal stability of mAbA and mAbB, whereas there is an increase in the colloidal stability of mAbC solution (). This indicates that the underlying interactions of the mAbA and mAbB molecules at pH 5.5 are electrostatically repulsive in nature and that for mAbC are electrostatically attractive in nature. Although, L-arginine.HCl reduces the colloidal stability of mAbA and mAbB, the destabilization is much lower compared to that due to the addition of NaCl. This might be due to the fact that, at the low concentration of 100mM, L-arginine.HCl is not preferentially excluded from the surface of the mAbA and mAbB molecules (, ). Thus, it does not reduce colloidal stability through the preferential exclusion mechanism. NaCl on the other hand is excluded from the protein surface and destabilizes the protein surface through the preferential exclusion mechanism. Similarly, mAbC is also colloidally stabilized by L-arginine.HCl to a much greater extent compared to NaCl, presumably due to the lack of destabilization through the preferential exclusion mechanism. Trehalose is a non-electrolyte and is therefore not expected to affect electrostatic interactions through the charge shielding mechanism. As it is preferentially excluded from the protein surface, it is also expected to promote protein-protein interactions. This is indeed the case with mAbC where addition of trehalose results in a significant decline in the kD value (). Surprisingly, addition of trehalose resulted in an increase in the colloidal stability of mAbA and mAbB (, ). MD simulation studies might provide further insight into the molecular mechanism behind this observed effect.
Excipients can affect the aggregation kinetics of mAb formulations through their effect on the conformational and colloidal stability pathways of the mAb molecules. As trehalose and NaCl are excluded from the surface of all three mAb molecules, they are expected to enhance the conformational stability of the mAb molecules. L-arginine.HCl, which is neither excluded nor bound to the mAb surface at low concentrations (< 0.2 M), is expected to have no effect on the conformational stability of the mAb molecules. From the data on colloidal stabilization, we find that trehalose enhances the colloidal stability of mAbA and mAbB and decreases the stability of mAbC. L-arginine.HCl and NaCl reduce the colloidal stability of mAbA and mAbB and enhance the colloidal stability of mAbC. From the aggregation kinetics data, it is clear that trehalose is able to minimize the aggregation kinetics of mAbA and mAbB molecules through conformational and colloidal stabilization. Although, trehalose reduces the colloidal stability of mAbC, it reduces the aggregation kinetics in this case as well. The addition of L-arginine.HCl has no effect on the aggregation kinetics of mAbB and mAbC (), presumably due to the lack of conformational stabilization. The addition of L-arginine.HCl enhances the aggregation kinetics of mAbA possibly due to the reduction in mAbA colloidal stability through a charge screening effect (). NaCl similarly increases the aggregation kinetics for mAbA through colloidal destabilization due to charge screening. The addition of NaCl to mAbB does not have a clear effect on the aggregation kinetics of the molecule. Addition of NaCl enhances both the conformational and colloidal stability of the mAbC molecule (), which results in reduced rates of mAbC aggregation upon addition of NaCl. The diverse effects of excipient addition on the aggregation kinetics of the three mAb molecules is indicative of the complexity of the underlying mechanism of protein aggregation. Nonetheless, excipients that enhance both conformational and colloidal stability are found to reduce aggregation rates.
The viscosity of high concentration mAb formulations has been shown to be much higher than that for single domain globular proteins.Citation47 This has been attributed to the ability of the multi-domain antibodies to form long range cross-linked networks.Citation41,48 Thus, reduction in mAb viscosity upon excipient addition is related to the ability of the excipient to break down this network. It has been previously shown that electrostatic interaction between the Fc and Fab regions of the mAb molecules results in a network formation that is the underlying cause for high viscosity observed in high concentration mAb formulations.Citation40 Thus, addition of electrolytes like NaCl and L-arginine.HCl results in a decrease in the viscosity of these mAb formulations. L-arginine.HCl is exceptionally good at reducing the viscosity of high concentration mAb formulations (). This might be attributed to the ability of L-arginine.HCl to crowd out interactions between the Fab and Fc domains and to the lack of preferential exclusion-driven enhancement of protein-protein interaction. Addition of trehalose results in an increase in the viscosity of mAbB solutions. This might be attributed to the preferential exclusion of trehalose from the mAbB surface, which results in the promotion of burial of protein surface and potentially the additional exposure of charged groups. Interestingly, addition of trehalose to mAbC solutions results in a decrease in viscosity (). The kD data indicates a decrease in mAbC colloidal stability upon trehalose addition (). Thus, the decrease in mAbC viscosity upon trehalose addition () suggests that addition of trehalose impedes the ability of mAbC molecules to form a long-range, viscosity enhancing network.
In conclusion, we characterized the preferential interactions of commonly used formulation excipients trehalose, L-arginine.HCl and NaCl with three therapeutically relevant IgG1 mAbs. We find that trehalose, NaCl and L-arginine.HCl are excluded from the surface of all three antibody molecules at all excipient concentrations in the range of 0–0.4 molal. The magnitude of exclusion increases linearly with excipient molality for trehalose and NaCl and is non-linear for L-arginine.HCl. Interestingly, we also find evidence to suggest that the magnitude of trehalose exclusion depends on the nature of the protein surface. Taken together, the data presented here provides an insight into the conformational and colloidal stabilization behavior of these excipient molecules and their effect on the aggregation and viscosity of high concentration mAb formulations.
Materials and methods
Molecular simulations
Primary sequence data for the three antibodies was obtained from MedImmune. The crystal structures for the Fab fragment of mAbA (PDB code: 4ypg) and of mAbC (PDB code: 5anm) were obtained from the Protein Data Bank.Citation49 The primary sequence of mAbB differed from that of mAbA only in the Fv region. A homology model of the Fv region of mAbB was generated using the RosettaAntibody protocol,Citation50 then aligned with the mAbA structure to produce the full mAbB Fab structure. The three full antibody structures were generated according to the procedure outlined by Brandt et al.Citation51 using a computational model of an IgG1 antibody as a templateCitation52 and assuming a G0 glycosylation pattern.
All simulations employed the CHARMM2253 force field parameters for proteins, the TIP3P model for water,Citation54 and the CHARMM36 parameters for carbohydrates. Simulations were performed in NAMDCitation55 in water boxes extending a minimum of 13 Å from the antibody surface and periodic boundary conditions. All simulations were performed in the NpT ensemble at 1 atm and 298 K. Simulations were performed at pH 5.5, as set based on the protonation states of ionizable residues. The N terminals were protonated and the C terminals deprotonated, with parameters taken from the CTER and NTER parameters in CHARMM. Arginine and lysine residues were protonated and aspartic acid and glutamic acid residues were deprotonated. Because the pKa of histidine is close to the simulation pH, the protonation states of histidine residues were set using the PROPKA framework,Citation56 which takes the pH and the local hydrogen bonding opportunities into account. Chloride counter-ions were placed randomly within the simulation box so that the system was “charge neutral”. Explicit water molecules were randomly placed within the simulation box. The systems were initially energy minimized, then equilibrated for about 10 ns, with the final 2 ns used for SAP calculations.Citation10
Materials
MAbA, mAbB and mAbC were provided in proprietary liquid formulations by MedImmune. High purity trehalose (Catalog: T9449), L-arginine.HCl (Catalog: 11039), NaCl (Catalog: S7653) and glacial acetic acid (Catalog: A6283) were purchased from Sigma. Buffers were prepared by dissolving the required reagents in 18.2 MΩ water and adjusting pH using either 5 N sodium hydroxide or 1 N hydrochloric acid. The resulting solutions were then diluted to the required final volume using a volumetric flask, filtered through a 0.22 μm filter and used within one week of preparation. Protein samples were dialyzed overnight against 25 mM sodium acetate, pH 5.5 buffer using Slide-A-Lyzer MINI dialysis devices (Thermo Fisher Scientific) with three changes of dialysis buffer. Protein concentrations were determined using the absorbance at 280 nm wavelength and extinction co-efficients for the three antibodies provided by MedImmune. To achieve the final target concentration, protein samples were either diluted with the dialysis buffer or concentrated using an Amicon spin concentrator (EMD Millipore). Samples were stored at 4 °C to minimize aggregation and other degradation reactions.
Vapor pressure osmometry
Vapor pressure osmometry is a relatively quick and easy technique that can be used to determine the osmolality of aqueous solutions using only 10 μL of sample solution. Hong et al.Citation26 have described the use of vapor pressure osmometry measurements to estimate the co-solute preferential interaction co-efficient at constant co-solute chemical potential, Γμ3 in a 4-component solution containing water, protein, co-solute and a buffer. In this experimental setup, two series of solutions with varying concentrations of excipient are prepared: a binary series containing only the buffer and excipient and a ternary series containing the excipient, buffer and protein. The two series are then assayed using a Wescor Vapro 5600 vapor pressure osmometer (Elitech Group) to determine osmolality of solution with known excipient molality. The resulting data is then used to determine the preferential interaction co-efficient using the difference in the osmolality of the binary and ternary solutions after the osmolality contributions of buffer alone and buffer in the presence of protein have been taken into account.
| = | Excipient preferential interaction co-efficient at constant excipient chemical potential and constant temperature and pressure in mol/mol where, |
Where,
| = | Fitting equation for the osmolality vs m3 value for ternary solution. | |
| = | Intercept of the fitting equation for the osmolality vs m3 value for ternary solution. This value accounts for the osmolality contribution of buffer and protein in the absence of co-solute. | |
| = | Fitting equation for the osmolality vs m3 value for binary solution. | |
| = | Intercept of the fitting equation for the osmolality vs m3 value for binary solution. This value accounts for the osmolality contribution of buffer alone in the absence of co-solute. | |
| = | Excipient molality in mol/kg | |
| = | Protein molality in mol/kg. |
The term is determined by taking the partial derivative of the binary solution osmolality with respect to the excipient molality at constant temperature and pressure. Thus,
In this study, 25 mM sodium acetate at pH 5.5 was used as the buffer. To ensure high accuracy in the determination of excipient concentration, all solutions were prepared gravimetrically using a high-precision (instrumental error ∼0.1 mg) Mettler Toledo weighing balance. Stock solutions of NaCl, L-arginine.HCl and trehalose were prepared at a concentration of ∼1 molal in 25 mM Na-acetate buffer at pH 5.5. The stock solutions were then serially diluted using 25 mM sodium acetate, pH 5.5 buffer to obtain a set of 16 stock solutions in the case of trehalose and NaCl and 24 solutions in the case of L-arginine.HCl. It was found that this large number of dilutions was required to minimize the standard error in the estimation of fitting parameters for the osmolality versus molality curves for both binary as well as ternary solutions. To obtain binary solutions, roughly 40 μL of the excipient stock dilution was mixed with about 40 μL of buffer. To obtain ternary solutions, roughly 40 μL of the stock excipient dilution was mixed with ∼40 μL of concentrated antibody solution (> 100 mg/mL). The weight of each aliquot was determined using the Mettler Toledo balance to get an accurate estimate of excipient molality in each dilution. The sample tubes, thus prepared, were wrapped in Parafilm to minimize evaporation losses during storage at 4 °C. All samples were analyzed using the Wescor VAPRO 5560 osmometer (Elitech group) within five days of preparation.
Sealed sample tubes were brought to room temperature and centrifuged for 10 mins at 14,000 g before analyzing them on the osmometer. Sample analysis on the osmometer was carried out following manufacturer's protocol. Although the VPO instrument is very precise, it has a tendency to drift away from the calibration values over time. To minimize this drift and enhance measurement accuracy, the instrument was recalibrated after every four measurements until the osmolality values for the manufacturer-provided standards were stabilized. Also, to minimize errors from evaporation, osmolality standards were discarded two hours after opening of the vial.
To determine the partial molar volume of the excipients and proteins, solutions were prepared gravimetrically containing varying concentrations of the excipients (8 solutions from 0 to ∼1 M) or protein of interest (6 dilutions from 0 to 25 mg/mL). Next, densities of these solutions were measured using a high-precision Anton Paar 4500 densimeter. The density data thus obtained was then used to determine the partial molar volume using the following equation:
Differential scanning calorimetry
Thermal melting scans for mAbA, mAbB and mAbC were determined using a MicroCal VP-DSC microcalorimeter. Protein samples were dialyzed overnight with three exchanges of the desired dialysis buffer. The dialysate from the last exchange was used as the reference buffer for the microcalorimeter. All samples and reference buffers were degassed prior to manual loading into the sample and reference chambers of the microcalorimeter. Protein samples were analyzed at a concentration of ∼1 mg/mL, in the temperature range of 25–90 °C and at a scanning rate of 1 °C/min.
Accelerated aggregation assay
The Tonset temperature was defined as the lowest temperature at which the normalized heat capacity of the first transition peak in a DSC thermogram reaches 5% of its peak value. To ensure an accelerated aggregation condition that would be representative of aggregation under storage conditions, antibodies were incubated at a temperature lower than the Tonset temperature.Citation12 Within this limit, the temperature was set such that a percent aggregate fraction of about 5–10% was obtained within 10–15 days. Based on these criteria, the incubation temperature was set at 52.5 °C for mAbA and mAbB and at 42.5 °C for mAbC. Prior to incubation mAbA, mAbB and mAbC samples were prepared at a final concentration of ∼50 mg/mL (within 5% error) in the desired buffer. About 30 μL of the protein samples were aliquoted to dome-capped PCR tubes (VWR catalog number: 20170–010). The PCR tubes were incubated in a BioRad thermal cycler at the desired temperature. To minimize sample evaporation during incubation, the lid temperature of the thermal cycler was set at 95 °C, PCR tubes were wrapped with Parafilm tape and the sample tubes were surrounded by tubes filled with water. Water in these surrounding tubes was refilled every day to maintain 100% relative humidity around the tubes.
To analyze the aggregated sample, a TSKgel SuperSW mAb HTP column from Tosoh that separates mAb monomer from small oligomers and high molecular weight aggregates was chosen. The outlet of this HPLC column was connected to a miniDAWN TREOS MALS detector from Wyatt. The MALS detector was used to identify the monomer peak and ensure complete separation of the monomer and aggregate peaks on the column. A mobile phase composed of 100 mM sodium phosphate and 200 mM L-arginine.HCl, pH 6.5 was developed for the analysis of the three antibodies, to minimize the loss of protein samples on the column due to hydrophobic binding. To determine the % monomer, aggregate and fragment fractions in an antibody sample, a PCR tube containing the desired protein and formulation combination was removed from the PCR machine at the end of the incubation period and centrifuged and cooled to room temperature. The resulting sample was mixed by pipetting and diluted 50-fold into 1 mL of mobile phase buffer. The diluted protein sample was then transferred immediately to an HPLC autosampler vial by loading 20 μL of this sample onto the column. Day 0 sample was analyzed immediately after the rest of the samples were incubated in the PCR machine. The resulting UV absorbance (Wavelength = 280 nm) chromatograms were then analyzed using the Chemstation software to determine the area under the curve for the monomer and aggregate peaks. The resulting data was recorded in terms of % monomer and % aggregate for each sample.
Dynamic light scattering and kD analysis
A DynaPro Nanostar (Wyatt Technology) instrument was used to record the diffusion co-efficient. To determine the DLS interaction parameter for various formulations, 4–5 dilutions of mAbA and mAbB were prepared in the concentration range of 0–25 mg/mL. mAbC was found to have a high degree of reversible association at higher concentration. To ensure monodisperse protein solutions, mAbC dilutions were limited to 4–5 concentrations in the range of 0–4 mg/mL. To minimize scattering due to suspended foreign particle, protein samples were centrifuged at 14,000 g for 1 hour before analysis using DLS. Only samples with % polydispersity values lower than 15% were used in the determination of kD values. Based on the apparent diffusivity values (Dm), the kD value was determined using the following equation:
| = | Self diffusion co-efficient at the limit of zero protein concentration. | |
| = | Protein concentration in mg/mL. |
Viscosity measurement using cone and plate rheometry
The dynamic viscosities of mAbA, mAbB and mAbC formulations at 100 mg/mL concentrations were determined using DHR-3 (TA instruments) cone and plate rheometer. A 1 degree cone with 20 mm diameter was used to limit the sample volume to ∼80 μL per measurement. The protein samples were centrifuged for 10 mins at 14,000 g to remove suspended particles. Care was taken to avoid bubble formation between the cone and plate surfaces. To minimize sample evaporation during measurement, the temperature of plate was set at 20 °C and handling time was minimized. To eliminate low and high shear rate errors,Citation57 dynamic viscosity was determined for shear rates set within the 800–2000 s−1 range. Viscosity data was collected using three independent samples to account for instrumental and sample loading errors.
Disclosure of potential conflict of interest
No potential conflicts of interest were disclosed.
Funding agency
This work was supported by MedImmune.
Supplemental_Materials.docx
Download MS Word (190 KB)Acknowledgements
We would like to thank MedImmune for supporting this study and providing the antibody molecules. We would also like to thank Dr. Curt Schneider and Dr. Fabienne Courtois for their helpful discussions on experimental procedures for vapor pressure osmometry and accelerated aggregation kinetics, respectively.
Related Research Data
References
- Ecker DM, Jones SD, Levine HL. The therapeutic monoclonal antibody market. mAbs. 2015;7:9-14. doi:10.4161/19420862.2015.989042. PMID:25529996
- Adams GP, Weiner LM. Monoclonal antibody therapy of cancer. Nat Biotechnol. 2005;23:1147-57. doi:10.1035/nbt1137. PMID:16151408
- Chan AC, Carter PJ. Therapeutic antibodies for autoimmunity and inflammation. Nat Rev Immunol. 2010;10:301-16. doi:10.1038/nri2761. PMID:20414204
- Flego M, Ascione A, Cianfriglia M, Vella S. Clinical development of monoclonal antibody-based drugs in HIV and HCV diseases. BMC Med. 2013;11:4. doi:10.1186/1741-7015-11-4. PMID:23289632
- Stoner KL, Harder H, Fallowfield LJ, Jenkins VA. Intravenous versus subcutaneous drug administration. Which do patients prefer? A systematic review. Patient. 2015;8:145-53. doi:10.1007/s40271-014-0075-y
- Mathaes R, Koulov A, Joerg S, Mahler HC. Subcutaneous injection volume of biopharmaceuticals-pushing the boundaries. J Pharm Sci. 2016;105:2255-9. doi:10.1016/j.xphs.2016.05.029. PMID:27378678
- Dani B, Platz R, Tzannis ST. High concentration formulation feasibility of human immunoglubulin G for subcutaneous administration. J Pharm Sci. 2007;96:1504-17. doi:10.1002/jps.20508. PMID:17387698
- Shire SJ. Formulation and manufacturability of biologics. Curr Opin Biotechnol. 2009;20:708-14. doi:10.1016/j.copbio.2009.10.006. PMID:19880308
- Tomar DS, Kumar S, Singh SK, Goswami S, Li L. Molecular basis of high viscosity in concentrated antibody solutions: Strategies for high concentration drug product development. mAbs. 2016;8:216-28. doi:10.1080/19420862.2015.1128606. PMID:26736022
- Chennamsetty N, Voynov V, Kayser V, Helk B, Trout BL. Design of therapeutic proteins with enhanced stability. Proc Natl Acad Sci U S A. 2009;106:11937-42. doi:10.1073/pnas.0904191106. PMID:19571001
- Agrawal NJ, Helk B, Kumar S, Mody N, Sathish HA, Samra HS, Buck PM, Li L, Trout BL. Computational tool for the early screening of monoclonal antibodies for their viscosities. mAbs. 2016;8:43-8. doi:10.1080/19420862.2015.1099773. PMID:26399600
- Courtois F, Schneider CP, Agrawal NJ, Trout BL. Rational design of biobetters with enhanced stability. J Pharm Sci. 2015;104:2433-40. doi:10.1002/jps.24520. PMID:26096711
- Ohtake S, Kita Y, Arakawa T. Interactions of formulation excipients with proteins in solution and in the dried state. Adv Drug Deliv Rev. 2011;63:1053-73. doi:10.1016/j.addr.2011.06.011. PMID:21756953
- Kamerzell TJ, Esfandiary R, Joshi SB, Middaugh CR, Volkin DB. Protein-excipient interactions: Mechanisms and biophysical characterization applied to protein formulation development. Adv Drug Deliv Rev. 2011;63:1118-59. doi:10.1016/j.addr.2011.07.006. PMID:21855584
- Razinkov VI, Treuheit MJ, Becker GW. Accelerated formulation development of monoclonal antibodies (mAbs) and mAb-based modalities: Review of methods and tools. J Biomol Screen. 2015;20:468-83. doi:10.1177/1087057114565593. PMID:25576149
- He F, Woods CE, Becker GW, Narhi LO, Razinkov VI. High-throughput assessment of thermal and colloidal stability parameters for monoclonal antibody formulations. J Pharm Sci. 2011;100:5126-41. doi:10.1002/jps.22712. PMID:21789772
- Philo JS, Arakawa T. Mechanisms of protein aggregation. Curr Pharm Biotechnol. 2009;10:348-51. doi:10.2174/138920109788488932. PMID:19519409
- Esfandiary R, Parupudi A, Casas-Finet J, Gadre D, Sathish H. Mechanism of reversible self-association of a monoclonal antibody: Role of electrostatic and hydrophobic interactions. J Pharm Sci. 2015;104:577-86. doi:10.1002/jps.24237. PMID:25407315
- Andrews JM, Roberts CJ. A Lumry-Eyring nucleated polymerization model of protein aggregation kinetics: 1. Aggregation with pre-equilibrated unfolding. J Phys Chem B. 2007;111:7897-913. doi:10.1021/jp070212j. PMID:17571872
- Roberts CJ. Therapeutic protein aggregation: Mechanisms, design, and control. Trends Biotechnol. 2014;32:372-80. doi:10.1016/j.tibtech.2014.05.005. PMID:24908382
- Timasheff SN. Control of protein stability and reactions by weakly interacting cosolvents: The simplicity of the complicated. Adv Protein Chem. 1998;51:355-432. doi:10.1016/S0065-3233(08)60656-7. PMID:9615174
- Timasheff SN. Protein-solvent preferential interactions, protein hydration, and the modulation of biochemical reactions by solvent components. Proc Natl Acad Sci U S A. 2002;99:9721-6. doi:10.1073/pnas.122225399. PMID:12097640
- Timasheff SN. Thermodynamic binding and site occupancy in the light of the Schellman exchange concept. Biophys Chem. 2002;101:99-111. doi:10.1016/s0301-4622(02)00188-6. PMID:12487993
- Schellman JA. Selective binding and solvent denaturation. Biopolymers. 1987;26:549-59. doi:10.1002/bip.360260408. PMID:3567326
- Wyman J. Binding potential a neglected linkage concept. J Mol Biol. 1965;11:631-44. doi:10.1016/S0022-2836(65)80017-1. PMID:14267283
- Hong J, Capp MW, Anderson CF, Saecker RM, Felitsky DJ, Anderson MW, Record MT. Preferential interactions of glycine betaine and of urea with DNA: Implications for DNA hydration and for effects of these solutes on DNA stability. Biochemistry. 2004;43:14744-58. doi:10.1021/bi049096q. PMID:15544345
- Schneider CP, Trout BL. Investigation of cosolute-protein preferential interaction coefficients: New insight into the mechanism by which arginine inhibits aggregation. J Phys Chem B. 2009;113:2050-8. doi:10.1021/jp808042w. PMID:19199688
- Arakawa T, Timasheff SN. Preferential interactions of proteins with salts in concentrated-solutions. Biochemistry. 1982;21:6545-52. doi:10.1021/bi00268a034. PMID:7150575
- Xie GF, Timasheff SN. The thermodynamic mechanism of protein stabilization by trehalose. Biophys Chem. 1997;64:25-43. doi:10.1016/s0301-4622(96)02222-3. PMID:9127936
- Courtenay ES, Capp MW, Record MT. Thermodynamics of interactions of urea and guanidinium salts with protein surface: Relationship between solute effects on protein processes and changes in water-accessible surface area. Protein Sci. 2001;10:2485-97 doi:10.1110/ps.ps.20801. PMID:11714916
- Barnett GV, Razinkov VI, Kerwin BA, Blake S, Qi W, Curtis RA, Roberts CJ. Osmolyte effects on monoclonal antibody stability and concentration-dependent protein interactions with water and common osmolytes. J Phys Chem B. 2016;120:3318-30. doi:10.1021/acs.jpcb.6b00621. PMID:27007711
- Hong J, Gierasch LM, Liu ZC. Its preferential interactions with biopolymers account for diverse observed effects of trehalose. Biophys J. 2015;109:144-53. doi:10.1016/j.bpj.2015.05.037. PMID:26153711
- Shukla D, Trout BL. Interaction of arginine with proteins and the mechanism by which it inhibits aggregation. J Phys Chem B. 2010;114:13426-38. doi:10.1021/jp108399g. PMID:20925358
- Saluja A, Fesinmeyer RM, Hogan S, Brems DN, Gokarn YR. Diffusion and sedimentation interaction parameters for measuring the second virial coefficient and their utility as predictors of protein aggregation. Biophys J. 2010;99:2657-65. doi:10.1016/j.bpj.2010.08.020. PMID:20959107
- Connolly BD, Petry C, Yadav S, Demeule B, Ciaccio N, Moore JMR, Shire SJ, Gokarn YR. Weak interactions govern the viscosity of concentrated antibody solutions: High-throughput analysis using the diffusion interaction parameter. Biophys J. 2012;103:69-78. doi:10.1016/j.bpj.2012.04.047. PMID:22828333
- Moussa EM, Panchal JP, Moorthy BS, Blum JS, Joubert MK, Narhi LO, Topp EM. Immunogenicity of therapeutic protein aggregates. J Pharm Sci. 2016;105:417-30. doi:10.1016/j.xphs.2015.11.002. PMID:26869409
- Baynes BM, Trout BL. Rational design of solution additives for the prevention of protein aggregation. Biophys J. 2004;87:1631-9. doi:10.1529/biophysj.104.042473. PMID:15345542
- Yadav S, Shire SJ, Kalonia DS. Factors affecting the viscosity in high concentration solutions of different monoclonal antibodies. J Pharm Sci. 2010;99:4812-29. doi:10.1002/jps.22190. PMID:20821382
- Chari R, Jerath K, Badkar AV, Kalonia DS. Long- and short-range electrostatic interactions affect the rheology of highly concentrated antibody solutions. Pharm Res. 2009;26:2607-18. doi:10.1007/s11095-009-9975-2. PMID:19795191
- Buck PM, Chaudhri A, Kumar S, Singh SK. Highly viscous antibody solutions are a consequence of network formation caused by domain-domain electrostatic complementarities: Insights from coarse-grained simulations. Mol Pharm. 2015;12:127-39. doi:10.1021/mp500485w. PMID:25383990
- Kanai S, Liu J, Patapoff TW, Shire SJ. Reversible self-association of a concentrated monoclonal antibody solution mediated by Fab-Fab interaction that impacts solution viscosity. J Pharm Sci. 2008;97:4219-27. doi:10.1002/jps.21322. PMID:18240303
- Du W, Klibanov AM. Hydrophobic salts markedly diminish viscosity of concentrated protein solutions. Biotechnol Bioeng. 2011;108:632-6. doi:10.1002/bit.22983. PMID:21246510
- Shah D, Li JG, Shaikh AR, Rajagopalan R. Arginine-aromatic interactions and their effects on arginine-induced solubilization of aromatic solutes and suppression of protein aggregation. Biotechnol Prog. 2012;28:223-31. doi:10.1002/btpr.710. PMID:21948347
- Arakawa T, Timasheff SN. Abnormal solubility behavior of beta-lactoglobulin - salting-in by glycine and NaCl. Biochemistry. 1987;26:5147-53. doi:10.1021/bi00390a038. PMID:3663650
- Gokarn YR, Fesinmeyer RM, Saluja A, Razinkov V, Chase SF, Laue TM, Brems DN. Effective charge measurements reveal selective and preferential accumulation of anions, but not cations, at the protein surface in dilute salt solutions. Protein Sci. 2011;20:580-7. doi:10.1002/pro.591. PMID:21432935
- Roberts D, Keeling R, Tracka M, van der Walle CF, Uddin S, Warwicker J, Curtis R. Specific ion and buffer effects on protein-protein interactions of a monoclonal antibody. Mol Pharm. 2015;12:179-93. doi:10.1021/mp500533c. PMID:25389571
- Schmit JD, He F, Mishra S, Ketchem RR, Woods CE, Kerwin BA. Entanglement Model of Antibody Viscosity. Journal of Physical Chemistry B 2014;118:5044-9. doi:10.1021/jp500434b
- Li L, Kumar S, Buck PM, Burns C, Lavoie J, Singh SK, Warne NW, Nichols P, Luksha N, Boardman D. Concentration dependent viscosity of monoclonal antibody solutions: Explaining experimental behavior in terms of molecular properties. Pharm Res. 2014;31:3161-78. doi:10.1007/s11095-014-1409-0
- Berman HM, Battistuz T, Bhat TN, Bluhm WF, Bourne PE, Burkhardt K, Iype L, Jain S, Fagan P, Marvin J, et al. The protein data bank. Acta Crystallogr Sect D-Biol Crystallogr. 2002;58:899-907. doi:10.1107/s0907444902003451
- Sircar A, Kim ET, Gray JJ. Rosetta antibody: Antibody variable region homology modeling server. Nucleic Acids Res. 2009;37:W474-W9. doi:10.1093/nar/gkp387. PMID:19458157
- Brandt JP, Patapoff TW, Aragon SR. Construction, MD simulation, and hydrodynamic validation of an all-atom model of a monoclonal IgG antibody. Biophys J. 2010;99:905-13. doi:10.1016/j.bpj.2010.05.003. PMID:20682269
- Padlan EA. Anatomy of the antibody molecule. Mol Immunol. 1994;31:169-217. doi:10.1016/0161-5890(94)90001-9. PMID:8114766
- MacKerell AD, Bashford D, Bellott M, Dunbrack RL, Evanseck JD, Field MJ, Fischer S, Gao J, Guo H, Ha S, et al. All-atom empirical potential for molecular modeling and dynamics studies of proteins. J Phys Chem B. 1998;102:3586-616. doi:10.1021/jp973084f. PMID:24889800
- Jorgensen WL, Chandrasekhar J, Madura JD, Impey RW, Klein ML. Comparison of simple potential functions for simulating liquid water. J Chem Phys. 1983;79:926-35. doi:10.1063/1.445869
- Phillips JC, Braun R, Wang W, Gumbart J, Tajkhorshid E, Villa E, Chipot C, Skeel RD, Kale L, Schulten K. Scalable molecular dynamics with NAMD. J Comput Chem. 2005;26:1781-802. doi:10.1002/jcc.20289 PMID:16222654
- Dolinsky TJ, Czodrowski P, Li H, Nielsen JE, Jensen JH, Klebe G, Baker NA. PDB2PQR: Expanding and upgrading automated preparation of biomolecular structures for molecular simulations. Nucleic Acids Res. 2007;35:W522-W5. doi:10.1093/nar/gkm276. PMID:17488841
- Ewoldt RH, Johnston MT, Caretta LM. Experimental challenges of shear rheology: How to avoid bad data. In Spagnolie SE, ed. Complex fluids in biological systems: Experiment, theory, and computation. New York: Springer; 2015. 207-41