
 ?Mathematical formulae have been encoded as MathML and are displayed in this HTML version using MathJax in order to improve their display. Uncheck the box to turn MathJax off. This feature requires Javascript. Click on a formula to zoom.
ABSTRACT
The neonatal Fc receptor (FcRn) has been demonstrated to contribute to a high bioavailability of monoclonal antibodies (mAbs). In this study, we explored the cellular sites of FcRn-mediated protection after subcutaneous (SC) and intravenous (IV) administration. SC absorption and IV disposition kinetics of a mAb were studied in hFcRn transgenic (Tg) bone marrow chimeric mice in which hFcRn was restricted to radioresistant cells or hematopoietic cells. SC bioavailabilities close to 90% were observed in hFcRn Tg mice and chimeric mice with hFcRn expression in hematopoietic cells, whereas SC bioavailabilities were markedly lower when FcRn was missing in hematopoietic cells. Our study demonstrates: 1) FcRn in radiosensitive hematopoietic cells is required for high SC bioavailability, indicating first-pass catabolism after SC administration by hematopoietic cells; 2) FcRn-mediated transcytosis or recycling by radioresistent cells is not required for high SC bioavailability; and 3) after IV administration hematopoietic and radioresistent cells contribute about equally to clearance of the mAb. A pharmacokinetic model was devised to describe a mixed elimination via radioresistent and hematopoietic cells from vascular and extravascular compartments, respectively. Overall, the study indicates a relevant role of hematopoietic cells for first-pass clearance of mAbs after SC administration and confirms their role in the overall clearance of mAbs.
Introduction
Numerous monoclonal antibodies (mAbs) are currently marketed as therapeutic agents for a multitude of diseases and disorders, and many additional mAbs are in various stages of clinical development.Citation 1 Subcutaneous (SC) administration, which is more convenient compared to intravenous (IV) administration,Citation 2 has been approved for the delivery of numerous mAbs, including adalimumab, canakinumab, efalizumab, golimumab, omalizumab, ustekinumab, tocilizumab, trastuzumab and rituximab.Citation 3 , Citation 4 A drawback of SC administration is incomplete bioavailability. Compared to IV delivery, bioavailability for the mAbs mentioned above in humans typically ranges from 50 to 80%, and losses after SC administration range from 20–50%.Citation 4 , Citation 5
The pH-dependent IgG-Fc receptor, FcRn, is centrally involved in the disposition of IgG regardless of the mode of administration. Its classical role in controlling IgG homeostasis within the circulatory system (the central compartment) is well described (see Ref. Citation6,Citation7 for reviews). Vascular endothelial cells actively engage in fluid phase endocytosis that directs serum proteins to lysosomal degradation. Following pinocytic uptake by such cells, IgG binds via their Fc to FcRn in this slightly acidic endosomal environment (pH 5.8-6.0). FcRn redirects IgG from lysomal degradation by recycling it to the cell surface, where at neutral physiological pH IgG is released. This process results in an extended serum half-life for IgG of 10–20 days, whereas serum proteins that are not rescued by IgG are rapidly eliminated (half-life of 1–2 days). Accordingly, IgG mAbs are more rapidly cleared from the circulation in FcRn knock-out (ko) as compared to wild-type (wt) mice,Citation 8 , Citation 9 and mAb unable to bind FcRn exhibit similar rapid clearance in wt mice (88.1 vs. 24.2 mL/day/kg for FcRn non-binding and wt antibody in wt mice).Citation 10 Importantly, serum albumin is a second ligand of FcRn.Citation 11 FcRn binds and traffics this most abundant serum protein by mechanisms that in many ways parallel those controlling IgG.Citation 12 , Citation 13
It is increasingly clear, however, that FcRn-mediated recycling is not limited to the vascular endothelia. FcRn is also expressed by a variety of epithelial, stromal and parenchymal cells. Citation14-Citation18 FcRn is also expressed by hematopoietic cells derived from the myeloid lineage. Citation14-Citation21 Moreover, bone marrow (BM) chimera studies and conditional FcRn expression studies in mice indicate that such myeloid cells are functionally relevant in that they confer significant levels of FcRn-mediated protection to IgG.Citation 14 , Citation 17 , Citation 18
FcRn also has been shown in mouse models to enhance mAb bioavailability after SC administration.Citation 10 , Citation 22 The SC bioavailability of the mAb 7E3 was found to be markedly lower in FcRn ko compared to wt mice (28.3 ± 6.9% vs. 82.5 ± 15.6%, P < 0.0001).Citation 22 Similarly, a mAb defective in mouse FcRn-binding showed a markedly lower SC bioavailability in wt mice compared to a chimeric mAb with mouse IgG2a constant regions that binds mouse FcRn (41.8% vs. 76.3%).Citation 10 Pre-systemic catabolism may occur in the local SC tissue or in the draining lymphatics through which mAb absorption after SC administration is generally assumed to occur.Citation 5 However, the cell types in which FcRn protects against presystemic catabolism are still poorly understood. FcRn-expressing vascular endothelial cells at the administration site may either salvage or transcytose administered mAbs, as has been demonstrated in cultured human endothelial cells.Citation 23 Additionally, FcRn-expressing myeloid cells, such as resident macrophages and dendritic cells in the local SC tissue or draining lymphatics, may confer FcRn-mediated protection.
Here, we sought to evaluate the relative contributions of hematopoetic and radioresistant cells (inclusive of endothelial, parenchymal and stromal) in the physiological context of human (h) FcRn to the pharmacokinetic (PK) behavior of a humanized IgG1 mAb administered IV and SC. To do so, we take advantage of BM chimeric, hFcRn transgenic (Tg) mice to restrict the expression of hFcRn to the hematopoietic cells (HC) or radioresistant cells (RRC) compartments and compare the PK behaviors of a humanized IgG1 mAb administered SC and IV. We demonstrate that HC are significant sites of FcRn-mediated mAb protection following SC and IV administration, and they are involved in the first-pass catabolism of following SC administration. In addition, we estimate the contributions of RRC and HC to the clearances of a humanized mAb. Finally, we apply a semi-mechanistic PK model to compare the fractional mAb clearances in RRC and HC.
Results
Validation of bone marrow reconstituted mice
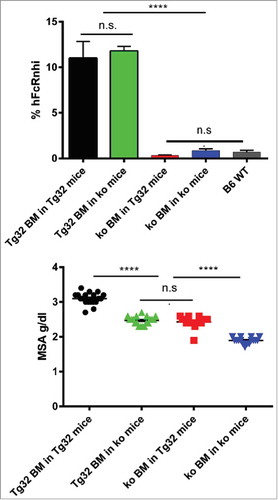
hFcRn Tg32 mice have been shown to approximate the tissue expression patterns of FcRn in normal humans.Citation 15 , Citation24-Citation26 The PK of mAbs in Tg32 mice have been demonstrated to be predictive for the PK behavior of mAbs in humans.Citation 27 , Citation 28 We used this model for BM reconstitution of recipients whose HC had been irreversibly damaged by lethal irradiation to create mice selectively expressing this hFcRn transgene in the HC or RRC using the scheme shown in . Twelve weeks after BM transfer, fluorescence-activated cell sorting (FACS) analysis was performed on blood CD11b+ monocytes using the human FcRn-specific mAb, ADM32, to establish the extent of BM reconstitution. Confirming efficient BM reconstitution, the patterns of hFcRn expression were consistent with the donor BM sources (). As FcRn is known to control the concentrations of serum albumin,Citation 11 we also addressed whether restriction of hFcRn to the HC or RRC compartments affected endogenous mouse serum albumin (MSA) concentrations. As shown in , this result provided a functional confirmation that BM reconstitution was effective, and showed that hFcRn expressed in the HC and RRC compartments contributed similarly and additively to maintain homeostatic serum albumin levels.
Table 1. Scheme for bone marrow (BM) reconstitution to generate mouse cohorts with differing expression of hFcRnFootnote*.
Figure 1. Confirmation of BM reconstitution. A: FACS analysis of hFcRn expression by blood CD11b+ monocytes. % hFcRnhi cells detected by anti-hFcRn mAb ADM32 is shown. B: Endogenous serum albumin levels of mice cohorts 1–4 determined 12 wks after reconstitution. Errors bars indicate SEM of 16–18 mice per group. n.s., not significant; ****, p≤ 0.0001 by Tukey's multicomparison ANOVA.
Plasma concentrations and non-compartmental PK analysis
We then used the reconstituted mice to investigate the extent to which the HC and RRC controlled the PK of a humanized IgG1 (mAb1) after IV and SC administrations. Plasma concentration-time curves of mAb1 after IV and SC administration of mAb1 are shown in and the corresponding PK parameters from non-compartmental analysis (NCA) are presented in and . After IV administration, disposition of mAb1 was most rapid in cohort 4 animals (no FcRn) and slowest in cohort 1 (hFcRn in HC + RRC), while cohort 2 (RRC only) and 3 (HC only) were in between. Clearance in cohort 4 (no FcRn) was about 12-fold more rapid as compared to cohort 1, with clearances of cohorts 2 and 3 in between. The initial volumes of distribution (Vc) tended to be higher in mice based on FcRn ko mice (cohorts 3 and 4, with cohort 3 expressing hFcRn in HC). The volume of distribution at steady state (Vss) was similar in all cohorts, with values around 100 mL/kg. The different clearances across cohorts were associated with markedly different average terminal half-lives, ranging from 0.62 to 6.8 days in cohorts 4 (no hFcRn) and 1 (hFcRn in HC + RRC).
Figure 2. Plasma concentration time curves (mean ± SD) after IV or SC administration of mAb1 at 10 mg/kg to the mouse cohorts 1 to 4; A: after IV administration; B: after SC administration; C: after SC administration in the initial absorption phase (first 7 h).
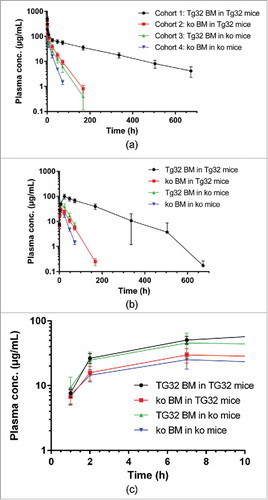
Table 2. Pharmacokinetic parameters of mAb1 following IV administration of 10 mg/kg mAb1 to mice (from non-compartmental pharmacokinetic analysis; n = 6–8; mean ± SD).
Figure 3. Semi-mechanistic PK model after IV administration of mAb1 in mice.
Following SC administration, mAb1 was detectable in plasma at the first sampling time (1 h) at similar levels (∼7–9 µg/mL) in all cohorts, while at the 2 and 7 h time points plasma levels tended to be lower in mice lacking FcRn in HC (cohorts 2 and 4) (). Maximum average plasma levels in cohorts 1–4 of 100, 29.8, 45.6, and 25.2 µg/mL, respectively, were reached after 24 h in cohort 1 or mostly at 7 h in cohorts 2, 3 and 4. Plasma levels then declined with half-lives similar to those observed after IV administration. SC bioavailability was estimated at 87.6, 39.5, 89.2, and 54.8% in cohorts 1, 2, 3, and 4, respectively. Thus, highest bioavailabilities were observed in cohorts with hFcRn in HC (cohorts 1 and 3).
Semi-mechanistic pharmacokinetic modeling of mAb1
The conventional approach for PK analysis by NCA or compartmental PK analysis is based on clearance from the central vascular compartment. The volume of the central compartment for mAbs is usually equal to plasma volume, i.e., the fluid-fraction of vascular space.Citation 29 PK analysis of mAb1 administered IV by NCA indicated similar and additive contributions of HC and RRC to FcRn protection and clearance (for additional details, see Discussion). To further analyze the PK of mAb1 administered IV, we implemented a compartmentalized semi-mechanistic model (). In this model, the clearance via RRC and via HC are organized into central and peripheral compartments, respectively. The best fit (based on Akaike information criteria (AIC)) was obtained when the volume of distribution of the central compartment was allowed to vary according to the type of chimeric mice. Parameter estimates are presented in .
As found in non-compartmental PK analysis, the central volume was larger in cohorts lacking FcRn in HC (cohort 3 and 4). Elimination was a slow process, at least 3-fold slower compared to tissue distribution or endocytosis/recycling processes. The apparent endocytosis and recycling rates were in the same order of magnitude for both RRC and HC. An overlay of observed PK profiles with model simulations is presented at . Overall, all observed profiles are within 5 to 95 percentile of the model projection. In line with this, model-derived areas under the plasma concentration-time curve (AUC) are in good agreement with NCA-derived parameter values ().
Figure 4. Observed (mean ± SD) versus predicted (5, 50 and 95 percentile prediction) plasma concentration after IV administration of mAb1 at 10 mg/kg to the different mouse cohorts.
Discussion
The goal of our study was to obtain mechanistic insights into the role of hFcRn in the disposition of a humanized mAb after SC and IV administrations, including its role in first-pass catabolism after SC dosing. We addressed this issue in the physiologically relevant context of human hFcRn rather than mouse FcRn by use of hFcRn Tg32 mice in which hFcRn expression is controlled by its endogenous human regulatory elements. This mouse model has been shown to express hFcRn in a cellular pattern similar to that of humansCitation 15 , Citation24-Citation26 and to reliably model the PK of therapeutic mAbs in humans.Citation 27 , Citation 28 , Citation 30
We utilized BM chimeric Tg32 mice to discriminate the relative contributions of hFcRn in the RRC and HC. RRC expressing FcRn, and potentially relevant to mAb clearance, include vascular endothelial cells, liver sinusoidal cells, hepatocytes, kidney podocytes, and proximal epithelial cells.Citation 14 , Citation 15 , Citation 18 , Citation 31 HC expressing FcRn include a variety of myeloid derivatives such as macrophages, dendritic cells, Kupffer cells, monocytes, and neutrophils, all of which express FcRn.Citation 14 , Citation 15 , Citation 18 , Citation 19 , Citation 20
Absorption and disposition after SC administration
To assess the roles of RRC and HC in first-pass catabolism after SC administration, we determined the relative contributions of FcRn in HC and RRC to SC absorption of mAb1 by comparing the bioavailabilities of mAb1 across BM chimeric cohorts. High SC bioavailabilities approaching 90% were found in mice with hFcRn expressed in their HC (cohorts 1 and 3). By contrast, SC bioavailabilities in cohorts lacking FcRn in HC were markedly reduced, with values of 39.5 and 54.8% in cohorts 2 and 4, respectively. These differences are reflected in plasma concentration-time curves during the initial absorption phase, with plasma levels in cohorts 1 and 3 being higher than in cohorts 2 and 4 (, ). Thus, FcRn in HC of the SC tissue and/or in the draining lymphatics is required for a high SC bioavailability.
Table 3. Pharmacokinetic parameters of mAb1 following SC administration of 10 mg/kg mAb1 to mice (from non-compartmental pharmacokinetic analysis; n = 8; mean ± SD).
Table 4. Parameter estimates in final PK model following IV administration of mAb1 to mice (from compartmental analysis).
Table 5. Observed vs. model predicted AUC (mean ± SD).
The limited contribution of hFcRn in RRC to SC bioavailability argues against the involvement of FcRn-mediated salvage or transcytosis through blood vessel endothelial cells. Paracellular absorption into blood is unlikely because subcutaneous blood capillaries typically have a continuous endothelial structure with tight interendothelial junctions and an uninterrupted base membrane that hampers the transport of large proteins.Citation 32 The high bioavailability in mice lacking hFcRn in RRC is also inconsistent with conclusions from modeling of SC absorption of rituximab in standard mice, where a contribution from receptor-mediated transport, i.e., transcytosis presumably via FcRn, was postulated.Citation 33 , Citation 34 Moreover, reported data in mice suggest only a very low lymphatic absorption of the SC administered bevacizumab.Citation 35 Reconciliation of these studies with our findings in support of FcRn-dependent first-pass catabolism by HC might be explained by differences in experimental paradigms, including antibodies tested, human vs mouse FcRn, or sites of administration.
The high FcRn-dependent SC bioavailability conferred by HC is the summation of HC localized to the SC injection site and/or its lymphatic drainage. HC are present both in SC tissue and the lymphatic system. Macrophages are a major cellular component of the SC tissueCitation 5 and account for a quarter of the cells in the SC connective tissue of rats.Citation 36 Dermal and epidermal resident dendritic cells may also migrate to the SC site upon administration.Citation 37 In addition, loosely fenestrated collecting lymph vessels may permit mAbs to interact with HC in surrounding fatty tissues.Citation 38 Finally, lymphatic flow is interrupted by lymph nodes that are abundant in HC prior to entering the bloodstream. The extent to which FcRn at each HC site contributes to overall bioavailability remains to be determined.
Our data indicate that the SC first-pass catabolism occurs in HC. HC are not only involved in the local catabolism after SC dosing, but also in the systemic mAb catabolism/clearance after IV administration (see also below), This may explain the observed inverse correlation of SC bioavailability and systemic clearance across several mAbs in the absence of relevant target-mediated disposition in both minipigs and humans, with mAbs having lower systemic clearance exhibiting also lower first-pass catabolism, i.e., a higher SC bioavailability.Citation 39 , Citation 40
There is circumstantial evidence that our observations on the role of HC in SC first-pass catabolism can be translated to humans. The overall and cellular patterns of hFcRn expression in hFcRn Tg32 mice, including skin, blood vessels and lymphatics, parallels those described in humans.Citation 15 Macrophages are abundant in subcutaneous adipose tissue, accounting for 5–10% of total cells in both lean mice and humans.Citation 41 The endogenous levels of IgG in hFcRn Tg32 mice do differ from humans (ca. 0.02 mg/mL vs. ca. 10 mg/mL).Citation 42 That difference does not appear to impinge on the overall clearances of therapeutic mAbs in hFcRn Tg32 mice that correlate well with that found for humans.Citation 27 , Citation 28 , Citation 30 , Citation 43 Moreover, given these similarities, the clearances at both HC and RRC sites should be affected in a similar manner in both species.
mAb Disposition after IV administration
Another goal was to obtain insights into the disposition of mAb1 after IV administration. The disposition kinetics of mAb1 reflects the differences in hFcRn expression across mouse cohorts. In cohort 1 with hFcRn expressed both by HC and RRC, the average clearance was 12.9 mL/day/kg, which is in the range reported for other mAbs in hFcRn Tg32 mice.Citation 42 The clearance in FcRn ko mice lacking hFcRn on both HC and RRC (cohort 4) was about 12-fold higher compared to cohort 1 expressing hFcRn ubiquitously, inferring that mAb1 undergoes 11 FcRn-mediated recyclings before being cleared.
Comparison of clearance values across cohorts reveals the degree to which hFcRn in HC and RRC affect the clearance of mAb1. The clearance differences between cohort 2 (hFcRn in RRC only) and cohort 3 (hFcRn in HC only) versus cohort 1 reflect the additional clearance from the lack of hFcRn in HC and RRC (54.5 and 85.9 mL/day/kg, respectively). The additional clearances from the lack of hFcRn in HC and RRC, as well as the residual clearance when hFcRn is ubiquitous (cohort 1), add up to a clearance value of 153 mL/day/kg, which is very similar to the clearance in FcRn ko mice (cohort 4) of 159 mL/day/kg (see also ). The similar values indicate that hFcRn protection in HC and RRC are additive. Comparison of the additional clearances from lack of hFcRn in HC and RRC suggests that HC and RRC contribute around 39 and 61%, respectively, to the overall hFcRn protection of mAb1. If we assume the same FcRn recycling efficiency in both cell types and FcRn salvage in all cells involved in IgG clearance, the above contributions to FcRn protection also reflect the combined contributions of HC and RRC to overall IgG clearance.
To compare the findings found here in the hFcRn Tg32 model with BM reconstitution studies in which a mouse IgG1 anti-trinitrophenol (TNP) mAb was administered to mouse FcRn intact wt and FcRn ko BM chimeric mice, we re-analyzed data reported by Akilesh et al.Citation 14 (). Following intraperitoneal administration, the apparent clearance values (CL/F) were 14.6, 66.5, 60.1, and 100 mL/day/kg in mice with mFcRn expression in both HC and RRC, RRC only, HC only, and in neither, (cohorts 1, 2, 3 and 4, respectively) (). The clearance differences between cohort 1 (mFcRn in both RRC and HC) and cohort 2 (mFcRn in RRC) or cohort 3 (mFcRn in HC), reflect the additional clearance when mFcRn is missing in HC or RRC (51.9 and 45.5 mL/day/kg, respectively). The additional clearances from lack of mFcRn in HC and RRC, as well as the residual clearance when FcRn is ubiquitously expressed (cohort 1), add up to a clearance value of 112 mL/day/kg, which is very similar to the clearance in FcRn ko mice (cohort 4) of 100 mL/day/kg (). Thus, the partial clearances are roughly additive to match the clearance value in mFcRn ko mice. Comparison of the additional clearances when mFcRn is absent in HC and RRC shows that HC and RRC contribute 53 and 47% respectively, to the overall mFcRn-mediated protection of mouse IgG1 mAb. While it is unclear whether the trend towards a higher contribution from RRC in hFcRn Tg mice reflects a true animal model difference or rather the experimental differences in dosing route or test compounds, the results for both hFcRn Tg mice and wt mice suggest that HC and RRC contribute about equally to FcRn-mediated protection.
Figure 5. Serum concentration time curves (mean ± SD) of monoclonal anti-TNP-specific IgG after intraperitoneal administration at 5 mg/kg to B6.PL-Thy1a/CyJ (Thy1.1) mice, FcRn ko mice and chimera thereof (Data fromCitation 14 ).
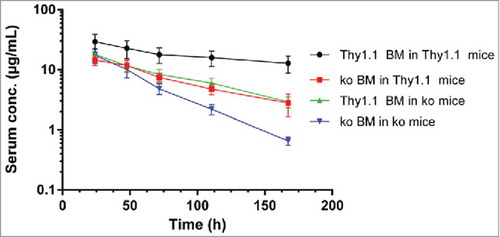
Table 6. Pharmacokinetic parameters of anti-TNP-specific IgG (mAb 1B7.11) following intraperitoneal administration at a dose of 4 mg/kg to B6.PL-Thy1a/CyJ (Thy1.1), and C57BL/6J FcRn knock-out (ko) mice as well as chimera thereof (from non-compartmental pharmacokinetic analysis of average concentration-time profiles of 10 to 12 mice/dose group) (Data fromCitation 14 ).
Table 7. Additivity of FcRn protection in hematopoietic and radioresistant cells after IV administration: For all test compounds clearance in FcRn ko mice resembles the sum of clearance with full FcRn expression and the additional clearances from the lack of FcRn in hematopoietic and radioresistent endothelial/somatic cells.
By estimating the quantitative contributions of both HC and RRC to humanized mAb clearance in the hFcRn Tg model, our study expands earlier results comparing FcRn wt and ko chimeric mice.Citation 14 , Citation 17 , Citation 18 HC are present in circulation (e.g., monocytes), in lymphatic and extravascular spaces (e.g., macrophages), but their relative contributions to IgG clearance are unknown. A role for macrophages is supported by studies in which clodronate treatment reduces clearance of a bispecific antibody in cynomolgus monkeys by 30%.Citation 44 Standard PK evaluations by compartmental and non-compartmental methods assume elimination from the central compartment and do not consider extravascular elimination. The repercussions of this limitation on volume of distribution estimates have already been discussed elsewhere.Citation 45 , Citation 46 The data from our study support the importance of “normal” catabolic elimination of mAbs exterior to the central vascular compartment.
In a further step, analysis of the experimental data was refined using a semi-mechanistic PK model, linking the PK to interactions of mAb1 with FcRn on HC and RRC. This model connects the above results to a rapidly growing body of mathematical models capturing the IgG-FcRn interaction and the IgG disposition more generally. Citation47-Citation52 These models have become increasingly important in drug discovery and development, and have been recently implemented in professional software platforms.Citation 53 , Citation 54 While the division into vascular and extravascular compartments may appear similar to previous work, our model newly introduces separate clearance by HC and RRC. Systematic hypothesis testing has demonstrated that a model in which HC-mediated clearance is located in the extravascular compartment and RRC-mediated clearance in the vascular compartment performs best. It captures the PK of mAb1 administered IV for all four mouse cohorts (), and thus provides an appropriate framework for the additive, parallel elimination via HC and RRC. It is interesting to note that this model predicts that the net rates of cellular uptake, catabolism and recycling are similar in RRC and HC, with endosomal FcRn in both sites recycling about four times more IgG than that lost by catabolism. Or, stated otherwise, the model implies that a humanized mAb in hFcRn-intact mice is on average recycled four times before being catabolized.
Overall, the results show that FcRn in HC and RRC contribute to a similar extent in the protection of therapeutic mAbs, with both cellular compartments being similarly involved in the disposition of these ligands. Through the study of a model humanized mAb, our work provides the first experimental support for the key involvement of HC in SC tissue and/or draining lymphatics in mAb catabolism prior to mAb entry into the central vascular compartment, and suggests that HC are primary sites of mAb first-pass catabolism following SC administration. Whether the PK behaviors uncovered by this analysis are prototypic of other therapeutics mAbs remains to be confirmed.
Materials and methods
Materials
mAb1 was produced at Roche Diagnostics GmbH (Penzberg, Germany). It was produced in Chinese hamster ovary cells and purified by standard methods. The test substance was formulated as an aqueous buffer solution at a concentration of 25.6 mg/ml. Purity was > 99.2% as determined by size exclusion chromatography and SDS-PAGE. This formulation was used as such for IV bolus and SC administration to mice. MAb1 is a humanized IgG1 antibody that recognizes the human insulin-like growth factor 1 receptor (IGF-1R), but does not cross-react with the murine IGF-1R (F. Hoffmann-La Roche, data on file).
Animals
The study was conducted using female mice lacking the mFcRn α-chain (B6.129 × 1-Fcgrttm1Dcr /DcrJ; abbreviated mFcRn ko) and female B6.Cg-Fcgrttm1Dcr Tg(FCGRT)32Dcr/DcrJ mice (abbreviated hFcRn Tg32). Tg32 mice carry a ko allele of the FcRn α-chain and are homozygous for a human FcRn α-chain genomic transgene under control of its human promoter, as described.Citation 55 , Citation 56 All mice were bred at the Jackson Laboratory (Bar Harbor, USA) and are available from The Jackson Laboratory (strain numbers 003982 and 014565). Experiments were performed under Protocol 01022 approved by the Institutional Animal Care and Use Committee of The Jackson Laboratory.
Methods
Bone marrow transplantation
Groups of mFcRn ko and hFcRn Tg32 homozygous mice were given two equal doses of irradiation for a total lethal dose of 12 Gy (1200R) to eliminate HC. Within 3 h, the irradiated mice were then given IV injections of 5× 10⁶ bone marrow (BM) cells from either FcRn-/- and hFcRn Tg32 mice according to the scheme shown in . Twelve weeks after BM transfer, expression of hFcRn was determined by FACS analysis on blood CD11b+ leukocytes of recipient mice using the human FcRn-specific mAb ADM32 to monitor the extent of chimerism.Citation 56 MSA quantification was performed on plasma from retroorbital blood by a CAS clinical chemistry AU680 analyzer.
Pharmacokinetic study with mAB1
mAb1 was administered by IV or SC bolus injections at 10 mg/kg (each) in dose volumes of 10 ml/kg to mouse cohorts 1–4 16 weeks after BM transfer (8 mice of ca. 20 g body weight per dose group). IV administration was by tail vein injection and SC administration was into the interscapular area. Mice were bled at 1, 2, 7, 24, 48, 72, 168, 336, 504, and 672 hours. IV administered mice were bled additionally at 5 minutes. Blood (25 µl) was collected from the retro-orbital sinus, put into microcentrifuge tubes containing 1 µl of heparin in 0.9% NaCl (10000 U/ml), centrifuged at 10,000 rpm in a microcentrifuge 5417R (Eppendorf) for 2 minutes at 4°C. Plasma (10 µl) was transferred to wells of a 96-well storage plate with plug seal lid containing 50% glycerol in phosphate-buffered saline with 0.05% NaN3 to obtain a 10-fold dilution prior to freezing to minimize volume loss due to repeated sample addition over the period of the study. Samples were stored at −80°C.
Plasma levels of mAb1 were analyzed by ELISA using established procedures.Citation 57 For mAb1 analysis, ELISA plates were coated with mouse anti-human IgG Fc (Southern Biotech, clone JDC-10). mAb1 was detected with mouse anti-human kappa-alkaline phosphatase (Southern Biotech, clone SB81a). Lots of bovine serum albumin (Sigma-Aldrich) used for blocking buffer were prescreened to mimimize cross reactivity to mAb1.
Data analysis
Non-compartmental PK analysis
The plasma mAb concentration-time data following IV or SC administration of mAb1 were analyzed by standard NCA using ToxKin® (version 3.5, Entimo, Berlin, Germany). PK data were calculated for each mouse using individual plasma concentration-time data. After SC administration in cohort 1, some mice plasma concentration-time data later than 336 or 504 h were markedly lower than projected from the log-linear decline of plasma levels, thus reflecting an accelerated clearance probably due to formation of anti-drug antibodies (not measured). These time points were excluded from PK evaluation. SC bioavailabilities of individual mice were calculated using average AUC (0-inf) values for each cohort after IV administration.
Statistical evaluation of PK parameters
One-way ANOVA of PK parameter logarithms followed by Tukey's multiple comparison test was performed using significance at a p value <0.05. For reasons of brevity, only statistical information is presented for clearances and half-lives after IV administration and for Cmax and bioavailabilities after SC administration.
Semi mechanistic PK model
A semi-physiologic PK model presented in was used to describe observed plasma PK data. This model assumes linear processes and was originally developed for compounds without relevant target binding. In the following equations, “A” is amount of compound and indices refer to compartment as described in . Transfer rates are all first order process.
The following equations describe compound amount change in each compartment after IV administration when FcRn is present:
The observed plasma concentrations were fitted to a ratio where
is volume in the vascular compartment. Type of mice was considered as a covariate of the vascular volume.
For data analysis, PK parameters were estimated simultaneously in each experimental cohort based on their plasma exposure using a population approach in Monolix® v.433s.Citation
59
Parameters were assumed to be log-normally distributed with fixed effect and random effect parameters representing population typical value and inter-individual variability, respectively. An exponential model described the log-normal distribution of random effect parameters with mean zero and variance . Residual error model was assumed to be proportional with mean zero and variance
. Parameter estimates were considered as acceptable when the coefficient of variation was below 40% for typical values, and any random effect above this cut-off value is fixed to the estimated value. Model performance was assessed via visual inspection of diagnostic plots (Residuals, Observed versus Predicted and Visual Predictive Check plots) on population predictions. The AIC was used to discriminate covariate model on vascular volume.
Simulated profiles were generated in Matlab v.2013bCitation 60 and 5, 50 and 95 percentiles were extracted from 1000 random sample drawn from population analysis and using the Matlab statistical toolbox.
Abbreviations
| AIC | = | Akaike information criteria |
| AUC | = | area under the plasma concentration-time curve |
| BM | = | bone marrow |
| CL/F | = | apparent clearance |
| FACS | = | fluorescence-activated cell sorting |
| FcRn | = | neonatal Fc receptor |
| HC | = | hematopoietic cells |
| IGF-1R | = | insulin-like growth factor 1 receptor |
| IV | = | intravenous |
| mAb | = | monoclonal antibody |
| MSA | = | mouse serum albumin |
| NCA | = | non-compartmental analysis |
| PK | = | pharmacokinetic |
| RRC | = | radioresistent cells |
| SC | = | subcutaneous |
| Tg | = | transgenic |
| TNP | = | trinitrophenol |
| Vc | = | initial volume of distribution |
| Vss | = | volume of distribution at steady state |
| wt | = | wild-type |
Disclosure of interest
WFR, NF and HPG are employees of F. Hoffmann-La Roche Ltd; DCR, GJC and GP are or were employees of the Jackson Laboratory. DCR is an inventor on certain patents related to hFcRn transgenic mice. Other authors report no conflict of interest.
References
- Reichert JM. Antibodies to watch in 2017. MAbs. 2017;9(2):167–81. doi:10.1080/19420862.2016.1269580. PMID:27960628.
- Bittner B, Schmidt J. Subcutaneous administration of monoclonal antibodies in oncology as alternative to established intravenous infusion. Pharm Ind. 2012;74:638–43.
- McDonald TA, Zepeda ML, Tomlinson MJ, Bee WH, Ivens IA. Subcutaneous administration of biotherapeutics: current experience in animal models. Curr Opin Mol Ther. 2010;12(4):461–70. PMID:20677097.
- Richter WF, Jacobsen B. Subcutaneous (SC) absorption of biotherapeutics – knowns and unknowns. Drug Metab Dispos. 2014;42(11):1881–9. doi:10.1124/dmd.114.059238. PMID:25100673.
- Richter WF, Bhansali SG, Morris ME. Mechanistic determinants of biotherapeutics absorption following SC administration. AAPS J. 2012;14:559–70. doi:10.1208/s12248-012-9367-0. PMID:22619041.
- Lobo ED, Hansen RJ, Balthasar JP. Antibody pharmacokinetics and pharmacodynamics. J Pharm Sci. 2004;93(11):2645–68. doi: 10.1002/jps.20178. doi:10.1002/jps.20178. PMID:15389672.
- Roopenian DC, Akilesh S. FcRn: the neonatal Fc receptor comes of age. Nature Rev Immunol. 2007;7:715–25. DOI: 10.1038/nri2155. doi:10.1038/nri2155.
- Junghans RP, Anderson CL. The protection receptor for IgG catabolism is the β2-microglobulin containing neonatal intestinal transport receptor. Proc Natl Acad Sci USA. 1996;93:5512–6. doi:10.1073/pnas.93.11.5512. PMID:8643606.
- Roopenian DC, Christianson GJ, Sproule TJ, Brown AC, Akilesh S, Jung N, Petkova S, Avanessian L, Choi EY, Shaffer DJ, Eden PA, Anderson CL. The MHC class I-like IgG receptor controls perinatal IgG transport, IgG homeostasis, and fate of IgG-Fc-coupled drugs. J Immunol. 2003;170(7):3528–33. doi:10.4049/jimmunol.170.7.3528. PMID:12646614.
- Deng R, Meng YG, Hoyte K, Lutman J, Lu Y Iyer S, DeForge LE, Theil F-P, Fielder PJ, Prabhu S. Subcutaneous bioavailability of therapeutic antibodies as a function of FcRn binding affinity in mice. MAbs. 2012;4(1):101–9. doi:10.4161/mabs.4.1.18543. PMID:22327433.
- Chaudhury C, Mehnaz S, Robinson JM, Hayton WL, Pearl DK, Roopenian DC, Anderson CL. The major histocompatibility complex–related Fc receptor for IgG (FcRn) binds albumin and prolongs its lifespan. J Exp Med. 2003;197(3):315–22. doi:10.1084/jem.20021829. PMID:12566415.
- Bern M, Sand KM, Nilsen J, Sandlie I, Andersen JT. The role of albumin receptors in regulation of albumin homeostasis: Implications for drug delivery. J Control Release. 2015;211:144–62. doi:10.1016/j.jconrel.2015.06.006. PMID:26055641.
- Sand KM, Bern M, Nilsen J, Noordzij HT, Sandlie I, Andersen JT. Unraveling the interaction between FcRn and albumin: Opportunities for design of albumin-based therapeutics. Front Immunol. 2015;5:682. doi:10.3389/fimmu.2014.00682. PMID:25674083.
- Akilesh S, Christianson GJ, Roopenian DC, Shaw AS. Neonatal FcR expression in bone marrow-derived cells functions to protect serum IgG from catabolism. J Immunol 2007;4580–8.
- Latvala S, Jacobsen B, Otteneder MB, Herrmann A, Kronenberg S. Distribution of FcRn across species and tissues. J Histochem Cytochem. 2017;65(6):321–33. doi:10.1369/0022155417705095. PMID:28402755.
- Qiao SW, Kobayashi K, Johansen FE, Sollid LM, Andersen JT, Milford E, Roopenian DC, Lencer WI, Blumberg RS. Dependence of antibody-mediated presentation of antigen on FcRn. Proc Natl Acad Sci U S A. 2008;105(27):9337–42. doi:10.1073/pnas.0801717105. PMID:18599440.
- Kobayashi K, Qiao SW, Yoshida M, Baker K, Lencer WI, Blumberg RS. An FcRn-dependent role for anti-flagellin immunoglobulin G in pathogenesis of colitis in mice. Gastroenterology. 2009;137(5):1746–56. e1. doi:10.1053/j.gastro.2009.07.059. PMID:19664634.
- Montoyo HP, Vaccaro C, Hafner M, Ober RJ, Mueller W, Ward ES. Conditional deletion of the MHC class I-related receptor FcRn reveals the sites of IgG homeostasis in mice. Proc Natl Acad Sci U S A. 2009;106(8):2788–93. doi:10.1073/pnas.0810796106.
- Zhu X, Meng G, Dickinson BL, Li X, Mizoguchi E, Miao L, Wang Y, Robert C, Wu B, Smith PD, et al. MHC class I-related neonatal Fc receptor for IgG is functionally expressed in monocytes, intestinal macrophages, and dendritic cells. J. Immunol. 2001;166:3266–76. doi:10.4049/jimmunol.166.5.3266. PMID:11207281.
- Vidarsson G, Stemerding AM, Stapleton NM, Spliethoff SE, Janssen H, Rebers FE, de Haas M, van de Winkel JG. FcRn: an IgG receptor on phagocytes with a novel role in phagocytosis. Blood. 2006;108(10):3573–9. doi:10.1182/blood-2006-05-024539. PMID:16849638.
- Borvak J, Richardson J, Medesan C, Antohe F, Radu C, Simionescu M, Ghetie V, Ward ES. Functional expression of the MHC class I-related receptor, FcRn, in endothelial cells of mice. Int Immunol. 1998;10(9):1289–98. doi:10.1093/intimm/10.9.1289. PMID:9786428.
- Wang W, Wang EQ, Balthasar JP. Monoclonal antibody pharmacokinetics and pharmacodynamics. Clin Pharmacol Ther. 2008;84(5):548–58. doi:10.1038/clpt.2008.170. PMID:18784655.
- Antohe F, Radulescu L, Gafencu A, Ghetie V, Simionescu M. Expression of functionally active FcRn and the differentiated bidirectional transport of IgG in human placental endothelial cells. Hum Immunol. 2001; 62:93–105. doi:10.1016/S0198-8859(00)00244-5. PMID:11182218.
- Fan YY, Neubert H. Quantitative analysis of human neonatal Fc receptor (FcRn) tissue expression in transgenic mice by online peptide immuno-affinity LC-HRMS. Anal Chem. 2016;88(8):4239–47. doi:10.1021/acs.analchem.5b03900. PMID:27012525.
- Fan YY, Avery LB, Wang M, O'Hara DM, Leung S, Neubert H. Tissue expression profile of human neonatal Fc receptor (FcRn) in Tg32 transgenic mice. MAbs. 2016;8(5):848–53. doi:10.1080/19420862.2016.1178436. PMID:27104806.
- Powner MB, McKenzie JA, Christianson GJ, Roopenian DC, Fruttiger M. Expression of neonatal Fc receptor in the eye. Invest Ophthalmol Vis Sci. 2014;55(3):1607–15. doi:10.1167/iovs.13-12574. PMID:24550358.
- Tam SH, McCarthy SG, Brosnan K, Goldberg KM, Scallon BJ. Correlations between pharmacokinetics of IgG antibodies in primates vs. FcRn-transgenic mice reveal a rodent model with predictive capabilities. MAbs. 2013;5(3):397–405. doi:10.4161/mabs.23836.
- Avery LB, Wang M, Kavosi MS, Joyce A, Kurz JC, Fan YY, Dowty ME, Zhang M, Zhang Y, Cheng A, Hua F, Jones HM, Neubert H, Polzer RJ, O'Hara DM. Utility of a human FcRn transgenic mouse model in drug discovery for early assessment and prediction of human pharmacokinetics of monoclonal antibodies. MAbs. 2016;8(6):1064–78. doi:10.1080/19420862.2016.1193660. PMID:27232760.
- Dirks NL, Meibohm B. Population pharmacokinetics of therapeutic monoclonal antibodies. Clin Pharmacokinet. 2010;49(10):633–59. doi:10.2165/11535960-000000000-00000.
- Roopenian DC, Christianson GJ, Proetzel G, Sproule TJ. Human FcRn transgenic mice for pharmacokinetic evaluation of therapeutic antibodies. Methods Mol Biol. 2016;1438:103–14. doi:10.1007/978-1-4939-3661-8_6. PMID:27150086.
- Akilesh S, Huber TB, Wu H, Wang G, Hartleben B, Kopp JB, Miner JH, Roopenian DC, Unanue ER, Shaw AS. Podocytes use FcRn to clear IgG from the glomerular basement membrane. Proc Natl Acad Sci U S A. 2008;105(3):967–72. doi:10.1073/pnas.0711515105. PMID:18198272.
- Porter CJ, Charman SA. Lymphatic transport of proteins after subcutaneous administration. J Pharm Sci. 2000;89(3):297–310. doi:10.1002/(SICI)1520-6017(200003)89:3%3c297::AID-JPS2%3e3.0.CO;2-P. PMID:10707011.
- Kagan L, Zhao J, Mager DE. Interspecies pharmacokinetic modeling of subcutaneous absorption of rituximab in mice and rats. Pharm Res. 2014;31(12):3265–73. doi:10.1007/s11095-014-1416-1. PMID:24852895.
- Kagan L, Turner MR, Balu-Iyer SV, Mager DE. Subcutaneous absorption of Monoclonal antibodies: Role of dose, site of injection, and injection volume on rituximab pharmacokinetics in rats. Pharm Res. 2012;29(2):490–9. doi:10.1007/s11095-011-0578-3. PMID:21887597.
- Wu F, Tamhane M, Morris ME. Pharmacokinetics, lymph node uptake, and mechanistic PK model of near-infrared dye-labeled bevacizumab after IV and SC administration in mice. AAPS J. 2012;14(2):252–61. doi:10.1208/s12248-012-9342-9. PMID:22391791.
- Proshina LG. Macrophages of subcutaneous connective tissue after treatment with α -tocopherol and dehydration. Bulletin of Experimental Biology and Medicine (Morphology and pathomorphology) 1998;5:521–4. doi:10.1007/BF02445303.
- Fathallah AM, Bankert RB, Balu-Iyer SV. Immunogenicity of subcutaneously administered therapeutic proteins–a mechanistic perspective. AAPS J. 2013;15(4):897–900. doi:10.1208/s12248-013-9510-6. PMID:23856740.
- Kuan EL, Ivanov S, Bridenbaugh EA, Victora G, Wang W, Childs EW, Platt AM, Jakubzick CV, Mason RJ, Gashev AA, et al. Collecting lymphatic vessel permeability facilitates adipose tissue inflammation and distribution of antigen to lymph node-homing adipose tissue dendritic cells. J Immunol. 2015;194(11):5200–10. doi:10.4049/jimmunol.1500221. PMID:25917096.
- Zheng Y, Tesar DB, Benincosa L, Birnböck H, Boswell CA, Bumbaca D, Cowan KJ, Danilenko DM, Daugherty AL, Fielder PJ, et al. Minipig as a potential translatable model for monoclonal antibody pharmacokinetics after intravenous and subcutaneous administration. MAbs. 2012;4(2):243–55. PMID:22453096.
- Haraya K, Tachibana T, Nezu J. Quantitative prediction of therapeutic antibody pharmacokinetics after intravenous and subcutaneous injection in human. Drug Metab Pharmacokinet. 2017;32(4):208–17. doi:10.1016/j.dmpk.2017.05.002. PMID:28734646.
- Weisberg SP, McCann D, Desai M, Rosenbaum M, Leibel RL, Ferrante AW Jr. Obesity is associated with macrophage accumulation in adipose tissue. J Clin Invest. 2003;112:1796–808. PMID:14679176.
- Stein C. Klinische Labordiagnostik und Pharmakokinetik humanisierter therapeutischer Antikörper in human FcRn transgenen Mäusen. DVM thesis 2011, Ludwig-Maximilians-Universität München (https://edoc.ub.uni-muenchen.de/12925/1/Stein_Carsten.pdf).
- Andersen JT, Dalhus B, Viuff D, Ravn BT, Gunnarsen KS, Plumridge A, Bunting K, Antunes F, Williamson R, Athwal S, Allan E, Evans L, Bjørås M, Kjærulff S, Sleep D, Sandlie I, Cameron J. Extending serum half-life of albumin by engineering neonatal Fc receptor (FcRn) binding. J Biol Chem. 2014;289(19):13492–502. doi: 10.1074/jbc.M114.549832.
- Datta-Mannan A, Croy JE, Schirtzinger L, Torgerson S, Breyer M, Wroblewski VJ. Aberrant bispecific antibody pharmacokinetics linked to liver sinusoidal endothelium clearance mechanism in cynomolgus monkeys. MAbs. 2016;8(5):969–82. doi: 10.1080/19420862.2016.1178435.
- Mordenti J, Rescigno A. Estimation of permeance time, exit time, dilution factor, and steady-state volume of distribution. Pharm Res 1992;9:17–25.
- Straughn AB. Limitations of noncompartmental pharmacokinetic analysis of biotech drugs. In Meibohm B (editor): Pharmacokinetics and pharmacodynamics of biotech drugs: Principles and case studies in drug development. Wiley-VCH Verlag, Weinheim, 2006.
- Chen Y, Balthasar JP. Evaluation of a catenary PBPK model for predicting the in vivo disposition of mAbs engineered for high-affinity binding to FcRn; AAPS J. 2012;14(4):850–9. doi:10.1208/s12248-012-9395-9.
- Hansen RJ, Balthasar JP. Pharmacokinetic/pharmacodynamic modeling of the effects of intravenous immunoglobulin on the disposition of antiplatelet antibodies in a rat model of immune thrombocytopenia. J Pharm Sci. 2003;92(6):1206–15. PMID:12761810.
- Ferl GZ, Wu AM, DiStefano JJ 3rd. A predictive model of therapeutic monoclonal antibody dynamics and regulation by the neonatal Fc receptor (FcRn). Ann Biomed Eng. 2005;33(11):1640–52. doi:10.1007/s10439-005-7410-3. PMID:16341929.
- Garg A, Balthasar JP. Physiologically-based pharmacokinetic (PBPK) model to predict IgG tissue kinetics in wild-type and FcRn-knockout mice. J Pharmacokinet Pharmacodyn. 2007;34(5):687–709. doi:10.1007/s10928-007-9065-1. PMID:17636457.
- Xiao JJ. Pharmacokinetic models for FcRn-mediated IgG disposition. J Biomed Biotechnol. 2012;2012:282989. doi:10.1155/2012/282989. PMID:22665983.
- Fuhrmann S, Kloft C, Huisinga W. Impact of altered endogenous IgG on unspecific mAb clearance. J Pharmacokinet Pharmacodyn. 2017;44(4):351–74. doi:10.1007/s10928-017-9524-2. PMID:28439684.
- Li L, Gardner I, Dostalek M, Jamei M. Simulation of monoclonal antibody pharmacokinetics in humans using a minimal physiologically based model. AAPS J. 2014;16(5):1097–109. doi:10.1208/s12248-014-9640-5. PMID:25004823.
- Niederalt C, Kuepfer L, Solodenko J, Eissing T, Siegmund HU, Block M, Willmann S, Lippert J. A generic whole body physiologically based pharmacokinetic model for therapeutic proteins in PK-Sim. J Pharmacokinet Pharmacodyn. 2018;45:235–257. doi:10.1007/s10928-017-9559-4. [Epub ahead of print ].
- Petkova SB, Akilesh S, Sproule TJ, Christianson GJ, Al KH, Brown AC, Presta LG, Meng YG, Roopenian DC. Enhanced halflife of genetically engineered human IgG1 antibodies in a humanized FcRn mouse model: potential application in humorally mediated autoimmune disease. Int Immunol 2006;18:1759–69. doi:10.1093/intimm/dxl110. PMID:17077181.
- Roopenian DC, Christianson GJ, Sproule TJ. Human FcRn transgenic mice for pharmacokinetic evaluation of therapeutic antibodies. Methods Mol Biol 2010;602:93–104. doi:10.1007/978-1-60761-058-8_6. PMID:20012394.
- Christianson GJ, Sun VZ, Akilesh S, Pesavento E, Proetzel G, Roopenian DC. Monoclonal antibodies directed against human FcRn and their applications. MAbs. 2012;4(2):208–16. doi:10.4161/mabs.4.2.19397. PMID:22453095.
- Fronton L, Pilari S, Huisingua W. Monoclonal antibody disposition: a simplified PBPK model and its implications for the derivation and interpretation of classical compartment models. J Pharmacokinet Pharmacodyn. 2014;41:87–107, doi:10.1007/s10928-014-9349-1. PMID:24493102.
- Sheiner LB, Rosenberg B, Melmon KL. Modelling of individual pharmacokinetics for computer-aided drug dosage. Comput Biomed Res. 1972;5(5):441–59. doi:10.1016/0010-4809(72)90051-1.
- MATLAB and Statistics Toolbox Release 2013b, The MathWorks, Inc., Natick, Massachusetts, United States.