
 ?Mathematical formulae have been encoded as MathML and are displayed in this HTML version using MathJax in order to improve their display. Uncheck the box to turn MathJax off. This feature requires Javascript. Click on a formula to zoom.
ABSTRACT
The linear pharmacokinetics (PK) of therapeutic monoclonal antibodies (mAbs) can be considered a class property with values that are similar to endogenous IgG. Knowledge of these parameters across species could be used to avoid unnecessary in vivo PK studies and to enable early PK predictions and pharmacokinetic/pharmacodynamic (PK/PD) simulations. In this work, population-pharmacokinetic (popPK) modeling was used to determine a single set of ‘typical’ popPK parameters describing the linear PK of mAbs in human, cynomolgus monkey and transgenic mice expressing the human neonatal Fc receptor (hFcRn Tg32), using a rich dataset of 27 mAbs. Non-linear PK was excluded from the datasets and a 2-compartment model was applied to describe mAb disposition. Typical human popPK estimates compared well with data from comparator mAbs with linear PK in the clinic. Outliers with higher than typical clearance were found to have non-specific interactions in an affinity-capture self-interaction nanoparticle spectroscopy assay, offering a potential tool to screen out these mAbs at an early stage. Translational strategies were investigated for prediction of human linear PK of mAbs, including use of typical human popPK parameters and allometric exponents from cynomolgus monkey and Tg32 mouse. Each method gave good prediction of human PK with parameters predicted within 2-fold. These strategies offer alternative options to the use of cynomolgus monkeys for human PK predictions of linear mAbs, based on in silico methods (typical human popPK parameters) or using a rodent species (Tg32 mouse), and call into question the value of completing extensive in vivo preclinical PK to inform linear mAb PK.
Introduction
Therapeutic monoclonal antibodies (mAbs) have become an important class of drugs, with over 40 antibody-based therapies approved by the US FDA across multiple indications and many more in clinical trials.Citation 1 Advances in antibody engineering have enabled rapid progress from the first generation of highly immunogenic murine and chimeric antibodies to better tolerated humanized and fully human mAbs. Recently, the variety of antibody-like modalities has evolved further to include Fc-fusion proteins, antibody-drug conjugates and bispecific antibody products. In addition to their exquisite specificity and potency, mAbs are successful therapeutics due to their long pharmacokinetic (PK) half-life.Citation 2 Low clearance of mAbs from the systemic circulation enables them to be administered less frequently than their peptide or small molecule counterparts, which is more convenient for the treatment of chronic diseases.
The PK properties of mAbs are a function of their large size (150 kDa), relative polarity, Fc-receptor binding and specific binding to target antigens. The primary elimination route for mAbs is cellular uptake followed by proteolytic degradation. There are two distinct catabolic pathways for mAbs.Citation 3 The first is a non-specific, linear (first-order) clearance (CL) pathway mediated by fluid phase pinocytosis or unspecific fluid phase endocytosis.Citation 2 This common pathway shared by endogenous IgG and therapeutic mAbs operates independently of the specific interaction between a mAb and its pharmacological target. This pathway is not easily saturated at therapeutic doses, and tends to result in linear CL. FcRn functions as a salvage receptor to protect IgG from rapid intracellular catabolism, and is responsible for the long half-life of endogenous IgG and exogenous IgG-based therapeutic proteins.Citation 4
The second catabolic pathway is a non-linear (target mediated) CL pathway mediated by the specific interaction between the Fab region of the antibody and its pharmacological target. This pathway is often referred to as target-mediated drug disposition (TMDD). Following binding of the mAb to its target on the cell surface, the mAb-antigen complex is internalized and then trafficked via the endosomes to the lysosomes where the complex is degraded. When the target binding is saturated, the relative importance of target binding to overall disposition is diminished and the mAb is eliminated by first order process.Citation 2 For mAbs exhibiting this pathway, disposition depends upon the concentration and distribution of the mAb, along with target receptor expression, internalization and turnover rates.Citation 5 Certain mAbs to soluble targets can also undergo TMDD driven by binding of 2 or more mAbs to form multimeric complexes that are rapidly eliminated by phagocytosis. mAbs cleared primarily by TMDD will have dose-dependent non-linear elimination. For these mAbs, PK is distinctly different from the catabolism of endogenous IgG, with higher CL and shorter half-life values at lower doses.
The rate and extent of mAb distribution is very slow and depends upon extravasation in tissue, distribution within the particular tissue and degradation. The convective CL of mAbs from the tissue is thought to be more efficient than the process of convective extravasation, thereby maintaining relatively low mAb concentrations in the interstitial fluid.Citation 6 ,Citation 7 As a result of this, mAbs often have small apparent volumes of distribution.Citation 8 ,Citation 9
The ability to predict the PK of a drug prior to first-in-human studies is of utmost importance to reduce attrition in Phase 1. Preclinical testing of mAbs often occurs in a rodent species and non-human primate (NHP) to understand efficacy and toxicity prior to human dosing. Cynomolgus monkey is the preferred strain of NHP for preclinical PK and toxicological studies due to a high genetic similarity with humans, and therefore greater likelihood of target antigen sequence homology, comparable binding affinities for cynomolgus monkey vs human FcRn,Citation 10 and similar tissue cross-reactivity profiles. Cynomolgus monkey is also the preferred species for predicting the PK of mAbs with linear CL in humans: several groups have reported the successful use of fixed allometric exponents to predict CL and volume of distribution of mAbs in human from data in cynomolgus monkey.Citation11-Citation14 For mAbs that exhibit non-linear CL due to TMDD, scaling of PK is more challenging. In order to take into account the kinetics of mAb binding to its target, a mechanistic TMDD model is required, with proper exploration of species differences in target expression and binding.Citation 5 ,Citation15-Citation17
In this study, the objective was to complete a comprehensive analysis of the linear PK of therapeutic mAbs using popPK methods. The dataset was composed of 27 Pfizer mAbs where PK had been generated in at least one of three species: human, cynomolgus monkeys and human FcRn Tg32 homozygous transgenic mice. Given that the linear, Fc-mediated elimination is a common pathway shared by both endogenous IgG and therapeutic IgG of mAbs, it was theorized that a single set of ‘typical’ linear PK parameters could be estimated for each species, describing the linear PK of all mAbs in the dataset. PopPK is an ideal technique to investigate this because it can separately estimate variability, including variability between mAbs, between individuals in a given mAb dataset and also random, non-specific error.Citation 18 The resulting ‘typical’ linear PK parameter estimates could be used for designing PK/PD and toxicology studies, dose predictions and viability assessments. For tractable mAbs with linear PK in preclinical species, it could forfeit the requirement for allometric scaling for clinical PK predictions; instead the typical PK parameters could be used as a substitute until clinical PK is obtained. In addition to cynomolgus monkey, we also studied the potential of a human FcRn Tg32 transgenic mouse model to predict linear PK of mAbs in human. The availability of a rodent model to accurately estimate human PK of mAbs would enable earlier predictions, before cynomolgus monkey data is routinely available. In addition to the single species analysis, a combined analysis was performed on the entire dataset of human, cynomolgus monkey and hFcRn Tg32 transgenic mice and used to estimate allometric co-efficients between species. While our primary focus was to explore PK predictions utilizing a variety of species, we also investigated the value of an in vitro assay measuring self-association in predicting the CL of mAbs in the dataset. The analysis herein provides robust strategies for predicting linear human PK of mAbs, which could improve throughput for lead drug candidate selection, and potentially increase the overall success while decreasing the time for non-clinical development of mAbs.
Results
mAb PK dataset and selection of linear dose range
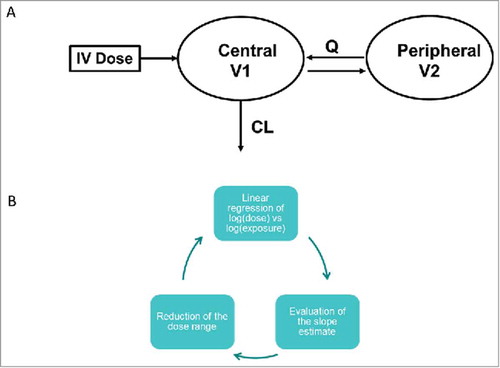
Properties of the mAbs included in this study are summarized in . Of the 27 mAbs analyzed, 12 were IgG1 and 15 were IgG2; 16 were specific for soluble ligand targets, 9 bound to membrane targets and 2 had both membrane and soluble targets; 16 of the mAbs were fully human, 10 were humanized and 1 was from a human phage display library. All of the mAbs had similar binding Kd values to FcRn and had wild type sequences for the FcRn binding region. For 18 of these mAbs, clinical PK data were available; cynomolgus monkey PK data were available for 23 mAbs; and 11 mAbs had PK in hFcRn Tg32 transgenic mouse. As discussed in the materials and methods section, non-linear data were removed from the dataset to enable analysis of linear PK only. This was completed via a combination of visual inspection and application of an algorithm applied to a linear regression of dose and AUC to test for deviation of the slope from 1 (). The remaining linear dose range and number of dose levels included in the popPK analysis for each mAb are summarized in .
Table 1. Monoclonal antibodies in this study.
Figure 1. (a) 2-compartment PK model and (b) algorithm to test for linearity of PK data.
Population PK analysis across species
The concentration versus time relationships in Tg32 mouse, cynomolgus monkey and human mAb datasets were described using a 2-compartmental PK model () with inter-individual variability (IIV) on CL and volume of the central compartment (V1). Residual error was determined per compound and covariance was estimated between CL and V1. This model adequately captured the PK of all compounds in each species. The PK data for the mAbs in each dataset could be described using a single set of popPK parameters. The parameter estimates for each species are shown in , with 95% confidence intervals. The popPK estimate of human CL (0.15 mL/h/kg (0.14–0.16)) was in the same range as the CL of endogenous IgG (0.125 mL/h/kg).Citation 19 ,Citation 20 CL was lowest in humans (0.15 mL/h/kg (0.14–0.16)), followed by cynomolgus monkey (0.27 mL/h/kg (0.24–0.30)) and then Tg32 mouse (0.35 mL/h/kg (0.28– 0.41)). Population estimates of the volumes of distribution in the central (V1) and peripheral (V2) compartments were typically small and approximated plasma volume. The inter-compartmental clearance parameter, Q, varied the most across species and was estimated to be 0.27 mL/h/kg (0.25– 0.30) in human, 1.00 mL/h/kg (0.8–1.20) in cynomolgus monkey and 4.40 mL/h/kg (3.17– 5.62) in Tg32 mouse. Inter-individual variability in V1 was low and moderate-high for CL, which may be expected from the methodology chosen in which PK parameters were estimated for all compounds combined, instead of estimating separate parameters for each compound. Covariance between CL and V1 was low, representing low correlation between the random effects on the parameter estimates. The relative standard error (RSE) was lower than 35% for all parameters representing low uncertainty in parameter estimation.
Table 2. Single species popPK parameter estimates for mAbs with linear CL.
Results from a jackknife analysis showed consistent estimation of PK parameters without significant influence from removal of one mAb from the dataset at a time. PK parameters from the jackknife analysis with 95% confidence intervals are shown in Supplementary Fig. 1. Residual error per compound and diagnostic plots of observed concentration versus individual and population predictions in each species are included in Supplementary Tables 1 and 2 and Supplementary Figs. 2 and 3.
Distribution of clearance and volume of distribution of the central compartment
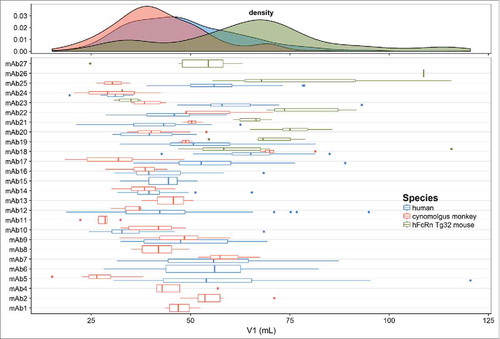
The distribution of CL estimates and the individual estimates of CL (with IIV) for each mAb across species are shown in . This plot shows a typical log normal distribution of individual CL estimates. In general, CL is lowest in human, followed by cynomolgus monkey and then Tg32 mouse. The distribution of population and individual estimates of V1 for each mAb across species are shown in . The estimates of V1 are normally distributed in cynomolgus monkey and human and center on plasma volume (30– 50 mL/kg). It should be noted that more variability was observed in individual estimates of V1 in Tg32 mouse compared with cynomolgus monkey or human. This may have been due to restricted time points in the initial phase of PK sample collection in Tg32 mouse.
Figure 2. Distribution of population and individual mAb estimates (with variability) of clearance (CL) in the combined human, cynomolgus monkey and hFcRn Tg32 mouse dataset.
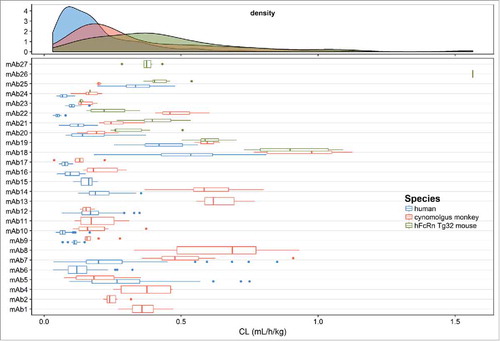
Figure 3. Distribution of population and individual mAb estimates (with variability) of volume of distribution of the central compartment (V1) in the combined human, cynomolgus monkey and hFcRn Tg32 mouse dataset.
Comparison of human population PK parameter estimates with population PK of literature mAbs
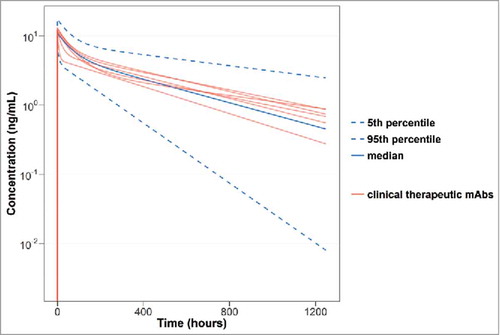
In order to put the results into context, popPK parameters determined for the current mAb dataset were compared with therapeutic mAbs with linear CL in clinical studies. 5 fully human, humanized or chimeric therapeutic mAbs were identified with linear CL in humans and 2-compartment popPK analyses published in the literature. Population estimates of CL, Q, V1 and V2 for the Pfizer mAbs and bevacizumab, infliximab (2 different indications), pertuzumab, rituximab and trastuzumab in human are shown in . The parameter estimates reported for the comparator clinical mAbsCitation 19 are very close to the population parameter estimates generated from the analysis of 18 clinical mAbs described herein. An outlier was infliximab for ulcerative colitis (UC), which had a reported mean CL of 0.24 mL/h/kg and Q of 4.25 mL/h /kg, which deviates significantly from the population CL estimates of 0.15 mL/h /kg (0.14– 0.16) and Q estimates of 0.27 mL/h /kg (0.25– 0.3), estimated in this analysis. shows the concentration versus time profiles for the median and 95% prediction interval with observed dose-normalized concentration-time data for the 18 clinical mAbs in this study and the 5 clinical therapeutic mAbs (bevacizumab, infliximab, pertuzumab, rituximab and trastuzumab).
Table 3. Comparison of typical popPK parameter estimates in human with test set of clinical mAbs with linear PK.
Figure 4. Median, 5th and 95th percentiles of 200 bootstrap samples with the combined species PK model using the observed dose-normalized concentration (ng/mL) vs. time (hours) data for all of the mAbs in this study. The red lines indicate the concentration vs. time profile of the 5 clinical therapeutic mAbs (bevacisumab, infliximab (for both ankylosing spondylitis and ulcerative colitis), pertuzumab, rituximab and trastuzumab).
Clearance outliers and correlation with non-specific interactions
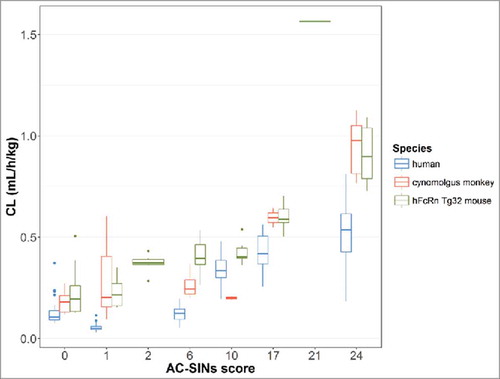
Four of the mAbs in the human dataset had CL values 2-fold higher than the population estimate of 0.15 mL/h/kg (0.14–0.16) (). In order to investigate possible non-specific (off target) binding properties, a subset of the mAbs in the dataset (n=11) were studied using an in vitro affinity capture self-interaction nanoparticle spectroscopy (AC-SINS) assay. This assay assesses self-association, which is often coupled with other poor physicochemical characteristics, including non-specific interactions. AC-SINS uses gold nanoparticles pre-coated with anti-human Fc polyclonal antibodies to capture test mAbs. Self-interactions of immobilized mAbs lead to clustering of the gold nanoparticles, which is measured by a shift in absorbance due to changes in their optical properties.Citation 21 The 11 mAbs studied had AC-SINS scores ranging from 0–24 (). A plot of CL (mL/h/kg) vs. AC-SINS score for each species is shown in . An increase in CL was observed with an increase in AC-SINS scores in all species. This data suggests that non-specific interactions leading to off-target binding may result in faster clearance than predicted by the popPK estimates.
Figure 5. Clearance vs. AC-SINS score for a subset of 11 mAbs in the dataset in human, cynomolgus monkey and hFcRn Tg32 mouse.
Combined analysis and estimation of allometric exponents
The Tg32 mouse and human datasets, cynomolgus monkey and human datasets and datasets from all three species were combined. 2-compartment human PK parameters were estimated in the combined datasets and allometric exponents to scale the PK parameters from preclinical species to human (). The human popPK estimates of CL, Q, V1 and V2 in the combined datasets were similar to those estimated previously (). The estimated allometric exponent for scaling Tg32 mouse CL to human was 0.9 (0.88– 0.92), cynomolgus monkey CL to human was 0.81 (0.77– 0.85) and all preclinical data CL to human was 0.89 (0.87– 0.91). Volumes of distribution from central and peripheral compartments in general scaled with an allometric exponent of approximately 1. Population estimates of the allometric exponent for Q were between 0.57 and 0.67 for Tg32 mouse, cynomolgus monkey and all species.
Table 4. Combined species PK parameter estimates for mAbs with linear CL.
Linear mAb human PK prediction strategies
Different methods were applied to predict human PK of the mAbs in this dataset. Note, a limitation to this analysis is that there was no separate test dataset to validate the inter-species scaling.
Use of ‘typical’ PK parameters for human
Simulations of the popPK estimates of CL, Q, V1 and V2 estimated from the human dataset, compared with observed clinical PK profiles for the individual mAbs, are shown in . Root mean square errors (RMSEs) between observed and predicted data are shown in . Only 4 of 18 mAbs have RMSEs of >100%, indicating that the human popPK parameters can adequately predict PK for the majority of mAbs in the dataset.
Use of allometric exponents estimated from Tg32 mouse or cynomolgus monkey
Predicted human PK profiles using ‘typical’ human popPK parameter estimates (
), compared with observed (individual) dose normalized human PK data (symbols) and profiles from fitting human data for individual mAbs (
 ).
).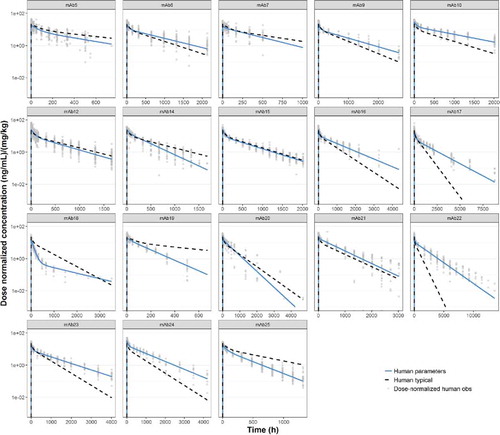
Comparison of observed human PK parameters for individual mAbs with ‘typical’ human popPK parameter estimates.
For every mAb in the dataset with both Tg32 mouse data and human data (n=8), mouse 2- compartment PK parameters were scaled to human using the allometric exponents estimated for Tg32 mouse (). This process was also completed for every mAb in the dataset with both cynomolgus monkey and human data (n=16). Simulations of the scaled PK parameters of CL, Q, V1 and V2 estimated from the Tg32 mouse dataset, cynomolgus monkey dataset or the population values estimated from the human dataset were compared with observed clinical PK for individual mAbs (). RMSEs between observed and predicted data are shown in and for Tg32 mouse and cynomolgus monkey, respectively. As shown in , RMSEs were compared across different prediction methods: use of human popPK parameters or allometric exponents estimated for Tg32 mouse or cynomolgus monkey. The best prediction method (determined by the lowest RMSE) is indicated for each mAb.
Figure 7. Predicted human PK profiles using (a) allometric exponents estimated for Tg32 mouse (

 ) and (c) ‘typical’ human popPK parameter estimates (
 ). Simulated data is compared with observed (individual) dose normalized human PK data (symbols) and profiles from fitting human data for individual mAbs (
 ).
).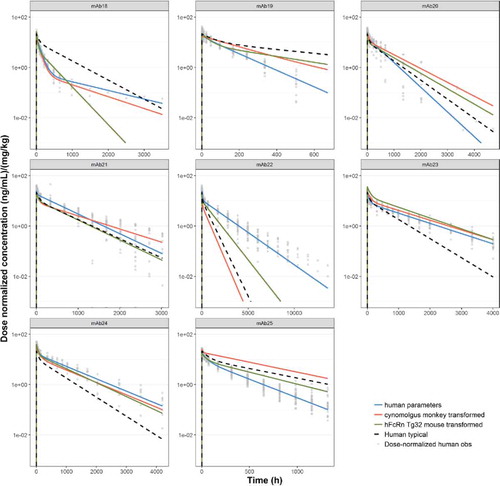
Table 6. Comparison of observed human PK parameters for individual mAbs and predicted human pharmacokinetic parameters determined by allometric scaling from hFcRnTg32 mouse.
Table 7. Comparison of observed human PK parameters for individual mAbs and predicted human pharmacokinetic parameters determined by allometric scaling from cynomolgus monkey.
Table 8. Comparison of model prediction RMSE (%) across different methods: use of human PopPK parameters, allometric scaling from Tg32 mouse and allometric scaling from cynomolgus monkey. The best prediction method (determined by lowest RMSE) is indicated for each mAb.
Discussion
In this study, we report a meta-analysis of the linear PK of mAbs across different species used in the pharmaceutical industry. Data on Pfizer mAbs were available from historical studies in human or cynomolgus monkey. In addition, for a subset of mAbs, PK data were available in transgenic mice expressing the human neonatal Fc receptor (Tg32 homozygous hFcRn mice). The hFcRn Tg32 mouse model was chosen over wild type (WT) mouse because mAb PK is often variable in WT mouse with poor predictability to human, which may be due to species differences in binding of human mAbs to mouse FcRn.Citation 22 ,Citation 23 Following cellular uptake of mAbs exhibiting linear CL, FcRn functions as a salvage receptor to protect IgG from rapid intracellular catabolism. The hFcRn transgenic mouse (Jackson Laboratory) is null for the α chain mFcRn and contains 1 or 2 transgenes of hFcRn, hemizygous or homozygous, respectively.Citation 24 The homozygous Tg32 strain is used in this study with an hFcRn promoter. Avery et al, show that mAb CL in hFcRn homozygous mouse correlates with human PK (r2=0.83, r=0.91) better than NHP (r2=0.67, r=0,82).Citation 23
Population PK analysis across species
The long half-life of endogenous and exogenous IgG in conjunction with small volumes of distribution results in the characteristic bi-exponential decline of mAb concentration-time profiles following intravenous (IV) administration. As such, a 2-compartmental PK model was shown to best describe the data. PopPK analysis is a useful tool that has been used for mAbs to quantify typical disposition characteristics and sources of variability within study populations.Citation 19 ,Citation 25 The advantage of popPK analysis is that it can be used to simultaneously evaluate PK data from all studies and individuals available. We made use of it in this analysis to create a dataset representing a range of mAbs with linear CL, but differences in number of doses, subjects, data points and subject characteristics. A review of the literature performed by Dirks et al. showed that the popPK of different mAbs was similar despite differences in their pharmacological target and the fact that they were studied in different patient populations and disease states.Citation 19 PopPK analysis is often used to study the inter-subject variability of mAb PK and to explore covariates of this variability. Body weight/ surface area are the most commonly identified covariates found to influence the PK of mAbs.Citation 9 ,Citation 19 ,Citation 26 ,Citation 27 The effects of other demographic factors, including age, sex, ethnicity, body size, genetic polymorphisms, concomitant medications, immune status and multiple other patient-specific details, have also been considered.Citation 28
In this analysis, popPK was used to understand and quantify the variability in linear mAb PK. The inter-individual variability represents both inter-mAb and inter-subject variability, as we sought to estimate a single set of PK parameters across mAbs.
The popPK parameters estimated are presented in . These values represent typical 2-compartment PK estimates for mAbs with linear elimination in human, cynomolgus monkey and Tg32 mouse. Knowledge of typical parameter estimates of linear mAb PK a priori can be very useful in understanding and optimizing the PK/PD of a therapeutic mAb. They can be used at early stages to simulate the behavior of a mAb with ‘typical’ PK and to inform project teams on the benefit of extending PK half-life by altering affinity to FcRn. In animal PK studies, they can be used to inform initial parameter estimates for PK/PD modeling and for simulations to optimize in vivo study designs. The parameters can be used as part of a strategy to predict PK in the clinic (as will be discussed below). They could also be used as informative priors for a Bayesian data analysis or to construct parameter uncertainty distributions for clinical trial simulations.
Comparison of human population PK parameter estimates with population PK of literature mAbs
In order to put the human popPK parameter estimates for our dataset into context, they were compared with population estimates for therapeutic mAbs reported to have linear PK in the scientific literature (). Five relevant mAbs were found including bevacizumab, pertuzumab and trastuzumab, which are humanized mAbs, and infliximab and rituximab, which are chimeric mAbs. In addition, different popPK estimates were considered for infliximab in patients with ankylosing spondylitis (AS) and UC.
Estimates of V1 and V2 were similar for the 5 different mAbs and consistent with the population PK parameters estimated herein (). In a review of therapeutic mAb popPK parameters reported by Dirks and Meibohm,Citation 19 which included the 5 mAbs in , the estimate of V1 was 3.1 (2.4– 5.5) L, which is equivalent to 44.3 (34.3– 78.6) mL/kg assuming a 70 kg body weight in human, and very similar to the popPK estimate of V1 in this report of 46.3 (45.1– 47.5) mL/kg. The value of the volume of distribution at steady state (Vss) can be calculated from the sum of V1 and V2. The population estimates for V1 (46.3 mL/kg) and V2 (31.5 mL/kg) in this analysis result in a calculated Vss of 77.8 mL/kg or, 5.4 L assuming a 70 kg individual. Data from early IgG metabolism studies in humansCitation 20 indicates that the mean serum IgG concentration and the total body IgG pool were 12 g/L and 1.06 g/kg, respectively, which for a 70 kg person equates to a volume of distribution of 6.2 L for IgG. In summary, the estimates of both central and peripheral volumes in the analysis reported herein appear to be consistent with published popPK of therapeutic mAbs with linear PK.Citation 19 In addition, calculated Vss is close to endogenous IgG.
The values of CL for the 5 mAbs from the literature varied from 0.12– 0.24 mL/h/kg and were similar to the popPK estimate for CL (0.15 (0.14– 0.16) mL/h/kg). The CL of infliximab in UC patients (0.24 mL/h/kg) was out of the popPK range and different to the CL of infliximab in AS patients (0.16 mL/h/kg). Variation in infliximab CL across patient populations could be due to a number of different factors. Elevated inflammatory status in UC could contribute to higher CL due to a higher whole body turnover rate and increased nonspecific proteolytic degradation rate.Citation 2 ,Citation 29 In addition, CL of infliximab has also been shown to be affected by concomitant medication, as well as immunogenicity.Citation 29 In the analysis by Dirks and Meibohm, the population CL value for therapeutic mAbs ranged between 0.2–0.5 L/day (0.12– 0.3 mL/h/kg assuming a 70 kg individual). This range encompasses the popPK estimate of CL reported here (0.15 mL/h/kg). In addition, assuming a volume of distribution of 6.2 L and an elimination half-life of 21 days for IgG (which doesn't include IgG3), the CL of endogenous IgG is ∼ 0.21 L/day or 0.125 mL/h/kg.Citation 20
The population estimate of the inter-compartmental CL (Q) was in general consistent with the 5 literature mAbs, again with exception of infliximab for UC. The median Q estimated in the Dirks and Meibohm analysis was 0.79 L/day (0.47 mL/h/kg).Citation 19 Our value was slightly lower at 0.27 (0.25–0.3) mL/h/kg, but both are consistent with slow transfer of mAbs between the central and peripheral compartments.
Clearance outliers and correlation with non-specific interactions
Closer inspection of the human analysis indicated that 12 of the 18 mAbs studied had individual CL values within 2-fold of the population estimate of CL (0.075– 0.3 mL/h/kg). Of the remaining 6 mAbs, 3 had CL < 0.075 mL/h/kg (mAb10, mAb22 and mAb24) and 3 had CL >0.3 mL/h/kg (mAb18, mAb19 and mAb25). Unexpected high CL of mAbs is particularly undesirable as it can lead to an increased clinical dose requirement and may limit clinical utility. Higher CL of the mAbs in this dataset was not associated with an alteration in FcRn binding, as all mAbs in this dataset had similar FcRn Kd values.Citation 23
One potential mechanism that can contribute to faster than expected CL of mAbs is off-target binding.Citation 30 The mechanism of this non-specificity has not been fully elucidated, but could be in part due to hydrophobicity/ positive charged patches on mAbs.Citation 31 To test this, an in vitro high throughput assay measuring non-specific binding was implemented and used to identify mAbs with increased risk of having fast CL in humans.Citation 32 An AC-SINS assay was used to screen 11 of the mAbs in the dataset. An AC-SINS score of >11 has been associated with high self-association.Citation 32 The AC-SINS scores for the subset of mAbs tested from this dataset ranged from 0 to 24, with 3 mAbs exhibiting higher than typical CL having scores of 11–24. A correlation was observed with AC-SINS score and mAb CL across all species (). This trend has been observed previously with a larger dataset of mAbsCitation 32 and suggests that the AC-SINS assay is a useful screening tool to de-select mAbs that have the potential for fast clearance in humans.
Predicting human PK
Previous predictions of linear PK of mAbs in the clinic have been completed by single species scaling from cynomolgus monkey assuming allometric principles. Many examples of this type of scaling are available in the literature. The first comprehensive review of mAb CL prediction was completed by Ling et al in 2009. Their study of 14 mAbs indicated that, for mAbs with linear kinetics, CL in humans could be reasonably predicted from monkey data using simplified allometry with a fixed exponent. The optimal exponents were estimated to be 0.85 for soluble antigens and 0.9 for membrane-based antigens.Citation 13 In a similar analysis of 13 mAbs with linear CL, Deng et al showed that simple allometric scaling of CL in cynomolgus monkey with an exponent of 0.85 provided a good estimate of human CL.Citation 11 Dong et al also concluded that single species monkey PK predicted human PK of mAbs with linear CL within 2.3 fold.Citation 12 Oitate et al demonstrated that both human CL and Vss could be predicted reasonably well from monkey data alone using simple allometry with exponents of 0.79 on CL for soluble target antigens and 0.96 on CL for membrane target antigens.Citation 14 The exponent for prediction of Vss was close to 1 in each case.
In all examples cited, the allometric exponent for prediction of mAb CL is > 0.75, which is the standard exponent value used for interspecies scaling of small molecule drugs. This value was derived from the observation that basal metabolic rates and passive renal filtration could be scaled by body weight with an exponent of 0.75. This has been qualified by several groups in the interspecies scaling for prediction of small molecule drug CL.Citation 33 ,Citation 34 Given the mechanisms of CL of small molecules are governed by oxidative metabolism and renal CL, an exponent of 0.75 makes sense. For mAbs, CL is driven by proteolysis a,nd therefore allometric exponents may be more dependent on proteolytic rates across species.
In this study, datasets of Tg32 mouse and human PK, cynomolgus monkey and human PK, and all three species PK were combined to estimate allometric exponents to scale preclinical data to human. The estimated allometric exponent for scaling Tg32 mouse CL to human was 0.90 (0.88– 0.92), cynomolgus monkey CL to human was 0.81 (0.77– 0.85) and all preclinical data CL to human was 0.89 (0.87– 0.91). The exponents required to predict cynomolgus monkey data to human were in agreement with the literature examples. The hFcRn Tg32 mouse data were encouraging as it predicted well to human, and provides a potential species to replace cynomolgus monkey for human PK predictions of mAbs.Citation 23 Volumes of distribution from central and peripheral compartments in general scaled with an allometric exponent of 1, similar to literature analyses. This was the first time that popPK methods had been used to estimate allometric exponents as a parameter within the model. This is a useful method because it facilitates separation of true parameter estimates from variability.
Another benefit of this analysis was that the use of 2-compartmental PK models enabled prediction of human PK profiles as well as PK parameters. The human predicted profiles were compared with 2 -compartmental fits to the observed human data for each mAb and RMSEs were calculated between observed and predicted parameters to assess prediction accuracy. Two approaches were taken. First, the popPK parameter estimates from the human analysis were used to simulate a ‘typical’ human profile. This was compared with profiles generated for each of the 18 individual mAbs in human. This method gave good prediction accuracy, with 14/18 mAbs with RMSEs <100%, indicating that the human popPK parameters were able to predict the human PK for the majority of mAbs in the dataset. This approach assumes that the CL mechanisms for these therapeutic mAbs are the same as each other and endogenous IgG, i.e. non-specific linear catabolic CL. Three of the 4 mAbs with RMSEs greater than 100% had high AC-SINS scores, indicating potential for rapid CL due to non-specific binding. The second approach was to predict human PK using allometric exponents determined from Tg32 mouse and cynomolgus monkey. For this approach, CL mechanisms need not be the same as each other or endogenous IgG, but must be consistent across species. Again, this method gave good prediction of human PK with RMSEs between observed and predicted data < 100% for 6/8 of the mAbs scaled from Tg32 mouse to human and 12/16 of the mAbs scaled from cynomolgus monkey to human.
In summary, good prediction accuracy was obtained using human ‘typical’ popPK parameters as an estimate of human PK or via scaling using allometric exponents from Tg32 mouse or cynomolgus monkey (). All of these methods are simple and easy to use. The use of allometric exponents from cynomolgus monkey is a common approach to linear mAb PK prediction, which is widely understood across the pharmaceutical industry. However, the use of human popPK parameters as base case scenario is more statistically informed than the allometric scaling approach. This is because the human popPK analysis is informed by rigorous analysis of rich datasets both from both this study and literature studies on the popPK of mAbs in human.Citation 19 Single species scaling using allometric exponents requires preclinical PK on individual mAbs, which is often only generated in low ‘n’ of 2–3 animals. Projection therefore relies on a small number of animals whose profile may be affected by many variables, e.g., assay specificities, inter-animal variability and immunogenicity. The strategies presented herein call into question the value of completing extensive in vivo preclinical PK for mAbs with linear CL and encourage refinement of PK strategies consistent with the ‘3Rs’, i.e., the reduction, refinement and replacement of animal use in research, testing and teachingCitation 35 This analysis provides alternatives to the use of cynomolgus monkey for PK prediction, including allometric scaling from Tg32 mouse, or use of human popPK parameters as a replacement to animal-based methods. As such, it has the potential to reduce the numbers of cynomolgus monkey PK studies completed. Use of the AC-SINS assay can also be used to screen out mAbs with high CL due to non-specific binding/self-association.
MAbs with non-linear PK due to target mediated CL mechanisms were not included in this analysis. Modeling of such data is routinely performed using a Michaelis-Menten (M-M) model with linear first-order elimination complemented by a non-linear pathway described using Vmax and Km parameters. Alternatively, a more mechanistic TMDD model that incorporates target properties can be used. Previous work has shown that the TMDD approach is more reliable for human projections because it can capture differences in target properties between species and disease populations.Citation 5 ,Citation 15 ,Citation 17 Since both the M-M and TMDD models require parameterization of the linear CL pathway, the parameters presented herein are a useful guide. Such models have a tendency for over-parameterization, and prior knowledge of typical linear PK parameters across species reduces the need for their estimation.
In conclusion, the popPK analysis completed on 27 Pfizer mAbs in human, cynomolgus monkey or Tg32 mouse showed that a single set of typical linear PK parameters could be estimated across species. These parameters will be useful to inform initial parameters for PK/PD modeling and for simulations to optimize in vivo and first in human study designs. In addition, different translational strategies were investigated for prediction of human linear PK of mAbs. Use of ‘typical’ human PK parameters gave good prediction accuracy for the majority of the mAbs in this study. Allometric exponents were estimated within the popPK model and also gave good predictions, from both Tg32 mouse or cynomolgus monkey to human. The strategies presented herein offer methods to predict linear human PK of mAbs with less reliance on cynomolgus monkey PK and use of smaller animal or in silico alternatives.
Materials and methods
mAb PK dataset
For this study, a dataset was compiled consisting of in-house historical individual concentration versus time data following IV administration of 27 Pfizer mAbs in human, cynomolgus monkey or hFcRn Tg32 transgenic mice. All procedures performed in animals were in accordance with established guidelines and were reviewed and approved by Pfizer's Institutional Animal Care and Use Committee. Research on human samples was conducted in accordance with all applicable Pfizer policies, including institutional review board / independent ethics committee approval. Data for 18/ 27 mAbs were available in healthy human volunteers or patients and consisted of single dose IV PK, at multiple dose levels with n = 3–24 individuals/ dose level. In cynomolgus monkey, single dose IV PK data were available for 23/ 27 mAbs, administered at 1–3 dose levels with n=2 monkeys/ dose. In hFcRn Tg32 transgenic mice, 11 /27 mAbs were administered as previously describedCitation 23 at a single IV dose of 3.5 mg/kg (1 mAb) or 5 mg/kg (10 mAbs) with n=5–6 mice per mAb. For the marketed mAbs, popPK estimates were obtained from the literature.Citation 19
Data inclusion and exclusion criteria: Selection of linear dose range
Non-linear data were removed from the datasets, where TMDD or factors such as immunogenicity were contributing to the overall CL. First, a visual analysis of the data was performed to check for non-linearity, then an algorithm was applied to a linear regression of dose and AUC () to test for deviation of the slope from 1, and the dataset was reduced accordingly. For Tg32 mouse, all PK data were at doses ≥3.5 mg/kg and were included in the analysis. provides details of the linear dose range, number of dose levels that were used in the popPK analysis and the non-linear dose levels removed.
PK model
mAb PK following IV administration was described by a 2-compartment disposition model with first-order elimination from the central compartment. The structural model was parameterized in terms of CL, central volume of distribution (V1), peripheral volume of distribution (V2) and inter-compartmental clearance (Q). Random effects were included as exponential terms reflecting log normal distributions of model parameters. The residual variability was implemented by proportional error model per compound. Goodness-of-fit was determined using the minimum value of the objective function defined as minus twice the log likelihood. For nested models, a decrease of 3.84 points in the objective function (MVOF; corresponding to P < 0.01 in a chi-squared distribution) by adding an additional parameter was considered significant. The goodness-of-fit was also investigated by visual inspection of the plots of individual predictions and the diagnostic plots of (weighted) residuals.
The PK model was applied to each species separately (single species PK analysis) or to a combination of two or three species together (combined species PK analysis). The combined species PK analysis used allometric scaling on all PK parameters by a scaling exponent based on bodyweight. For humans the available bodyweights were used, for cynomolgus monkey and hFcRn Tg32 transgenic mice a bodyweight of 3 kg and 0.02 kg, respectively, was assumed.
Computation
Individual concentration-time data from all subjects for all mAbs were pooled into a single dataset for pop PK analysis using nonlinear mixed effect modeling with the NONMEM software system (Version 7.3, ICON Development Solutions) using ADVAN3 and subroutine 4 and PsN (version 4.6.0).Citation 36 Citation 37 Gfortran version 4.6.0 was used as compiler. Parameters were estimated using the first-order conditional estimation method with interaction between the two levels of stochastic effects (FOCEI).
Model validation
The robustness of the final combined species PK model was evaluated using resampling techniques of a bootstrap method. The bootstrap method involves repeated random sampling of subjects in the dataset. The original dataset is replaced to produce another dataset of the same size, but with a different combination of subjects and compounds. Resampling was repeated 200 times. The obtained PK parameters from the bootstrap sets that produced successful minimization and convergence were used to simulate the concentration time profiles after a single dose of 1 mg/kg for a typical human subject of 70 kg.
In the visual predictive check (VPC), the observation versus time profile was simulated 1000 times by means of Monte Carlo simulations. In a Monte Carlo simulation, random values are drawn from the distributions of the identified random effects. Subsequently, the median and 5 and 95 percentiles of the dependent variables were calculated for each time and plotted together with the observations. A jackknife analysis was also completed with the combined species PK model to test robustness of model predictions. In this type of analysis, one mAb is omitted from the total dataset at a time to test the influence of that mAb on the resulting predictions.
AC-SINS
The affinity capture self-interaction nanoparticle spectroscopy method was implemented as previously described.21,32
PK prediction methods
To predict the human PK of mAbs in this dataset:
Using ‘typical’ PK parameters for human
Clinical data, available for 18 mAbs in the dataset, were fit individually using a 2 compartment PK model as described previously. Individual values of CL, V1, Q and V2 were determined for each mAb, and PK profiles were simulated using fitted parameters. These were compared to simulated profiles using the human popPK values of CL, V1, Q and V2 and root mean square error (RMSE) values calculated using the following equation:
Where n= number of predictions, χ is predicted or observed valueUsing allometric exponents estimated from Tg32 mouse or cynomolgus monkey
For every mAb in the dataset with both Tg32 mouse data and human data (n=8), or cynomolgus monkey and human data (n=16), preclinical species PK parameters were scaled to human using estimated allometric exponents ().
First, the individual Tg32 mouse data for each mAb were fit to a 2-compartment PK model (n=8) as described previously. Individual mAb values of CL, V1, Q and V2 were then scaled to human using the estimated allometric exponents for Tg32 mouse presented in . PK profiles were simulated using the scaled parameters. These were compared with the individual values of CL, V1, Q and V2 estimated for each individual mAb in human, described in section 1 above, and RMSEs calculated as before.
This process was also completed for every mAb in the dataset with both cynomolgus monkey and human data (n=16).
Disclosure of potential conflicts of interest
No potential conflicts of interest were disclosed.
Supplementary_Material.zip
Download Zip (1.2 MB)Acknowledgements
The authors are grateful to the following individuals for their contributions to this work: Steve Penn, Rohit Yadav, Shraddah Desal, Christine Ditondo, Denise O'Hara, Mengmeng Wang, Mania Kavosi, Jeffrey Kurz, Minlei Zhang, Laura Danner, Angela Hernandez, Cynthia Filliettaz, Katie McGinn, Amy King, Laura Lin, Abhinav Tiwari, Fei Hua and Steve Martin.
References
- Mould DR, Meibohm B. Drug development of therapeutic monoclonal antibodies. BioDrugs. 2016;30:275–93. doi:10.1007/s40259-016-0181-6. PMID:27342605.
- Ryman JT, Meibohm B. Pharmacokinetics of monoclonal antibodies. CPT Pharmacometrics Syst Pharmacol. 2017;6:576–88. doi:10.1002/psp4.12224. PMID:28653357.
- Tabrizi MA, Tseng CM, Roskos LK. Elimination mechanisms of therapeutic monoclonal antibodies. Drug Discov Today. 2006;11:81–8. doi:10.1016/S1359-6446(05)03638-X. PMID:16478695.
- Junghans RP, Anderson CL. The protection receptor for IgG catabolism is the beta2-microglobulin-containing neonatal intestinal transport receptor. Proc Natl Acad Sci U S A. 1996;93:5512–6. doi:10.1073/pnas.93.11.5512. PMID:8643606.
- Betts AM, Clark TH, Yang J, Treadway JL, Li M, Giovanelli MA, Abdiche Y, Stone DM, Paralkar VM. The application of target information and preclinical pharmacokinetic/pharmacodynamic modeling in predicting clinical doses of a Dickkopf-1 antibody for osteoporosis. J Pharmacol Exp Ther. 2010;333:2–13. doi:10.1124/jpet.109.164129. PMID:20089807.
- Baxter LT, Zhu H, Mackensen DG, Jain RK. Physiologically based pharmacokinetic model for specific and nonspecific monoclonal antibodies and fragments in normal tissues and human tumor xenografts in nude mice. Cancer Res. 1994;54:1517–28. PMID:8137258.
- Ferl GZ, Wu AM, DiStefano JJ, 3rd. A predictive model of therapeutic monoclonal antibody dynamics and regulation by the neonatal Fc receptor (FcRn). Ann Biomed Eng. 2005;33:1640–52. doi:10.1007/s10439-005-7410-3. PMID:16341929.
- Lobo ED, Hansen RJ, Balthasar JP. Antibody pharmacokinetics and pharmacodynamics. J Pharm Sci. 2004;93:2645–68. doi:10.1002/jps.20178. PMID:15389672.
- Wang W, Wang EQ, Balthasar JP. Monoclonal antibody pharmacokinetics and pharmacodynamics. Clin Pharmacol Ther. 2008;84:548–58. doi:10.1038/clpt.2008.170. PMID:18784655.
- Neuber T, Frese K, Jaehrling J, Jäger S, Daubert D, Felderer K, Linnemann M, Höhne A, Kaden S, Kölln J, et al. Characterization and screening of IgG binding to the neonatal Fc receptor. MAbs. 2014;6:928–42. doi:10.4161/mabs.28744. PMID:24802048.
- Deng R, Iyer S, Theil F-P, Mortensen DL, Fielder PJ, Prabhu S. Projecting human pharmacokinetics of therapeutic antibodies from nonclinical data. mAbs. 2014;3:61–6. doi:10.4161/mabs.3.1.13799.
- Dong JQ, Salinger DH, Endres CJ, Gibbs JP, Hsu CP, Stouch BJ, Hurh E, Gibbs MA. Quantitative prediction of human pharmacokinetics for monoclonal antibodies: Retrospective analysis of monkey as a single species for first-in-human prediction. Clin Pharmacokinet. 2011;50:131–42. doi:10.2165/11537430-000000000-00000. PMID:21241072.
- Ling J, Zhou H, Jiao Q, Davis HM. Interspecies scaling of therapeutic monoclonal antibodies: initial look. J Clin Pharmacol. 2009;49:1382–402. doi:10.1177/0091270009337134. PMID:19837907.
- Oitate M, Masubuchi N, Ito T, Yabe Y, Karibe T, Aoki T, Murayama N, Kurihara A, Okudaira N, Izumi T. Prediction of Human Pharmacokinetics of Therapeutic Monoclonal Antibodies from Simple Allometry of Monkey Data. Drug Metab Pharmacokinet. 2011;26:423–30. doi:10.2133/dmpk.DMPK-11-RG-011. PMID:21606605.
- Dua P, Hawkins E, van der Graaf PH. A Tutorial on Target-Mediated Drug Disposition (TMDD) Models. CPT Pharmacometrics Syst Pharmacol. 2015;4:324–37. doi:10.1002/psp4.41. PMID:26225261.
- Mager DE, Jusko WJ. General pharmacokinetic model for drugs exhibiting target-mediated drug disposition. J Pharmacokinet Pharmacodyn. 2001;28:507–32. doi:10.1023/A:1014414520282. PMID:11999290.
- Singh AP, Krzyzanski W, Martin SW, Weber G, Betts A, Ahmad A, Abraham A, Zutshi A, Lin J, Singh P. Quantitative prediction of human pharmacokinetics for mAbs exhibiting target-mediated disposition. AAPS J. 2015;17:389–99. doi:10.1208/s12248-014-9690-8. PMID:25445845.
- Ette EI, Williams PJ. Population pharmacokinetics I: background, concepts, and models. Ann Pharmacother. 2004;38:1702–6. doi:10.1345/aph.1D374. PMID:15328391.
- Dirks NL, Meibohm B. Population pharmacokinetics of therapeutic monoclonal antibodies. Clin Pharmacokinet. 2010;49:633–59. doi:10.2165/11535960-000000000-00000. PMID:20818831.
- Waldmann TA, Strober W. Metabolism of immunoglobulins. Prog Allergy. 1969;13:1–110. PMID:4186070.
- Liu Y, Caffry I, Wu J, Geng SB, Jain T, Sun T, Reid F, Cao Y, Estep P, Yu Y, et al. High-throughput screening for developability during early-stage antibody discovery using self-interaction nanoparticle spectroscopy. MAbs. 2014;6:483–92. doi:10.4161/mabs.27431. PMID:24492294.
- Ober RJ, Radu CG, Ghetie V, Ward ES. Differences in promiscuity for antibody-FcRn interactions across species: implications for therapeutic antibodies. Int Immunol. 2001;13:1551–9. doi:10.1093/intimm/13.12.1551. PMID:11717196.
- Avery LB, Wang M, Kavosi MS, Joyce A, Kurz JC, Fan YY, Dowty ME, Zhang M, Zhang Y, Cheng A, et al. Utility of a human FcRn transgenic mouse model in drug discovery for early assessment and prediction of human pharmacokinetics of monoclonal antibodies. MAbs. 2016;8:1064–78. doi:10.1080/19420862.2016.1193660. PMID:27232760.
- Roopenian DC, Christianson GJ, Sproule TJ. Human FcRn transgenic mice for pharmacokinetic evaluation of therapeutic antibodies. Methods Mol Biol. 2010;602:93–104. doi:10.1007/978-1-60761-058-8_6. PMID:20012394.
- Davda JP, Dodds MG, Gibbs MA, Wisdom W, Gibbs J. A model-based meta-analysis of monoclonal antibody pharmacokinetics to guide optimal first-in-human study design. MAbs. 2014;6:1094–102. doi:10.4161/mabs.29095. PMID:24837591.
- Bai S, Jorga K, Xin Y, Jin D, Zheng Y, Damico-Beyer LA, Gupta M, Tang M, Allison DE, Lu D, et al. A guide to rational dosing of monoclonal antibodies. Clin Pharmacokinet. 2012;51:119–35. doi:10.2165/11596370-000000000-00000. PMID:22257150.
- Wang DD, Zhang S, Zhao H, Men AY, Parivar K. Fixed dosing versus body size-based dosing of monoclonal antibodies in adult clinical trials. J Clin Pharmacol. 2009;49:1012–24. doi:10.1177/0091270009337512. PMID:19620385.
- Gill KL, Gardner I, Li L, Jamei M. A Bottom-Up Whole-Body Physiologically Based Pharmacokinetic Model to Mechanistically Predict Tissue Distribution and the Rate of Subcutaneous Absorption of Therapeutic Proteins. AAPS J. 2016;18:156–70. doi:10.1208/s12248-015-9819-4. PMID:26408308.
- Feagan BG, Choquette D, Ghosh S, Gladman DD, Ho V, Meibohm B, Zou G, Xu Z, Shankar G, Sealey DC, et al. The challenge of indication extrapolation for infliximab biosimilars. Biologicals. 2014;42:177–83. doi:10.1016/j.biologicals.2014.05.005. PMID:24962198.
- Hotzel I, Theil FP, Bernstein LJ, Prabhu S, Deng R, Quintana L, Lutman J, Sibia R, Chan P, Bumbaca D, et al. A strategy for risk mitigation of antibodies with fast clearance. MAbs. 2012;4:753–60. doi:10.4161/mabs.22189. PMID:23778268.
- Notkins AL. Polyreactivity of antibody molecules. Trends Immunol. 2004;25:174–9. doi:10.1016/j.it.2004.02.004. PMID:15039043.
- Avery LB, Wade J, Wang M, Tam A, King A, Piche-Nicholas N, Kavosi MS, Penn S, Cirelli D, Kurz JC, et al. Establishing in vitro in vivo correlations to screen monoclonal antibodies for physicochemical properties related to favorable human pharmacokinetics. MAbs. 2018:10.
- Hosea NA, Collard WT, Cole S, Maurer TS, Fang RX, Jones H, Kakar SM, Nakai Y, Smith BJ, Webster R, et al. Prediction of human pharmacokinetics from preclinical information: comparative accuracy of quantitative prediction approaches. J Clin Pharmacol. 2009;49:513–33. doi:10.1177/0091270009333209. PMID:19299532.
- Tang H, Hussain A, Leal M, Mayersohn M, Fluhler E. Interspecies prediction of human drug clearance based on scaling data from one or two animal species. Drug metabolism and disposition: The biological fate of chemicals. 2007;35:1886–93. doi:10.1124/dmd.107.016188. PMID:17646280.
- Russell WMSB RL. The principles of humane experimental technique. London: Methuen; 1959.
- Beal S SL, Boeckmann A, Bauer RJ. NONMEM user's guides. Ellicott City (MD, USA): ICON Development Solutions; 1989–2009.
- Lindbom L, Pihlgren P, Jonsson EN. PsN-Toolkit–a collection of computer intensive statistical methods for non-linear mixed effect modeling using NONMEM. Comput Methods Programs Biomed. 2005;79:241–57. doi:10.1016/j.cmpb.2005.04.005. PMID:16023764.