
ABSTRACT
The characterization of glycosylation is required for many protein therapeutics. The emergence of antibody and antibody-like molecules with multiple glycan attachment sites has rendered glycan analysis increasingly more complicated. Reliance on site-specific glycopeptide analysis is therefore necessary to fully analyze multi-glycosylated biotherapeutics. Established glycopeptide methodologies have generally utilized a priori knowledge of the glycosylation states of the investigated protein(s), database searching of results generated from data-dependent liquid chromatography–tandem mass spectrometry workflows, and extracted ion quantitation of the individual identified species. However, the inherent complexity of glycosylation makes predicting all glycoforms on all glycosylation sites extremely challenging, if not impossible. That is, only the “knowns” are assessed. Here, we describe an agnostic methodology to qualitatively and quantitatively assess both “known” and “unknown” site-specific glycosylation for biotherapeutics that contain multiple glycosylation sites. The workflow uses data-independent, all ion fragmentation to generate glycan oxonium ions, which are then extracted across the entirety of the chromatographic timeline to produce a glycan-specific “fingerprint” of the glycoprotein sample. We utilized both HexNAc and sialic acid oxonium ion profiles to quickly assess the presence of Fab glycosylation in a therapeutic monoclonal antibody, as well as for high-throughput comparisons of multi-glycosylated protein drugs derived from different clones to a reference product. An automated method was created to rapidly assess oxonium profiles between samples, and to provide a quantitative assessment of similarity.
Introduction
Protein glycosylation plays an important role in a variety of cellular functions, and most protein-based biotherapeutics contain sites along the protein backbone where heterogeneous glycan moieties reside.Citation1,Citation2 Modulation of effector functions via Fc glycosylation has been shown to affect target cell killing mechanisms such as antibody-dependent cell-mediated cytotoxicity and complement-dependent cytotoxicity.Citation3–Citation5 Therefore, since glycosylation is a determinant of function and efficacy for therapeutic proteins, it is imperative to fully characterize all glycoforms and glycosylation sites during drug development.
Monoclonal antibodies are the most commonly prescribed biotherapeutic agents, and usually contain only one N-glycosylation site on the Fc domain of the protein. Therefore, reducing end modification of enzymatically released N-glycans, followed by high performance liquid chromatography (HPLC) remains a popular technique for glycan characterization. Many important classes of biologics, however, contain multiple sites of both N- and O-linked glycosylation.Citation6–Citation9 For example, many of the marketed Fc-fusion proteins contain five or more glycosylation sites.Citation6–Citation10 By solely characterizing these complex molecules by glycan release-based methods, all glycans from different sites become pooled together, thus information on glycosylation site-specificity is lost. Furthermore, O-glycans still prove to be difficult to remove from the protein by both enzymatic and chemical procedures.Citation11–Citation13 The most common methodology for characterizing proteins with multiple glycosylation sites is therefore by liquid chromatography–tandem mass spectrometry (LC-MS/MS) of protease-generated glycopeptides. Glycosylated species are then identified from masses that correspond to prior known glycopeptides or by searching fragmentation data (MS/MS spectra) against a database containing known peptide and glycan sequences. While these experimental workflows can work well for tailored experiments, complete characterization of all glycoforms and glycosylation sites is extremely challenging since it is currently impossible to predict all glycosylated species, and insufficient fragmentation patterns of glycopeptides hinders direct identification from MS/MS spectra.
Advances in glycopeptide identification have certainly been made through the utilization of alternative MS/MS techniques such as electron transfer dissociation (ETD)Citation14–Citation17 and ultraviolet photodissociation (UVPD)Citation18,Citation19 to improve the fragmentation information generated through MS/MS. Furthermore, data-independent analysis (DIA) of glycopeptides has recently been applied to glycopeptide analysis to circumvent the traditional reliance on data-dependent acquisition (DDA) of LC-MS/MS data,Citation20–Citation22 which relies on peak picking of the most abundant species from the MS1 spectra to initiate MS/MS, a process that can yield incomplete site-specific characterization. DIA techniques fragment all precursor ions in a specified m/z range, resulting in a potentially more complete and reproducible data procurement. Quantitation of the glycopeptides (identified by any MS means) is generally performed by ion extraction of individual glycosylated species from the MS1 or MS/MS data.
Targeting of low-mass, glycan-specific oxonium ions generated by various MS/MS techniques is an especially useful technique for deciphering glycopeptides from non-glycosylated species. These ions have been utilized in numerous advantageous approaches to qualitatively and quantitatively assess site-specific glycosylation.Citation16,Citation17,Citation23–Citation28 However, oxonium ions have yet to be exploited to create agnostic profiles for high-throughput glycopeptide screening of multi-glycosylated therapeutics. Even with the substantial advancements made in glycoprotein analysis, it still remains difficult to unambiguously assign all potential sites of glycosylation and their associated glycans for complicated multi-glycosylated proteins. Therefore, only the known glycoforms and glycosylation sites are assessed during biotherapeutic characterization, which could be a potentially problematic analytical strategy, especially when developing drugs such as biosimilars. Traditional glycopeptide analysis, furthermore, is often labor intensive, requiring a substantial time commitment from an expert analyst(s).
In this study, we describe methodology capable of significantly enhancing comparisons of site-specific glycosylation profiles between multi-glycosylated biotherapeutics, especially for glycopeptides that prove difficult to predict or identify by traditional means. In this technique, glycosylated biotherapeutics are first protease digested into a mixture of peptides and glycopeptides, and are subsequently analyzed by LC-MS/MS. All ion fragmentation (AIF) DIA is incorporated into the MS workflow to generate glycan-specific oxonium ions that are extracted with high mass accuracy across the entirety of the chromatographic separation from the resulting mass spectra. These oxonium ion profiles are generated by separately extracting HexNAc and sialic acid oxonium ions, and an automated algorithm was created to rapidly quantify dissimilarity between profiles of a diverse array of multi-glycosylated antibody and antibody-like therapeutic proteins.
Results
Overview of oxonium ion profiling
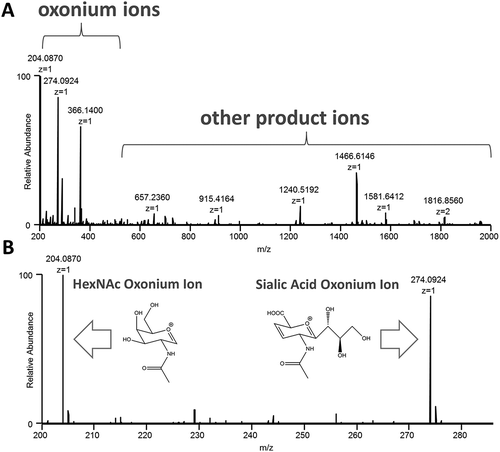
Higher-energy collisional dissociation (HCD) of glycopeptides generates several diagnostic low-mass oxonium ions that can be used for both identification and relative quantification of glycosylated species. The typical oxonium ions observed include: HexNAc internal fragment (m/z 138), Hex (m/z 163), HexNAc (m/z 204), sialic acid–H2O (m/z 274), sialic acid (m/z 292), Hex + HexNAc (m/z 366), (among others). The HexNAc (m/z 204) ion is universal to all glycopeptides, and is produced at high abundance under elevated HCD conditions. The sialic acid–H2O (m/z 274) ion is also produced with high abundance, and represents a particularly important acidic sugar that has been shown to alter the anti-inflammatory properties of therapeutic proteins.Citation29,Citation30 Therefore, these two ion species were employed to create the oxonium ion profiles used for biotherapeutic comparisons herein. An example mass spectrum and a zoomed-in version with illustrated structures of the HexNAc and sialic acid ions can be seen in .
Figure 1. Oxonium ions are generated after data-independent, all ion fragmentation (AIF) of glycopeptides during LC-MS/MS analysis, and are extracted from the MS/MS data to create profiles for comparing samples. An example mass spectrum (A.) and a zoomed-in version (B.) with illustrated structures of the HexNAc and sialic acid ions are shown.
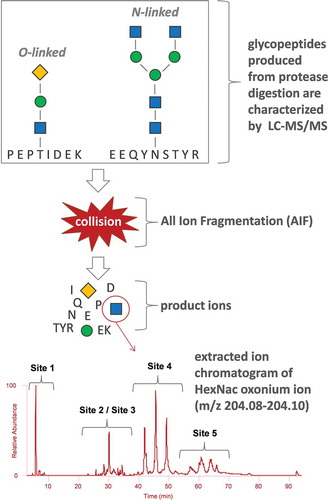
The general workflow for oxonium ion profiling can be seen in . Glycosylated samples were first digested with trypsin into a mixture of glycosylated and unglycosylated peptides, which were subsequently analyzed by LC-MS/MS. It is worth noting that other enzymes, such as chymotrypsin and AspN, can also be employed for generating glycopeptides, depending on the desired level of experimental rigor. However, trypsin alone is often adequate for producing peptides with acceptable sizes at all glycosylation sites. Reversed-phase chromatography was then utilized for separating the various peptide species, and therefore specific glycosylation locations could largely be distinguished since hydrophobic interactions of the peptide moiety with the stationary phase will be most responsible for glycopeptide separations. The mass spectrometer was set to accommodate both AIF DIA as well as conventional DDA scan events into a single LC-MS/MS run for optimal sample characterization efficiency; the time contribution of one DIA scan event per cycle of a typical “top-N” DDA experiment is quite low. To produce the oxonium ion profiles, the glycan-specific oxonium ions were extracted across the entirety of the chromatographic separation from the resulting DIA mass spectra. The mass accuracy tolerance for ion extraction was ± 0.01 Da for the experiments herein, and proved to be sufficiently specific for the targeted oxonium ions as no obvious interferences were observed.
Figure 2. Experimental workflow of the oxonium ion profiling methodology. The spectrum at the bottom of the figure shows the extracted HexNAc oxonium fingerprint; however; other glycan oxonium ions can also be extracted such as that for sialic acid. The blue squares, green circles, and yellow diamonds represent HexNAc, Hex, and sialic acid sugars, respectively.
Rapid identification of fab glycosylation
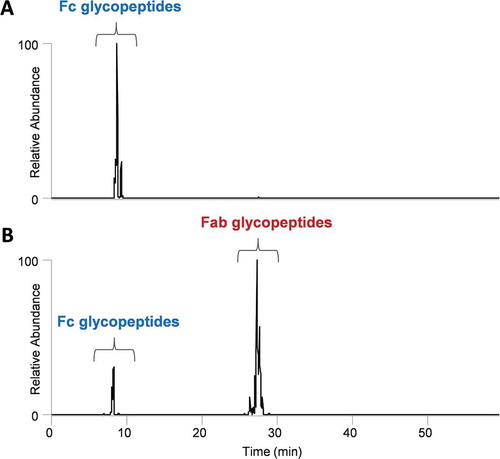
In a straightforward and direct application of the proposed methodology, the oxonium ion technique was utilized to rapidly detect the presence or absence of Fab glycosylation, as seen in . The HexNAc oxonium fingerprint of mAb1 in illustrates that only one site of glycosylation is present, which elutes at the same retention time as the conserved Fc N-linked glycopeptides. In contrast, shows two distinct retention time regions with clustered glycopeptide species for mAb2, and highlights the method’s ability to quickly screen for less predictable glycosylated species. Since Fc glycopeptides elute at a distinct retention time that is common across antibody species, no standards are necessary for rapid screening of Fab glycosylation to inform decision making for biotherapeutic development. A more exhaustive and retention-time targeted database searching procedure was then initiated on the accompanying DDA spectra, revealing that indeed, the detected glycopeptides were from the Fab region (data not shown). In this example, both protein sequences of mAb1 and mAb2 were known; however, for biotherapeutics with less clear Fab sequences and more potential sites of glycosylation, the use of database searching often becomes significantly less effective.
Figure 3. Rapid identification of Fab glycosylation in mAbs by HexNAc oxonium ion profiling. mAb1 (A.) only has Fc glycosylation; however, mAb2 has both Fc and Fab glycosylation. The proposed methodology can be utilized to assess the presence or absence of site-specific glycosylation.
High-throughput clone comparisons of multi-glycosylated biotherapeutics
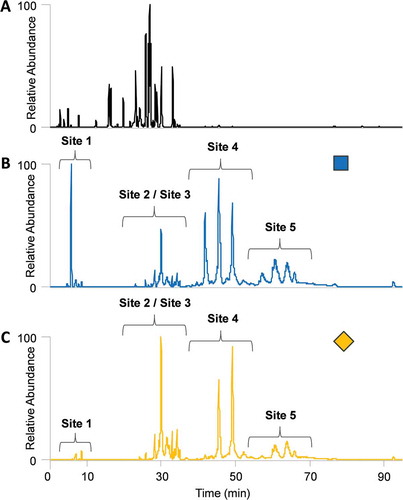
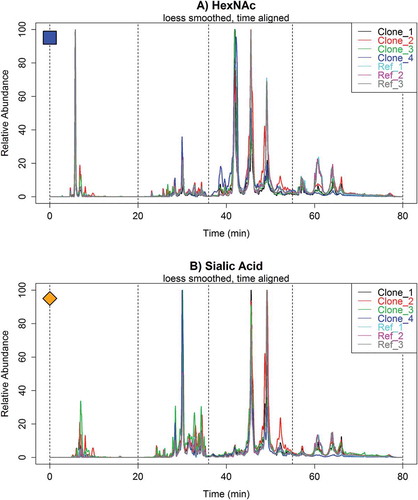
The next application of the oxonium ion profiling method was for high-throughput screening of various clones to multiple replicates of an established Fc-Fusion1 reference, a multi-glycosylated biologic (~ 100 kDa) with three N-linked and two O-linked glycosylation sites. Four different clones, “Clone_1”, “Clone_2”, “Clone_3”, and “Clone_4”, and three replicate reference samples, “Ref_1”, Ref_2”, and “Ref_3”, were assessed in this and subsequent sections. , , and highlight the differences between the base peak chromatogram, HexNAc oxonium ion profile, and sialic acid oxonium ion profile, respectively, of an example Fc-Fusion1 reference sample. The base peak chromatogram (MS1) and oxonium fingerprints were extracted from the same trypsin digestion and LC-MS/MS run. Fc-Fusion1 has five major glycosylation sites, and therefore a significant portion of the protein sequence is decorated with glycoforms. The base peak chromatogram, however, was still dramatically different than both oxonium ion profiles since unglycosylated peptides will usually ionize considerably better than the glycopeptides. Furthermore, each site of glycosylation will be made up of many glycoforms, thus dividing the glycopeptide signal. The HexNAc and sialic acid oxonium profiles show four distinct areas where the different glycosylation sites elute. It is worth noting that glycosylation sites 2 and 3 elute in the same general region due to their close sequence proximity, which yields glycopeptides containing both sites. Obvious differences were observed between the two oxonium profiles. As expected, the sialic acid fingerprint has fewer peaks since not all glycoforms will contain sialic acid, yet it also has a different signal distribution between sites compared to the HexNAc profile (e.g., site 1 is lower). Matching both oxonium profiles would be ideal when assessing the similarity between samples.
Figure 4. Comparison of the (A.) base peak chromatogram, (B.) HexNAc oxonium ion profile, and (C.) sialic acid oxonium ion profile of an Fc-Fusion1 reference sample. The blue square and yellow diamond represent HexNAc and sialic acid oxonium ions, respectively.
An important aspect of the oxonium ion profiling technique is its ability to potentially detect unknown/unpredicted glycosylated species. To compare to the oxonium profiling methodology, the Fc-Fusion1 clone and reference samples were analyzed by conventional targeted analysis of previously identified glycopeptides and by a database searching strategy that identifies glycopeptides using Byonic.Citation31,Citation32 Figure S1 shows the relative quantitation of the most abundant glycoforms at each glycosylation site. , conversely, displays the expanded, site-specific HexNAc oxonium ion profile comparisons of the site 1 glycopeptides for a Fc-Fusion1 reference, Clone_2, and Clone_4. The known glycoforms that were identified are labeled in the top profile. Interestingly, unknown glycopeptide species were detected in Clone_2 that were not detected by either conventional analysis or by glycopeptide database searching (data not shown). The unknown glycopeptides could be from glycosylation at an unexpected protein site, unpredictable protein modification, or from a glycopeptide containing an unusual glycan; importantly, these species were not observed with sufficient abundance in the reference sample. On the other hand, the HexNAc oxonium ion profile of Clone_4 exhibits obvious similarity to the reference protein. The two clones, Clone_2 and Clone_4, interestingly showed relatively similar glycopeptide abundance percentages for site 1 when assessed by the conventional targeted method (see Figure S1).
Figure 5. Site-specific HexNAc oxonium ion chromatograms of glycopeptide site 1 for (A.) Fc-Fusion1 reference, (B.) Clone_2, and (C.) Clone_4.Unknown glycopeptide species were detected in Clone_2 that were not detected by conventional analysis. Conversely, the Fc-Fusion1 reference and Clone_4 have similar oxonium profiles. Glycan nomenclature was as follows: HexNAc(#)Hex(#)Fuc(#)NeuAc(#)NeuGc(#).
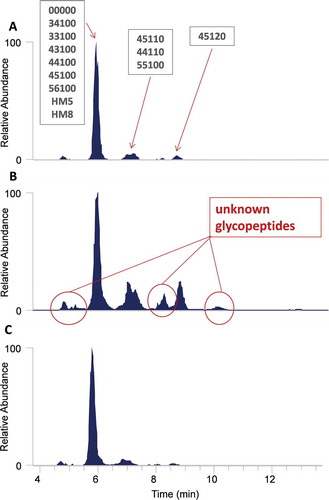
Figure S2 illustrates another site-specific oxonium ion profile comparison for Fc-Fusion1 reference, Clone_4, and Clone_2. In this example, site 4 was assessed. Unknown glycopeptide species were again detected, but this time for Clone_4, whereas Clone_2 was highly similar to the reference protein. The conventional targeted method was developed using the reference protein (a typical strategy), and therefore the non-fucosylated glycopeptides circled in red were not targeted in the clone screening. These species were detected by Byonic database searching, and were observed discernibly in the oxonium ion profile. In this example, Clone_4 had several glycoforms that were substantially different from the reference sample, as well as Clone_2 by conventional targeted analysis (Figure S1), a result that agrees well with the HexNAc fingerprints. Both site-specific examples highlight the power of the oxonium ion profiling technique, and the ability of the method to make meaningful comparisons between samples. The examples also illustrate the challenge of matching all glycosylation sites to a reference protein since certain clones will be more similar at some sites, but more dissimilar at others. Therefore, it is critical to have methodology that can better detect and quantify all potential differences.
Automated similarity assessment from oxonium ion profiles
While visually assessing the oxonium profiles may be sufficient for some applications, a rapid and automated assessment of profile similarity between numerous samples will often be warranted. Thus, we created an algorithm that quantifies the differences of each section of the oxonium profile between samples. All data is directly input into the program, smoothed via locally weighted smoothing (LOESS) and parametric time warped to eliminate retention time discrepancies between samples. Differences in ion abundances at every second are calculated between a set of profiles. illustrates the overlaid HexNAc and sialic acid oxonium ion chromatograms of all Fc-Fusion1 reference and clone samples after LOESS smoothing and parametric time warping. The corresponding unprocessed profiles can be found in Figure S3. Selection of the LOESS smoothing parameters by cross-validation is illustrated in Figures S4 and S5, and the parametric time warping effect on HexNAc and sialic acid profiles is illustrated in Figures S6 and S7, respectively.
Figure 6. Overlaid (A.) HexNAc and (B.) sialic acid oxonium ion profiles of multiple Fc-Fusion1 reference and clone samples with LOESS smoothing and parametric time warping. The spectra illustrate significant differences in glycopeptide profiles between samples. All chromatograms were normalized to the maximum ion intensity.
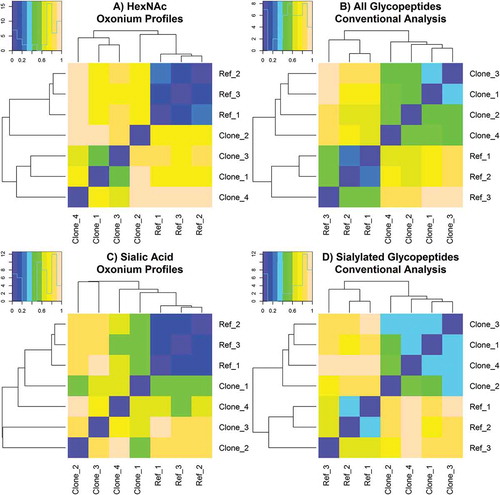
The overall glycopeptide similarity assessment is shown in , indicating significant variations in oxonium fingerprints across samples. To compare between methods, a global difference value was calculated from the conventional targeted results (Figure S1) by summing all relative abundance differences for each glycoform at every glycosylation site. Only the sialylated species were used to calculate the differences shown in . For all heat maps, pairs of samples that were the most similar have increasingly purple colors, while those that were the most dissimilar were increasingly peach colored. Replicates of the references (Ref_1, Ref_2, and Ref_3) were shown to be highly similar for the oxonium ion profiles, illustrating a suitable degree of method reproducibility. Conversely, each clone had varying degrees of resemblance to the reference Fc-Fusion1; interestingly, clones that were more similar to reference samples for the HexNAc profiles were often more dissimilar for the sialic acid profiles (comparing to 7C). The similarity assessment of the conventional targeted data exhibited noticeably less discriminating power between the samples as compared to the oxonium profiles (e.g., conventional analysis yielded reference samples less similar to each other and more similar to the clones). The trends in similarity between the two methods were in agreement for some pair-wise comparisons, and in disagreement for others. For example, Clone_1 and Clone_3 were shown to be highly similar for each method; however, Clone_1 and Clone_4 were dissimilar by HexNAc oxonium profiling and similar by conventional analysis. A high degree of agreement across all analyses would be ideal to verify that an investigated sample is truly interchangeable with the reference protein.
Figure 7. Automated similarity assessment of Fc-Fusion1 reference and clone samples calculated from (A.) processed HexNAc oxonium ion profiles, (B.) conventional analysis of all known and detected glycopeptides, (C.) processed sialic acid oxonium ion profiles, and (D.) conventional analysis of all known and detected sialic acid-containing glycopeptides. Samples with the most similarity and dissimilarity are purple colored and peach colored, respectively.
As a final assessment of the oxonium ion profiling method, the automated assessment tool was applied to quantify dissimilarity between samples site-specifically. That is, the HexNAc and sialic acid profiles were divided into sections that represent the various glycosylation sites, and were applied to calculate the differences between the Fc-Fusion1 reference and clone samples. The results can be seen in Figure S8. While significantly more complicated than the global profile comparisons illustrated in , these comparisons provide a higher level of resolution for glycopeptide differentiation. For example, the site-specific automated assessment in Figure S8 confirms that Clone_4 was more similar to the references as compared to Clone_2 for the site 1 HexNAc oxonium ion profiles, and that the opposite was true for site 4, a trend that was previously seen qualitatively in and Figure S2. LOESS smoothed and time warped oxonium ion profiles zoomed-in for each glycosylation site can be seen in Figure S9 and S10 (HexNAc and sialic acid, respectively).
Discussion
N-linked Fc glycosylation is well conserved across IgG subclasses; therefore, glycopeptide identification at this site is fairly straightforward. Fab glycosylation characterization, conversely, is not as clear-cut–there are numerous amino acid combinations that can be present in the Fab variable region. For example, it would be impossible to predict all the Fab site-specific glycosylation in intravenous immunoglobulin (IVIG) since the IgGs are pooled from thousands of plasma donors.Citation33 It is also hard to foresee how a given expression system affects Fab glycosylation of recombinantly produced antibody and antibody-like therapeutics. The importance of this type of glycosylation is underscored by its ability to modulate IgG antigen binding and affect the anti-inflammatory properties of IVIG.Citation34 Another challenging type of glycosylation present in a variety of immunoglobulins, O-glycosylation,Citation35 is especially hard to predict because a consensus amino acid sequence motif has not been identified. Therefore, new methods that can better characterize the presence of these challenging glycosylation varieties are warranted.
The oxonium ion profiling technique presented herein provided a high degree of differentiating power for multi-glycosylated biotherapeutics. The conceivable benefits of this agnostic methodology include: 1) all precursor ions are fragmented collectively by DIA; therefore, peak picking inconsistencies and high ion abundance bias are a non-issue, 2) a priori assumptions about the presence of specific glycosylated species are not required, which better ensures that unknown glycopeptides contribute signal to the overall measurement of similarity, and 3) profile similarity can be quickly and directly assessed between samples (e.g., a reference protein compared to a biosimilar). That is, while it may be impossible to unambiguously predict or identify all glycopeptides in a given sample, the unknown glycosylated species can at least be specifically and reproducibly quantified between samples. We utilized this data-independent technique to rapidly compare HexNAc and sialic acid oxonium ion profiles between various monoclonal antibody and Fc-fusion protein samples. An automated similarity assessment algorithm was developed to quantitatively evaluate pair-wise sample comparisons both globally and site-specifically. In its entirety, the automated similarity assessment results illustrated the utility of using both HexNAc and sialic acid oxonium ion profiles (global and site-specifically), as well as targeted conventional analysis when the most comprehensive comparison between samples is warranted. Being that the AIF DIA scans to generate the oxonium ion profiles can be added directly to conventional DDA analyses, and that the results can be quantitated automatically, the additional time commitment to produce these fingerprint comparisons is quite low.
Furthermore, since the differentiation of specific glycosylated species is highly dependent on glycopeptide separation, the oxonium profiling methodology could further be advanced by utilizing more sophisticated HPLC methods. Techniques such as mixed-modeCitation36 or two-dimensionalCitation37,Citation38 chromatography could be directly coupled to the oxonium profiling workflow to facilitate even higher resolution characterization of complex therapeutic proteins.
Materials and methods
Materials
Fc-Fusion1, mAb1, and mAb2 are therapeutic proteins that were produced recombinantly using a variety of expression systems and conditions. Trypsin Gold was procured from Promega (Madison, WI), and all lab supplies were purchased from Fisher Scientific (Pittsburg, PA).
Sample preparation
Biotherapeutic aliquots (100 µg) were diluted to 1 mg/mL with 6 M guanidine HCL in 20 mM sodium phosphate, 100 mM sodium chloride, pH 7.0, and denatured for 30 minutes at 37ºC. Disulfide reduction was performed by adding 5 mM dithiothreitol, and incubating for 80 minutes at 37ºC. Proteins were then alkylated with 12 mM N-ethylmaleimide for two hours in the dark at room temperature. Using Amicon 10 k spin filters (EMD Millipore, Billerica, MA), samples were buffer exchanged into 50 mM ammonium bicarbonate, and digested with 5 µg of trypsin (1:20 enzyme to substrate ratio) for 19 hours at 37°C. Protease reactions were quenched with 2.5% formic acid.
LC-MS/MS
Tryptic peptides (4 µg) were injected onto a 2.1 × 50 mm (1.7 µm particle size) AQUITY BEH C18 column (Waters, Milford, MA) heated at 50ºC using a Dionex Ultimate 3000 RSLCnano (Santa Clara, CA) system. Eluent A and B were 0.1% formic acid in water and 0.1% formic acid in acetonitrile, respectively. Gradient elution was performed at a flow rate of 50 μL/min as follows: linear gradient of 3% eluent B at zero minutes, 7% eluent B at 3 minutes, 13% eluent B at 20 minutes, 28% eluent B at 40 minutes, 35% eluent B at 60 minutes, 50% eluent B at 70 minutes, 80% eluent B from 80 to 90 minutes, and 3% eluent B from 92 to 110 minutes.
The LC system was coupled to a Thermo Scientific Q Exactive (Bremen, Germany) for mass spectrometric analysis. The instrument was operated to accommodate both data-independent and data-dependent acquisitions in a single run. DDA was performed as follows: MS1 events were comprised of the positive mass scan at a range of 400–2000 m/z followed by one HCD event at 25% normalized collision energy (NCE) on the most abundant ion from the first event. Dynamic exclusion duration was 20 s with a single repeat count, and charged species ≥ 7 were excluded. DIA was performed using AIF at a range of 200–2000 m/z, and a NCE of 35%. The time needed to get through one cycle of MS1, HCD, and AIF events was approximately one second. The electrospray ionization voltage was set to 3.32 kV, capillary temperature was 250ºC, sheath gas was 15, and the S-Lens RF level was set to 50 for all analyses. Resolution was 35,000 for MS1 scans, and 17,500 for DDA MS/MS and DIA AIF scans. AGC was set to 1E6 with a maximum injection time of 250 ms for both MS1 and DIA AIF, and AGC was 2E5 with a maximum injection time of 80 ms for DDA MS/MS. An isolation window of 4 m/z was used for DDA MS/MS scans. MS1, DIA AIF, and DDA MS/MS spectra were produced from 5, 3, and 1 microscans, respectively.
Data analysis
HexNAc and sialic acid oxonium ion profiles were generated by extracting the m/z range of 204.08–204.10 and 274.08–274.10, respectively, across the entire data-independent acquisition for each sample.
Conventional targeted glycopeptide analysis was performed by mining LC-MS/MS files of the most abundant known glycoforms and glycosylation sites. Skyline (version 3.5.0.9320) was used to create extracted ion chromatograms (XICs) of each individual species. Results were then reported as a relative abundance percentage for each individual glycosylation site.
Database searching analysis was performed using Byonic,Citation31,Citation32 similarly as previously described.Citation39 In short, LC-MS/MS files were searched against a protein database composed of the protein of interest. Trypsin was used as the enzyme with up to two allowable missed cleavages. Mass tolerances of 10 ppm and 0.02 Da were used for MS1 and MS/MS spectra, respectively. N-Ethylmaleimide of cysteine was set as a fixed modification for the searches, and glycan databases consisting of 118 N-glycans and 6 O-glycans were used by Byonic for identifying glycopeptides.
The automated similarity assessment tool was created in the R programming language.Citation40 Thermo .RAW files were converted to MGF format and loaded into R using MSnbase library,Citation41 and extracted ion chromatograms of m/z 204.08–204.10 and 274.08–274.10 were generated from the data-independent scans. The resulting oxonium ion profiles were then smoothed by LOESSCitation42 and adjusted for differences in retention time by parametric time warping.Citation43,Citation44 The dissimilarities between each pair of samples were calculated as the sum of the absolute differences between resulting oxonium ion relative abundances from 0–80 minutes. For the site-specific calculations, the sample dissimilarities were calculated over time intervals of 0–20 minutes (glycopeptide site 1), 20–36 minutes (glycopeptide site 2/3), 36–55 minutes (glycopeptide site 4), and 55–80 minutes (glycopeptide site 5). Heat maps were generated from the 2-way comparison of all Fc-Fusion1 samples, and were clustered using average linkage. For direct comparisons to the oxonium ion profiling results, sample dissimilarities from conventional targeted analysis were calculated as sums of absolute differences between relative abundances (normalized to the highest area count) for each individual glycopeptide. Additional computational details and R session information can be found in Supplemental Material.
Abbreviations
| AIF | = | all ion fragmentation |
| DDA | = | data-dependent acquisition |
| DIA | = | data-independent analysis |
| ETD | = | electron transfer dissociation |
| HCD | = | higher-energy collisional dissociation |
| HPLC | = | high performance liquid chromatography |
| IVIG | = | intravenous immunoglobulin |
| LC-MS/MS | = | liquid chromatography - tandem mass spectrometry |
| LOESS | = | locally weighted smoothing |
| NCE | = | normalized collision energy |
| UVPD | = | ultraviolet photodissociation |
Disclosure of Potential Conflicts of Interest
All authors are, or were, employees of Momenta Pharmaceuticals with stock compensation.
Supplemental Material
Download PDF (2.2 MB)Acknowledgments
We thank John Robblee (Momenta Pharmaceuticals) for helpful discussions concerning the methodology presented herein.
Supplementary material
Supplemental data for this article can be access on the publisher’s website.
References
- Moremen KW, Tiemeyer M, Nairn AV. Vertebrate protein glycosylation: diversity, synthesis and function. Nat Rev Mol Cell Biol. 2012;13:448–462. doi:10.1038/nrm3383.
- Spiro RG. Protein glycosylation: nature, distribution, enzymatic formation, and disease implications of glycopeptide bonds. Glycobiology. 2002;12:43R–56R.
- Jefferis R. Glycosylation as a strategy to improve antibody-based therapeutics. Nat Rev Drug Discov. 2009;8:226–234. doi:10.1038/nrd2804.
- Natsume A, Niwa R, Satoh M. Improving effector functions of antibodies for cancer treatment: enhancing ADCC and CDC. Drug Des Devel Ther. 2009;3:7–16.
- Kellner C, Derer S, Valerius T, Peipp M. Boosting ADCC and CDC activity by Fc engineering and evaluation of antibody effector functions. Methods. 2014;65:105–113. doi:10.1016/j.ymeth.2013.06.036.
- Zhu L, Guo Q, Guo H, Liu T, Zheng Y, Gu P, Chen X, Wang H, Hou S, Guo Y. Versatile characterization of glycosylation modification in CTLA4-Ig fusion proteins by liquid chromatography-mass spectrometry. MAbs. 2014;6:1474–1485. doi:10.4161/mabs.36313.
- Houel S, Hilliard M, Yu YQ, McLoughlin N, Martin SM, Rudd PM, Williams JP, Chen W. N-and O-glycosylation analysis of etanercept using liquid chromatography and quadrupole time-of-flight mass spectrometry equipped with electron-transfer dissociation functionality. Anal Chem. 2013;86:576–584. doi:10.1021/ac402726h.
- Larsen CP, Pearson TC, Adams AB, Tso P, Shirasugi N, Strobert E, Anderson D, Cowan S, Price K, Naemura J, et al. Rational development of LEA29Y (belatacept), a high‐affinity variant of CTLA4‐Ig with potent immunosuppressive properties. Am J Transplant. 2005;5:443–453. doi:10.1111/j.1600-6143.2005.00749.x.
- Balaratnasingam C, Dhrami-Gavazi E, McCann JT, Ghadiali Q, Freund KB. Aflibercept: a review of its use in the treatment of choroidal neovascularization due to age-related macular degeneration. Clin Ophthalmol. 2015;9:2355.
- Berry JD. Introduction to Therapeutic Fc‐Fusion Proteins. Therapeutic Fc-Fusion Proteins. Wiley-VCH Verlag GmbH & Co. KGaA; 2013. p. 217–232.
- Takahashi K, Wall SB, Suzuki H, Smith AD, Hall S, Poulsen K, Kilian M, Mobley JA, Julian BA, Mestecky J Clustered O-glycans of IgA1: defining macro- and microheterogeneity by use of electron capture/transfer dissociation. Mol Cell Proteomics. 2010;9:2545–2557. doi:10.1074/mcp.M110.001834.
- Wada Y, Dell A, Haslam SM, Tissot B, Canis K, Azadi P, Bäckström M, Costello CE, Hansson GC, Hiki Y, et al. Comparison of methods for profiling o-glycosylation human proteome organisation human disease glycomics/proteome initiative multi-institutional study of iga1. Mol Cell Proteomics. 2010;9:719–727. doi:10.1074/mcp.M900450-MCP200.
- Christiansen MN, Kolarich D, Nevalainen H, Packer NH, Jensen PH. Challenges of determining O-glycopeptide heterogeneity: a fungal glucanase model system. Anal Chem. 2010;82:3500–3509. doi:10.1021/ac901717n.
- Desaire H. Glycopeptide analysis, recent developments and applications. Mol Cell Proteomics. 2013;12:893–901. doi:10.1074/mcp.R112.026567.
- Mechref Y. Use of CID/ETD mass spectrometry to analyze glycopeptides. Curr Protoc Protein Sci. 2012;12(1):1–11.
- Saba J, Dutta S, Hemenway E, Viner R. Increasing the productivity of glycopeptides analysis by using higher-energy collision dissociation-accurate mass-product-dependent electron transfer dissociation. Int J Proteomics. 2012;2012:1–7. doi:10.1155/2012/560391.
- Singh C, Zampronio CG, Creese AJ, Cooper HJ. Higher energy collision dissociation (HCD) product ion-triggered Electron Transfer Dissociation (ETD) mass spectrometry for the analysis of N-linked glycoproteins. J Proteome Res. 2012;11:4517–4525. doi:10.1021/pr300257c.
- Zhang L, Reilly JP. Extracting both peptide sequence and glycan structural information by 157 nm photodissociation of N-linked glycopeptides. J Proteome Res. 2008;8:734–742. doi:10.1021/pr800766f.
- Madsen JA, Ko BJ, Xu H, Iwashkiw JA, Robotham SA, Shaw JB, Feldman MF, Brodbelt JS. Concurrent automated sequencing of the glycan and peptide portions of O-linked glycopeptide anions by ultraviolet photodissociation mass spectrometry. Anal Chem. 2013;85:9253–9261. doi:10.1021/ac4021177.
- Sanda M, Goldman R. Data independent analysis of IgG glycoforms in samples of unfractionated human plasma. Anal Chem. 2016;88:10118–10125. doi:10.1021/acs.analchem.6b02554.
- Sanda M, Zhang L, Edwards NJ, Goldman R. Site-specific analysis of changes in the glycosylation of proteins in liver cirrhosis using data-independent workflow with soft fragmentation. Anal Bioanal Chem. 2017;409:619–627. doi:10.1007/s00216-016-0041-8.
- Pan K-T, Chen -C-C, Urlaub H, Khoo K-H. Adapting data-independent acquisition for mass spectrometry-based protein site-specific N-glycosylation analysis. Anal Chem. 2017;89:4532–4539. doi:10.1021/acs.analchem.6b04996.
- Cao L, Tolić N, Qu Y, Meng D, Zhao R, Zhang Q, Moore RJ, Zink EM, Lipton MS, Paša-Tolić L, et al. Characterization of intact N-and O-linked glycopeptides using higher energy collisional dissociation. Anal Biochem. 2014;452:96–102. doi:10.1016/j.ab.2014.01.003.
- Toyama A, Nakagawa H, Matsuda K, Sato T-A, Nakamura Y, Ueda K. Quantitative structural characterization of local N-glycan microheterogeneity in therapeutic antibodies by energy-resolved oxonium ion monitoring. Anal Chem. 2012;84:9655–9662. doi:10.1021/ac3023372.
- Song E, Pyreddy S, Mechref Y. Quantification of glycopeptides by multiple reaction monitoring liquid chromatography/tandem mass spectrometry. Rapid Commun Mass Spectrom. 2012;26:1941–1954. doi:10.1002/rcm.6290.
- Hart-Smith G, Raftery MJ. Detection and characterization of low abundance glycopeptides via higher-energy C-trap dissociation and orbitrap mass analysis. J Am Soc Mass Spectrom. 2012;23:124–140. doi:10.1007/s13361-011-0273-y.
- Halim A, Westerlind U, Pett C, Schorlemer M, Rüetschi U, Brinkmalm G, Sihlbom C, Lengqvist J, Larson G, Nilsson J. Assignment of saccharide identities through analysis of oxonium ion fragmentation profiles in LC–MS/MS of glycopeptides. J Proteome Res. 2014;13:6024–6032. doi:10.1021/pr500898r.
- Nasir W, Toledo AG, Noborn F, Nilsson J, Wang M, Bandeira N, Larson G. SweetNET: A bioinformatics workflow for glycopeptide MS/MS spectral analysis. J Proteome Res. 2016;15:2826–2840. doi:10.1021/acs.jproteome.6b00417.
- Czajkowsky DM, Hu J, Shao Z, Pleass RJ. Fc‐fusion proteins: new developments and future perspectives. EMBO Mol Med. 2012;4:1015–1028. doi:10.1002/emmm.201201379.
- Washburn N, Schwab I, Ortiz D, Bhatnagar N, Lansing JC, Medeiros A, Tyler S, Mekala D, Cochran E, Sarvaiya H, et al. Controlled tetra-Fc sialylation of IVIg results in a drug candidate with consistent enhanced anti-inflammatory activity. Proc Natl Acad Sci. 2015;112:E1297–E306. doi:10.1073/pnas.1422481112.
- Bern M, Cai Y, Goldberg D. Lookup peaks: a hybrid of de novo sequencing and database search for protein identification by tandem mass spectrometry. Anal Chem. 2007;79:1393–1400. doi:10.1021/ac0617013.
- Bern M, Kil YJ, Becker C. Byonic: advanced peptide and protein identification software. Curr Protoc Bioinformatics. 2012; 40:13.20.1&13.20.14..
- Bondt A, Rombouts Y, Selman MH, Hensbergen PJ, Reiding KR, Hazes JM, Dolhain RJ, Wuhrer M. Immunoglobulin G (IgG) Fab glycosylation analysis using a new mass spectrometric high-throughput profiling method reveals pregnancy-associated changes. Mol Cell Proteomics. 2014;13:3029–3039. doi:10.1074/mcp.M114.039537.
- van de Bovenkamp FS, Hafkenscheid L, Rispens T, Rombouts Y. The emerging importance of IgG Fab glycosylation in immunity. J Immunol. 2016;196:1435–1441. doi:10.4049/jimmunol.1502136.
- Plomp R, Dekkers G, Rombouts Y, Visser R, Koeleman CA, Kammeijer GS, Jansen BC, Rispens T, Hensbergen PJ, Vidarsson G, et al. Hinge-region O-glycosylation of human immunoglobulin G3 (IgG3). Mol Cell Proteomics. 2015;14:1373–1384. doi:10.1074/mcp.M114.047381.
- Gilar M, Yu Y-Q, Ahn J, Fournier J, Gebler JC. Mixed-mode chromatography for fractionation of peptides, phosphopeptides, and sialylated glycopeptides. J Chromatogr A. 2008;1191:162–170. doi:10.1016/j.chroma.2008.01.061.
- Dong Q, Yan X, Liang Y, Stein SE. In-depth characterization and spectral library building of glycopeptides in the tryptic digest of a monoclonal antibody using 1D and 2D LC–MS/MS. J Proteome Res. 2016;15:1472–1486. doi:10.1021/acs.jproteome.5b01046.
- Wang H, Wong CH, Chin A, Taguchi A, Taylor A, Hanash S, Sekiya S, Takahashi H, Murase M, Kajihara S, et al. Integrated mass spectrometry-based analysis of plasma glycoproteins and their glycan modifications. Nat Protoc. 2011;6:253–269. doi:10.1038/nprot.2010.176.
- Madsen JA, Yin Y, Qiao J, Gill V, Renganathan K, Fu WY, Smith S, Anderson J. Covalent labeling denaturation mass spectrometry for sensitive localized higher order structure comparisons. Anal Chem. 2016;88:2478–2488. doi:10.1021/acs.analchem.5b04736.
- R Core Team. R: A Language and Environment for Statistical Computing. 2014:http://www.R-project.org.
- Gatto L, Lilley KS. MSnbase–an R/Bioconductor package for isobaric tagged mass spectrometry data visualisation, processing and quantitation. Bioinformatics. 2011;28:btr645.
- Cleveland WS, Grosse E, Shyu WM. Local regression models. Stat Model S. 1992;2:309–376.
- Eilers PH. Parametric time warping. Anal Chem. 2004;76:404–411. doi:10.1021/ac034800e.
- Bloemberg TG, Gerretzen J, Wouters HJ, Gloerich J, van Dael M, Wessels HJ, van den Heuvel LP, Eilers PH, Buydens LM, Wehrens R. Improved parametric time warping for proteomics. Chemometr Intell Lab Syst. 2010;104:65–74. doi:10.1016/j.chemolab.2010.04.008.