
ABSTRACT
Ado-trastuzumab emtansine (Kadcyla®; T-DM1) is an antibody-drug conjugate developed to treat trastuzumab-resistant disease. Despite initial favorable outcomes, most patients eventually cease to respond due to developing acquired resistance to T-DM1. Currently, there is no targeted therapy to treat T-DM1-resistant disease. To explore novel therapeutic targets to improve therapeutic efficacy of T-DM1, we generated T-DM1-resistant cells using trastuzumab-resistant JIMT1 cells. We found that the loss of human epidermal growth factor receptor 2 confers T-DM1 resistance, which in turn activates a compensatory mechanism that increases epidermal growth factor receptor (EGFR) expression. Upregulation of EGFR increases the protein levels of α5β1 and αVβ3 integrins, resulting in enhanced motility and invasion of T-DM1-resistant cells. This study delineates previously unappreciated relationships between α5β1 and αVβ3 and suggests that specific integrins should be carefully selected as therapeutic targets to treat T-DM1-resistant disease. Specifically, silencing β1 integrin expression by siRNA in T-DM1-resistant cells destabilizes α5, but increases expression of αV, a critical integrin mediating the invasion and metastases in many different cancers. As a consequence, T-DM1-resistant cells gain metastatic potential and become more invasive. This finding is underscored by the fact that β1 integrin blockage induced by an inhibitory antibody, MAB 13, significantly increases invasion of T-DM1-resistant cells. However, the increased cell invasion induced by β1 integrin blockage can be significantly reduced by either EGFR inhibitor or specific siRNA against αV integrin. The discovery of functional cooperation between EGFR and αV integrin in regulating cell growth and invasion provides an opportunity to develop novel therapeutic strategy by dual-targeting EGFR and specific integrin to overcome T-DM1 resistance.
Introduction
Antibody-drug conjugates (ADCs) are one of the fastest growing classes of oncology therapeutics designed to improve therapeutic index by specifically delivering potent cytotoxic payload to tumor cells.Citation1 Ado-trastuzumab emtansine (Kadcyla®; T-DM1) is an ADC consisting of trastuzumab (Herceptin®), a HER2-targeting monoclonal antibody, and DM1, a microtubule inhibitor, which is conjugated to trastuzumab via a thioether linker.Citation2 T-DM1 has been approved by the US Food and Drug Administration for the treatment of human epidermal growth factor receptor 2 (HER2)-positive metastatic breast cancer patients who previously received trastuzumab and taxane, separately or in combination.Citation3 Upon binding to HER2 on cell surface, T-DM1-HER2 complex is internalized into the cell and the active catabolite, lysine-N(ε)-N-mal-eimidomethyl-cyclohexane-1-carboxylate (MCC)-DM1, is released into the cytosol of cancer cells.Citation4 Subsequently, the active agent blocks microtubule assembly to cause mitotic arrest leading to cell death.Citation4–Citation7 Despite initial favorable outcomes, most HER2-positive patients treated with T-DM1 eventually stop responding the treatment due to the development of acquired resistance.Citation8
Although the T-DM1-resistant mechanisms are not yet fully understood, preclinical studies suggest that resistance to T-DM1 occurs through multiple mechanisms, including reduced HER2 expression,Citation9 increased expression and activity of drug efflux proteins,Citation9,Citation10 increased neuregulin expression,Citation11 defective cyclin B1,Citation12 a reduction in lysosomal proteolytic activity,Citation13 and caveolin-1-dependent T-DM1 endocytosis.Citation14 However, it remains unclear whether T-DM1-resistant breast cancer cells gain invasive activity that potentially increases metastatic potential. Furthermore, understanding of the underlying molecular and cellular mechanisms of cancer progression of T-DM1-resistant diseases is of considerable importance for both clinical diagnosis and therapy. To the best of our knowledge, correlations of the T-DM1 resistance with increased cellular invasion have not yet been examined.
Integrins are the most predominant and well characterized cell surface receptors of extracellular matrix (ECM) molecules, such as fibronectin, laminin, and collagen, and are involved in metastatic processes of cancers.Citation15,Citation16 Integrin consists of heterodimers with 18 α and 8 β subunits, with each specific integrin heterodimer binding to a distinct ECM molecule. For instance, α5β1 and αVβ3 integrins recognize Arg-Gly-Asp (RGD) sequence contained in fibronectin, and therefore they are well-known as a fibronectin (or RGD) receptor.Citation17,Citation18
To understand the mechanisms of T-DM1 resistance and improve its therapeutic efficacy, we generated a T-DM1-resistant cell model using the HER2-positive breast carcinoma JIMT1 cell line and studied the cellular and molecular aspects of acquired resistance. We found that in T-DM1-resistant cells, HER2 expression is diminished, which confers T-DM1 resistance. Downregulation of HER2 leads to upregulation of epidermal growth factor receptor (EGFR), which may be caused by a compensatory mechanism.Citation19,Citation20 The increased EGFR signaling cooperates with RGD receptor, α5β1 and αVβ3, to increase cell invasion properties of T-DM1-resistant cells. Our data indicate that targeting both EGFR and RGD receptors could be a novel therapeutic approach to treat T-DM1-resistant breast cancers.
Results
Establishment of T-DM1-resistant cells
JIMT1 cells were derived from a HER2-positive breast cancer patient who was primarily resistant to trastuzumab.Citation21 To develop T-DM1-resistant cells, JIMT1 cells were exposed to escalated doses of T-DM1 as indicated in . After 2 months, cells became resistant to T-DM1 at the dose of 2.0 μg/ml. The dose of T-DM1 was then increased to 3.6–4.0 µg/ml. The cells were populated and maintained in the presence of 3.6–4.0 µg/ml T-DM1 for 3 months to establish T-DM1-resistant cells designated as T-DM1R (). It should be noted that T-DM1R cells were always maintained in the tissue culture media containing 3.6–4.0 µg/ml T-DM1. As shown in and , T-DM1R cells were able to grow in the presence of 3.6–4.0 µg/ml T-DM1 under both 10% () and 1% () of fetal bovine serum (FBS). We also examined colony formations using a soft agar assay. As shown in and , T-DM1R cells were capable of growing in soft agar and forming colonies (≥50 µm in diameter), although the number of colonies of T-DM1R cells are fewer than that of parental JIMT1 cells. Taken together, we concluded that T-DM1R cells acquired T-DM1 resistance and retained tumorigenic activities.
Figure 1. Establishment of T-DM1-resistant cells from JIMT1 cell line. (A) Procedures and the time line for developing and establishing T-DM1-resistant (T-DM1R) cells. (B) Cell growth files of T-DM1R and parental JIMT1 cells in 10% FBS-containing media with or without of T-DM1 4.0 μg/ml. (C) Cell growth files of T-DM1R and parental JIMT1 cells in 1% FBS-containing media with or without of T-DM1 4.0 μg/ml. (D) Soft agar assay in the presence of 10% FBS. Scale bar, 50 µm. (E) Quantification of soft agar assay. Colonies that were larger than 50 µm in diameter were counted. (F) Fluorescent immunostaining images showing polymerized microtubule and actin in T-DM1R cells, comparing with those in the parental cells in the absence/presence of 4 µg/ml T-DM1. Nucleus was stained with DAPI. Scale bar, 20 µm. (G) Fluorescent immunostaining images showing polymerized microtubule and separated chromosome in T-DM1R cells during cell mitosis, comparing with those in the parental cells in the absence/presence of 4 µg/ml T-DM1. Chromosome was stained with DAPI. Scale bar, 10 µm.
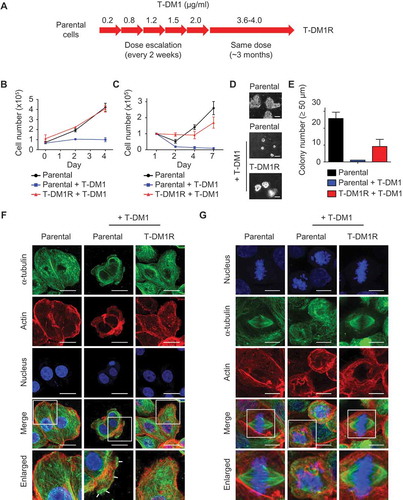
Next, we examined microtubule assembly in T-DM1R cells during both non-mitosis and mitosis. In non-mitotic parental cells, microtubules were assembled efficiently in the absence of T-DM1 (). However, overnight treatment with 4 µg/ml T-DM1 disrupted microtubule network in parental JIMT1 cells such that the microtubules were accumulated at the cell periphery (, arrows). The accumulation of microtubules at the cell peripheral in response to drug treatment is a typical morphology of apoptotic cells.Citation22 In contrast, the microtubule network remained intact in T-DM1R cells treated with 4 µg/ml T-DM1 overnight ().
Mitotic spindles are microtubule-based structures that separate chromosome aligned in the middle of the cell body. In the presence of T-DM1, the microtubule-based spindle formation was severely disrupted in parental cells, resulting in mitotic arrest and fragmented nuclei (). When T-DM1R cells were incubated with T-DM1, the mitotic spindles appeared to be similar to those of untreated parental cells and the normal alignment of chromosome in the middle of cell body was maintained (). Taken together, the data show that T-DM1R cells overcome T-DM1-induced inhibition of microtubule polymerization and apoptosis.
HER2 expression is diminished in T-DM1R cells
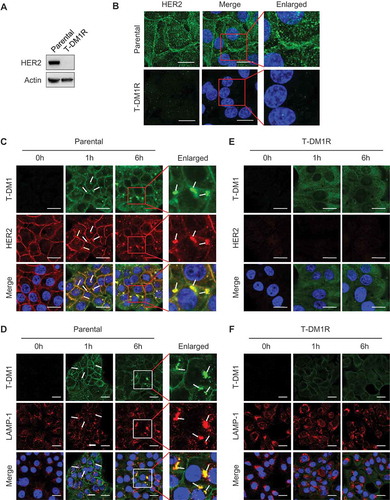
We next examined expression of HER2 in T-DM1R cells using Western blot analysis and fluorescent immunostaining. As shown in and , HER2 expression was diminished in T-DM1R cells compared with that in parental JIMT1 cells. The loss of HER2 expression in T-DM1-resistant cells is consistent with a previous study.Citation9,Citation23 We obtained the same result from an independent selection of T-DM1-resistant cells, in that HER2 expression was diminished after JIMT1 cells became resistant to T-DM1 (data not shown). To further confirm this observation, we examined whether T-DM1 internalization and the subsequent trafficking into lysosome were blocked in T-DM1R cells. and showed that T-DM1 was co-localized with HER2 at the cell surface (yellow arrows) after parental JIMT1 cells were incubated with T-DM1 for 1 hr and 6 hrs, and then endocytosed and co-localized with LAMP-1 (white arrows), a lysosomal marker. On the other hand, in T-DM1R cells, the co-localization of T-DM1 with HER2 or LAMP-1 was not observed ( and ). Data from these experiments indicate that the loss of HER2 expression in T-DM1R cells blocks the internalization of T-DM1. Taken together, the loss of HER2 expression leads to T-DM1 resistance in our cellular model.
Figure 2. HER2-dependent T-DM1 internalization is blocked in T-DM1R cells. (A) The levels of endogenous HER2 in the WCL of JIMT1 parental and T-DM1R cells were analyzed by Western blot. (B) Fluorescent immunostaining images showing HER2 in JIMT1 parental and T-DM1R cells. Nucleus was stained with DAPI. Scale bar, 20 µm. (C and D) JIMT1 parental cells were incubated with 100 µg/ml T-DM1 at 37°C for 1 hr and 6 hrs, and subsequently fixed for fluorescent immunostaining of T-DM1 using DyLight 488-conjugated anti-human IgG antibody (green in C and D), HER2 (red in C) and LAMP-1 (red in D). Nucleus was stained with DAPI (blue in C and D). Scale bar, 20 µm. (E and F) JIMT1 T-DM1R cells were incubated with 100 µg/ml T-DM1 at 37°C for 1 hr and 6 hrs, and subsequently fixed for fluorescent immunostaining of T-DM1 using DyLight 488-conjugated anti-human IgG antibody (green in E and F), HER2 (red in E) and LAMP-1 (red in F). Nucleus was stained with DAPI (blue). T-DM1 were not co-localized with either HER2 or LAMP-1. Scale bar, 20 µm.
Cell motility and invasion activity are enhanced in T-DM1R cells
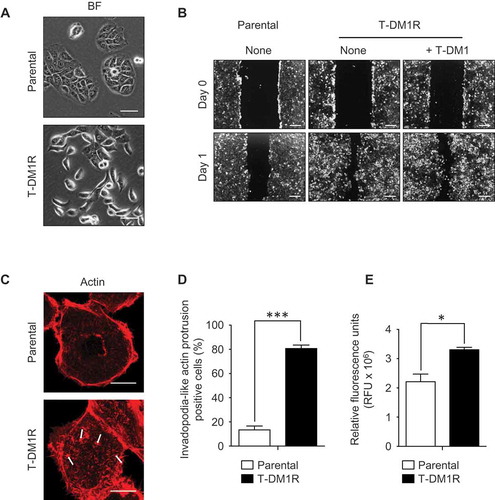
At the steady state, T-DM1R cells exhibited spindle like morphology, which differs from epithelial-like and tile-shaped parental JIMT1 cells (). To ascertain whether spindle shape morphology could be correlated with cell motility in T-DM1R cells, a cell migration assay was performed. Results from the migration assay showed that the cell motility was enhanced in T-DM1R cells compared with that of parental cells both in the absence and presence of T-DM1 (). Actin staining by rhodamine-conjugated phalloidin demonstrated that invadopodia-like actin protrusions were observed in T-DM1R cells, whereas the parental cells lacked invadopodia-like structures ( and ). Invadopodia-like actin protrusions are associated with metastatic cancers and play an important role in the metastasis process.Citation18,Citation24 As predicted, invasion activity of T-DM1R cells was significantly enhanced compared with that of parental cells ().
Figure 3. Cell migration and invasion activities are promoted in T-DM1R cells. (A) Bright field (BF) images of JIMT1 parental and T-DM1R cells. Scale bar, 50 µm. (B) Cell migration assay. Scale bar, 100 µm. BF images of Day 0 and Day 1 are shown for each experiment. (C) Actin staining by rhodamine phalloidin shows invadopodia-like actin protrusion in T-DM1R cells. Scale bar, 10 µm. (D) Quantification of invadopodia-like actin protrusion positive cells in parental and T-DM1R cells. Cell numbers showing invadopodia-like actin protrusion positive cells were quantified per total cell numbers counted in randomly selected fields (n = 3, total 118–370 cells). (E) Cell invasion activity was measured by obtaining relative fluorescence units (RFU) from cells that passively passed through ECM-coated membrane (see Materials & Methods in detail) .
α5β1 integrins are upregulated in T-DM1R cells
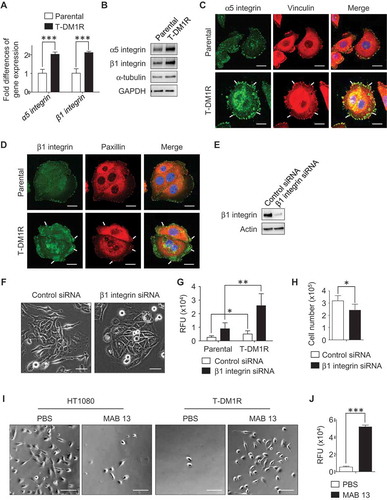
We found that invadopodia-like actin protrusions in T-DM1R cells were only observed with fibronectin-coated dishes, not in the other ECM protein- (i.e., collagen) coated dishes (data not shown), suggesting that cell motility or invasion properties of T-DM1R cells are affected by cellular proteins that associate with fibronectin. To elucidate possible mechanisms involved in the enhanced cell invasion activity in T-DM1R cells, we hypothesized that the fibronectin receptor (also known as RGD receptor) α5β1 integrin could be involved. To this end, we first examined gene expression levels of α5 and β1 integrins by quantitative PCR (q-PCR), and data showed that gene expressions of α5 and β1 integrins were increased two folds in T-DM1R cells compared with those in parental cells (). Further, the increased α5 and β1 integrin protein expressions were confirmed by Western blot () and fluorescent immunostaining ( and ). As shown in and , vinculin or paxillin is co-located with integrins in the focal contacts, and both proteins were used as markers for this experiment. These results suggest that α5β1 integrin likely plays a role in the enhanced cell motility or invasion activity in T-DM1R cells.
Figure 4. α5β1 integrin is up-regulated in T-DM1R cells and blocking α5β1 integrin enhances cell invasion activity. (A) Gene expression levels of α5 integrin and β1 integrin were examined by quantitative PCR. GAPDH gene was used as an internal control. (B) Protein expression levels of α5 and β1 integrins in the WCL of JIMT1 parental and T-DM1R cells were analyzed by Western blot analysis. (C) Fluorescent immunostaining images showing α5 integrin and vinculin in JIMT1 parental and T-DM1R cells. Scale bar, 20 µm. (D) Fluorescent immunostaining images showing β1 integrin and paxillin in JIMT1 parental and T-DM1R cells. Scale bar, 20 µm. (E) Knock-down efficiency of β1 integrin in T-DM1R cells was evaluated by Western blot analysis. (F) Bright field (BF) images showing cell morphology of control siRNA and β1 integrin specific siRNA treated T-DM1R cells. BF images, scale bar, 50 µm. (G) Cell invasion activity in control siRNA treated or β1 integrin knocked-down T-DM1R cells. (H) Cell growth assay in control siRNA and β1 integrin knocked-downed T-DM1R cells after 48 hrs of siRNA transfection. (I) BF images showing the number of MAB 13-treated HT1080 or T-DM1R cells that passed through ECM-coated membrane. Scale bar, 100 µm. (J) Quantitative analysis of cell invasion activity in MAB 13-treated T-DM1R cells comparing with that in PBS control cells.
Inhibition of α5β1 integrin enhances cell invasion activity in T-DM1R cells
To examine the involvement of α5β1 integrin in the enhanced cell invasion activity, β1 integrin was knocked-down using siRNA technology. As shown in , the knock-down efficiency of β1 integrin was evaluated by Western blot analysis as 90.4% after 72 hr post siRNA transfection. The β1 integrin knocked-down T-DM1R cells display morphology similar to that of parental cells ( right panels). Unexpectedly, invasion activity was enhanced in both β1 integrin knocked-down parental and T-DM1R cells, to an even greater extent in T-DM1R cells (). Interestingly, cell growth was inhibited in β1 integrin knocked-down cells compared to that of control siRNA-treated cells (), suggesting that the cell growth and invasion were regulated differently in T-DM1R cells. To confirm the result of the enhanced cell invasion activity in β1 integrin knocked-down cells, cell invasive activity was examined by an alternative method. MAB 13 is a monoclonal antibody directed against β1 integrin and has been shown to inhibit α5β1 integrin function by binding RGD (Arg-Gly-Asp) contained in ECM proteins such as fibronectin.Citation25 Human fibrosarcoma HT1080 is a well-known cell line that shows α5β1 integrin-dependent cell invasion activity when fibronectin is a substrate.Citation26 Data from cell invasion assays showed that MAB 13 blocked invasion activity in HT1080 cells (, left panels), but significantly enhanced invasion activity in T-DM1R cells (, right panels and ), consistent with the results shown in .
αV integrin is essential for the enhanced cell invasion activity in α5β1 integrin function-blocked cells
Since αV integrin is also a major RGD receptor for fibronectin,Citation17 we hypothesized that αV integrin may play a role in the enhanced cell invasion in the cells when α5β1 integrin function is blocked. Western blot analysis showed that expression levels of αV integrin did not vary noticeably between parental cells in the absence/presence of T-DM1 and T-DM1R cells on non-fibronectin-coated dishes (). Treatment of T-DM1R cells with MAB 13 did not change the expression levels of αV integrin compared with control IgG treatment (). We then explored the functional connections among different integrin molecules in T-DM1R cells using siRNA. Western blotting data showed that α5 integrin expression was decreased in β1 integrin-knocked-down cells (). Since β1 integrin is the sole binding partner for α5 integrin, these data indicate that silencing β1 integrin leads to instability of α5 integrin in T-DM1R cells. Data in showed that reduced protein expression of α5 integrin appeared to be correlated with the increased αV integrin expression in β1 integrin knocked-down T-DM1R cells. Our results indicate that αV integrin does not need β1 integrin to be stabilized and expressed in the T-DM1R cells since it can associate with other β integrins, such as β3 integrin, to form heterodimers. Silencing αV integrin did not alter α5 integrin expression. However, a double knock-down of β1 and αV integrins also reduced α5 integrin expression in T-DM1R cells ().
Figure 5. αV integrin is involved in the enhancement of cell invasion activity in β1 integrin gene knocked-down or function-blocked T-DM1R cells. (A) The levels of αV integrin expression were examined in WCL of parental and T-DM1R cells in the absence/presence of 4 µg/ml T-DM1 by Western blot analysis. (B) The levels of αV integrin expression were examined in WCL of control IgG or MAB 13-treated T-DM1R cells for 48 hrs by Western blot analysis. (C) α5 integrin, β1 integrin and αV integrin protein expressions were evaluated on Western blot analysis after knocking down of β1 integrin, αV integrin or both β1 and αV integrins in T-DM1R cells. (D) Bright field (BF) images showing invasive T-DM1R cells that passed through the ECM-coated membrane. Images represent T-DM1R cells treated with control siRNA, β1 integrin siRNA, αV integrin siRNA, or β1 and αV integrin siRNAs. Scale bar, 100 µm. (E) Quantitative analysis of cell invasion assays. (F) BF images showing invasive T-DM1R cells that passed through the ECM-coated membrane. Images represent T-DM1R cells treated with control IgG + control siRNA, MAB 13 + control siRNA, control IgG + αV integrin siRNA, or MAB 13 + αV integrin siRNAs. Scale bar, 100 µm. (G) Quantitative analysis of cell invasion activity. (H) BF images showing invasive T-DM1R cells that passed through the ECM-coated membrane. Images represent T-DM1R cells treated with control IgG, MAB 13, control IgG + RGD peptide, or MAB 13 + RGD peptide. Scale bar, 100 µm. (I) Quantitative analysis of cell invasion activity.
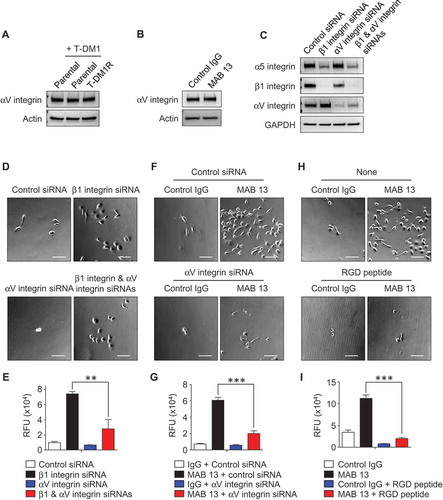
We next examined whether αV integrin, which increased in expression in the β1 integrin knocked-down cells, plays a critical role for cell invasion in T-DM1R cells. and showed that invasion activity of T-DM1R cells was relatively low and slightly reduced by silencing αV integrin. The increased T-DM1R cell invasion activity induced by β1 integrin knock-down was significantly reduced when αV integrin expression was silenced by siRNA. These results suggest that αV integrin plays a critical role for the enhanced cell invasion in β1 integrin knocked-down T-DM1R cells. At the steady state, αV integrin activity may be inhibited by α5 integrin that competes binding of β1 integrin with αV integrin to form α5β1 heterodimer. These data were further confirmed with MAB 13 treatment. As shown in and , the cell invasion activity enhanced by anti-β1 integrin antibody, MAB 13, was also significantly inhibited by specific αV integrin siRNA in T-DM1R cells. These results provide another piece of evidence indicating that αV integrin plays a critical role in the enhanced invasion activity of T-DM1R cells when β1 integrin function is impaired. It should be noted that αV integrin knock-down was unable to enhance, rather slightly reduced cell invasion activity in T-DM1R cells. This suggests that the function of αV integrin in the regulation of cell invasion of T-DM1R cell cannot be compensated by other integrins (). The role of αV integrin in the regulation of cell invasion of T-DM1R cells was further supported by the fact that RGD peptide mimicked the effects of αV integrin knock-down on blocking the enhanced cell invasion activity induced by MAB 13 ( and ).
Taken together, these data provide important information for the target selection of integrin molecules for T-DM1-resistant cancer treatment. Based on data presented here, the metastatic potential of T-DM1 resistant cancer could be enhanced if only β1 integrin is targeted. Targeting both RGD receptors, α5β1 and αV integrins, may provide effective therapeutic approach to inhibit growth and metastasis of T-DM1-resistant breast cancer.
EGFR functionally cooperates with integrins and regulates T-DM1R cell invasion and growth
HER2 amplification is associated with cancer aggressiveness, poor prognosis and short survival.Citation27 However, in this study we demonstrated that T-DM1R cells gain high metastatic potential and become more invasive after loss of their HER2 expression. Previous studies have documented the cooperation of αV integrin with receptor tyrosine kinases (RTKs), including hepatocytes growth factor receptor (HGFR), insulin-like growth factor receptor I (IGF-IR) and EGFR, to promote the invasive potential of cancer cells.Citation28–Citation30 αVβ3 integrin-KRAS-RalB complex drives tumor stemness and resistance to EGFR inhibition.Citation31 Thus, we hypothesized that the loss of HER2 expression may activate a compensatory mechanism to upregulate other pathways mediated by RTKs that lead to enhanced invasiveness.
To assess RTK phosphorylation, we used an array kit that can simultaneously detect relative phosphorylation of 71 different RTKs. Data from the phosphorylation array showed that the phosphorylation of EGFR, HGFR, and IGF-IR were detected in parental cells treated with trastuzumab or T-DM1, or left untreated, and T-DM1R cells (). The levels of EGFR phosphorylation in T-DM1R cells appeared to be higher than that in parental cells (, yellow rectangular). Western blotting data further confirmed that the levels of EGFR and phosphorylated EGFR were increased in T-DM1R cells compared to that in parental JIMT1 cells (), suggesting that EGFR activity is upregulated. Results from an invasion assay show that inhibition of EGFR by either cetuximab (anti-EGFR therapeutic monoclonal antibody) or erlotinib (specific EGFR kinase inhibitor) reduced cell invasion activity induced by β1 integrin knocked-down in T-DM1R cells, whereas knock-down of HGFR or IGF-IR had no significant effects on the invasion activity of T-DM1 cells (). showed that EGFR expression was not affected by β1 integrin knock-down while αV integrin protein levels were enhanced (left panel), consistent with data shown in . The data suggest that up-regulated EGFR expression and phosphorylation are independent of α5β1 integrin in T-DM1R cells. Data shown in (right panel) demonstrated that, while EGFR was not co-immunoprecipitated by αV integrin, more β3 integrin was proportionally found in αV co-immunoprecipitates in β1 integrin knocked-down cells compared with control siRNA treated cells. This suggests that the levels of αVβ3 heterodimer are increased when β1 integrin is silenced by siRNA. αVβ3 complex has been reported to associate with a variety of highly progressed cancers.Citation32
Figure 6. The enhanced EGFR activity functionally cooperates with integrins and regulates T-DM1R cell invasion and growth. (A) Images showing the levels of phosphorylated receptor tyrosine kinases (RTKs) in parental cells treated as indicated or T-DM1R cells. (B) The levels of EGFR and phosphorylated EGFR were evaluated in the WCL of parental and T-DM1R cells by Western blot analysis. (C) Cell invasion activities of T-MD1R cells treated with different specific siRNAs or drugs as indicated. The concentration of cetuximab was 100 µg/ml cetuximab, and concentration of erlotinib was 5 µM. (D) The levels of αV integrin, β3 integrin and EGFR were evaluated in WCL of T-DM1 cells treated with either control siRNA or β1 integrin siRNA using Western blot analysis (left panels). WCL of T-DM1 cells treated as indicated were subjected to co-immunoprecipitation experiments (right panels), and Western blot data showed that β3 integrin, but not EGFR, was detected in anti-αV integrin immunoprecipitates. (E) 1 × 10⁶ JIMT1 parental or T-DM1R cells were seeded on fibronectin-coated 6-well plates and cultured overnight. Then, T-DM1R cells were treated with 5 µM erlotinib or left untreated and cultured for another 24 hrs. Bright field images were captured at 24-hour time point. Scale bar, 50 µm. (F) The levels of α5, β1 and αV integrin expressions were evaluated by Western blot analysis in the WCL collected at 24 and 48-hour time points as shown in E. (G) Cell growth profiles of JIMT1 parental or T-DM1R cells treated with either 5 µM erlotinib or DMSO control, respectively. T-DM1R cells were always cultured in the media containing 4 μg/ml of T-DM1. (H) Cell invasion activities of T-DM1R cells treated with 5 µM erlotinib, 5 µM AG1478 or DMSO control.
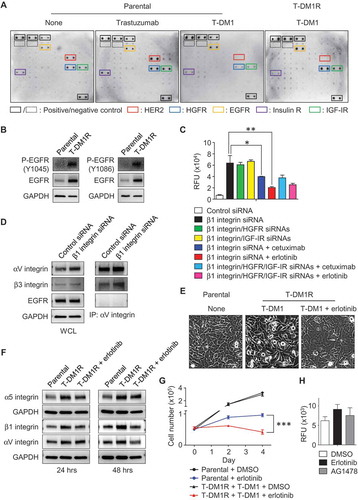
Next, we investigated the functional connections between EGFR and integrins. After T-DM1R cells were treated with erlotinib for 24 hours, the morphology of T-DM1R cells was changed from the mesenchymal-like spindle shape to an epithelial-like sheet shape similar to that of parental cells (), suggesting that EGFR kinase activity is involved in the regulation of integrins in T-DM1R cells. demonstrated that the enhanced expression of αV, α5 and β1 integrins in T-DM1R cells, compared to that in parental cells, were reduced by erlotinib on fibronectin-coated dishes, and showed that cell growth was also inhibited when T-DM1R cells were treated with erlotinib. These results provide strong evidence that EGFR activity is required for the upregulation of these integrins molecules in T-DM1R cells. Taken together, our study indicates that loss of HER2 in T-DM1R cells up-regulates EGFR expression via a compensatory pathway, which in turn enhances the expression of α5β1 and αVβ3 integrins and ultimately increases the cells invasion of T-DM1 resistant cells. Next, we asked if EGFR kinase inhibitors alone can block the increased cell invasive phenotype. As shown in , EGFR kinase inhibitors were not sufficient to inhibit cell invasive activity of T-DM1R cells ().
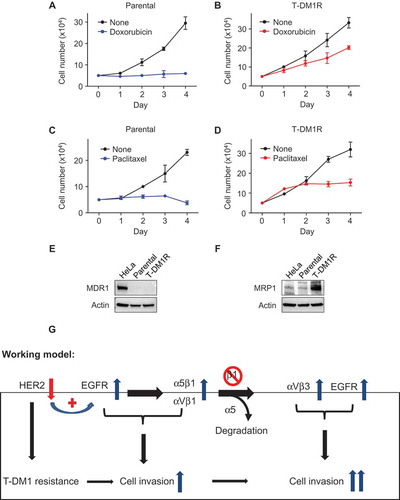
We next addressed whether T-DM1R cells were cross-resistant to chemotherapeutic drugs, such as doxorubicin and paclitaxel, that are commonly used to treat breast cancer patients. As shown in , T-DM1R cells exhibited certain levels of cross-resistance to these chemotherapeutic drugs, consistent with the previous study.Citation9 Specifically, T-DM1R cells treated with either doxorubicin or paclitaxel continued to grow and reached 53.7% and 40.2% of cell growth of untreated T-DM1R cells, respectively. However, there was no growth for parental cells treated with either doxorubicin or paclitaxel. MDR1 and MRP1 are the member of ABC transporter family and are involved in a multiple drug resistance in cancers.Citation33–Citation35 We then examined their protein expression in both JIMT1 parental and T-DM1R cells. showed that neither parental nor T-DM1R cells expressed MDR1 protein. In contrast, MRP1 protein expression was enhanced in the T-DM1R cells compared to that in parental cells and Hela cells (), suggesting that upregulation of MRP1 may contribute to cross-resistance of T-DM1R cells to the chemotherapeutic drugs.
Figure 7. Cross-resistance of T-DM1-resistant cells to doxorubicin and paclitaxel. (A, B) Cell growth profiles of JIMT1 parental or T-DM1R cells treated with either 50 nM doxorubicin or left untreated. T-DM1R cells were cultured in the media containing 4 μg/ml of T-DM1. (C, D) Cell growth profiles of JIMT1 parental or T-DM1R cells treated with either 5 nM paclitaxel or left untreated. T-DM1R cells were cultured in the media containing 4 μg/ml of T-DM1. (E and F) The levels of MDR1 were evaluated in the WCL of parental and T-DM1R cells by Western blot analysis using anti-MDR1 antibody. HeLa cells were used as a positive control. The experimental procedure for Figure 7F is essentially the same as described in Figure 7E, except that anti-MRP1 antibody was used to detect the protein levels of MRP1 in WCL. (G) Working model: Loss of HER2 confers T-DM1 resistance in HER2-positive breast cancer cells, which in turn upregulates EGFR via a compensatory mechanism. Increased EGFR activity changes the expression of the major RGD integrins, α5β1 and αVβ1, leading to the enhanced cell invasion compared with parental JIMT1 breast cancer cells. Importantly, when β1 integrin function is blocked by either specific siRNA or inhibitory monoclonal antibody, MAB 13, this leads to significant increase in cell invasion of T-DM1R cells.
Discussion
Here, we show that the cell invasion activity is enhanced when HER2-positive breast cancer cells become resistant to T-DM1 and demonstrate that EGFR cooperates with α5β1 and αVβ3 integrins to control the cell growth and invasion activity of T-DM1R cells. As depicted in our working model shown in , loss of HER2 confers T-DM1 resistance in HER2-positive breast cancer cells chronically exposed to T-DM1. This in turn upregulates EGFR expression to compensate for the diminished HER2 expression and changes the balance of integrin signaling pathways in T-DM1R cells. Upregulated EGFR activity increases the expression of the major RGD integrins, α5β1 and αVβ3 and, together with these RGD-binding integrins, leads to enhanced T-DM1R cell invasion. When β1 integrin function is blocked by either specific siRNA or the inhibitory monoclonal antibody MAB 13, cell invasion activity of T-DM1R cells is significantly increased via two proposed mechanisms. First, when β1 integrin expression is reduced by siRNA, α5 integrin undergoes degradation. This results in the reduced α5β1 and increased αVβ3 in T-DM1R cells. Secondly, when α5β1 function is inhibited by MAB 13, this may release its suppressive effect on endogenous αVβ3 integrin, thus upregulating its intrinsic cellular function. Upregulated αVβ3 together with enhanced EGFR activity strongly promotes cell invasion activity of T-DM1R cells ().
Resistance to therapeutic drugs is a major clinical problem in oncology. T-DM1 has been approved to treat trastuzumab-resistant breast cancer. While primary resistance to T-DM1 may be relatively infrequent, most patients will eventually develop acquired resistance to T-DM1.Citation8 Currently, there is no approved targeted therapy to effectively treat T-DM1-resistant breast cancers. This study may provide critical information for the development of targeted therapy of T-DM1-resistant disease. First, α5β1 integrin has been reported to correlate with disease progression in various tumor types, and targeting α5β1 integrin has been shown efficacy in reducing tumor burden in preclinical models.Citation16,Citation36,Citation37 An anti-integrin β1 monoclonal antibody has been tested to affect in vitro and in vivo growth of human breast cancer tumor cells.Citation38 While integrin receptors could potentially serve as therapeutic targets for breast cancers, specific integrin molecules should be very carefully selected as therapeutic targets to treat T-DM1-resistant disease. Our data indicate that the inhibition of β1 integrin gives T-DM1R cells, which express higher levels of β1 integrin than parental cells, the ability to gain a higher metastatic potential and become more invasive.
Second, αVβ3 integrin was reported as a specific marker of most malignant melanoma.Citation39 Since then, αV together with β3, β5, β6, or β8 integrins has been widely studied in multiple cancers and numerous studies have shown the correlation of high αV integrin expression with cancer progression.Citation40–Citation44 Conversely, inhibition of αV integrin is sufficient to block invasive activity in preclinical in vitro and in vivo modelsCitation40,Citation45–Citation47 and has been used as a therapeutic target for metastatic cancers in preclinical and clinical studies.Citation16,Citation32,Citation48 In this study, we show that αVβ3 heterodimer is found in HER2-positive breast cells. The levels of αV are elevated when β1 integrin is reduced by siRNA, which correlates with the enhanced cell invasion activity of T-DM1R cells. These data suggest that αV integrin plays a crucial role in the invasive phonotype of T-DM1R cells and could potentially serve as a therapeutic target to inhibit invasion and metastasis of T-DM1-resistant disease.
Third, EGFR and HER2 contribute to tumor formation and metastasis in many tumor types, including breast cancers. Not only does our study reveal a compensatory pathway between EGFR and HER2, but it also demonstrates a novel relationship between HER family receptors and RGD integrins in T-DM1 resistant breast cancer cells. However, it should be noted that the molecular mechanisms behind the cross-talk between two signaling pathways are not entirely understood, indicating a need for additional research. Our data indicate that the expression of RGD integrins and αVβ3-mediated invasive phenotype of T-DM1R cells appear to be regulated EGFR activity. However, blocking EGFR kinase activity by kinase inhibitor appears insufficient in inhibiting cell invasion activity of T-DM1R cells, although it can inhibit T-DM1R cell growth. While the expression changes in EGFR and RGD integrins may provide opportunity to develop effective therapeutic strategy to overcome T-DM1 resistance, our data suggest that dual targeting of EGFR and integrins may be crucial for the treatment of T-DM1-resistant disease.
Materials and methods
Cells and therapeutic drugs
A primary trastuzumab-resistant breast cancer cell line JIMT1 was purchased from DSMZ and cultured in Dulbecco’s Modified Eagle’s medium (DMEM) containing 10% FBS according to the instructions provided by the company. Human cervical cancer HeLa cell and human fibrosarcoma HT1080 cell were purchased from ATCC and cultured in DMEM media containing 10% FBS. T-DM1, trastuzumab, cetuximab, doxorubicin, and paclitaxel were purchased from the pharmacy at the NIH (Bethesda, NIH). Erlotinib was purchased from Selleckchem (cat#S1023). Tyrphostin AG1478 was purchased from Sigma-Aldrich (cat#T4182). MAB 13, a rat IgG2aκ targeting β1 integrin, was purchased from BD Pharmingen (cat#552828).
Immunofluorescent staining
Cells were plated on either non-coated or fibronectin (10 µg/ml at 4°C overnight, Sigma-Aldrich) pre-coated glass coverslips in 12-well plate and cultured overnight. Cells were then fixed in 4% paraformaldehyde (Electron Microscopy Sciences, cat#15710) for 20 min and permeabilized with either 0.2% Triton X-100/TBS or 0.5% Saponin (EMD Millipore)/TBS for 10 min. For fluorescent immunostaining of co-localization of T-DM1 either with HER2 and LAMP1, methanol was used for fixation at −20°C for 20 min instead of 4% paraformaldehyde. After blocking with 10% donkey serum (Jackson ImmunoResearch) at room temperature for 1–2 hrs, cells were subjected to fluorescent immunostaining. ProLong Gold antifade reagent with DAPI (Thermo Fisher Scientific) was used for mounting specimens on glass slides and nuclear staining. Images were captured by an LSM 880 confocal microscope (Carl Zeiss Microscopy). The following primary antibodies were used: α5 integrin (1:100; rabbit; Abcam, cat#ab150361), β1 integrin (1:100, mouse; Abcam ab30394), α-tubulin (1:100; mouse; Sigma-Aldrich, cat#T6199), LAMP-1 (1:100; mouse; BD Pharmingen, cat#555798) and HER2 (1:100; rabbit; Cell Signaling Technology, cat#2165). The following secondary antibodies were used: Alexa Fluor 488-conjugated anti-mouse IgG (1:100; goat; Thermo Fisher Scientific, cat#A21121), Alexa Fluor 549-conjugated anti-rabbit IgG (1:100; donkey; Thermo Fisher Scientific, cat#A21207), and DyLight 488-cojugated anti-human IgG (1:100, donkey, Thermo Fisher Scientific, cat#SA5-10126). Actin was stained by using Rhodamine phalloidin (1:100, Thermo Fisher Scientific, cat#R415).
Western blotting
The detailed experimental procedures for Western blotting were described previously.Citation49 For detecting α5, αV, β1, and β3 integrins, whole cell lysate (WCL) was prepared under the non-reducing condition without DTT or β-mercaptoethanol. The following primary antibodies were used: α5 integrin (1:1000; rabbit; Abcam, cat#ab150361), αV integrin (1:1000; rabbit; Abcam, cat#ab208012), β1 integrin (1:1000; mouse; Abcam, cat#ab30394), β3 integrin (1:1000; rabbit; Abcam, cat#ab197662), α-tubulin (1:1000; mouse; Sigma-Aldrich, cat#T6199), β-actin (1:1000; mouse; Sigma-Aldrich A1978), actin (1:1000; rabbit; Sigma-Aldrich, cat#A2066), HER2 (1:1000; rabbit; Cell Signaling Technology, cat#2165), HGFR (1:1000; rabbit; Abcam, cat#ab137654), IGF-IR (1:1000; rabbit, Cell Signaling Technology, cat#3027), EGFR (1:1000; mouse; BD Biosciences, cat#610016), phospho-EGFR (Y1045) (1:1000; rabbit, Cell Signaling Technology, cat#2237), phospho-EGFR (Y1086) (1:1000; rabbit, Cell Signaling Technology, cat#2220), MDR1 (1:1000; rabbit, Abcam, cat#ab170904), and MRP1 (1:1000; mouse, Abcam, cat#32574). The following secondary antibodies were used: horseradish peroxidase (HRP)-conjugated ECL anti-mouse IgG (1:1000; sheep; GE Healthcare, cat#NA931V) and HRP-conjugated ECL anti-rabbit IgG (1:1000; donkey; GE Healthcare, cat#NA934V).
Co-immunoprecipitation of αV integrin, β3 integrin and EGFR
WCL of control siRNA or β1 integrin siRNA-treated T-DM1R cells were used for detection of αV integrin, β3 integrin and EGFR expressions in WCL, or β3 integrin and EGFR in anti-αV integrin immunoprecipitates.
Quantitative PCR for α5 integrin and β1 integrin gene expression
Total RNA was isolated by using RNeasy (QIAGEN) according to the manufacturer’s protocol. cDNAs were prepared using a reverse transcriptase SuperScript VILO (Thermo Fisher Scientific). qPCR was performed using Power SYBER green (Applied Biosystems) and a QuantStudio 7 Flex Real-Time PCR system (Applied Biosystems). The α5 integrin, β1 integrin and GAPDH primer pairs were purchased from QIAGEN (cat#PPH00176C-200, cat#PPH00650B-200 and cat#PPH00150F-200, respectively). The difference of mRNA expression was calculated following the manufacturer’s instructions.
siRNA transfection
The siRNA transfection was performed using Lipofectamine 3000 (Thermo Fisher Scientific, cat#L3000015) per the manufacturer’s instructions. Briefly, 25–100 nM siRNA was transfected into 1 × 10⁵ JIMT1 or T-DM1R cells seeded in 6-well plates. Forty-eight hrs post transfection, the cells were subjected to either immunostaining or Western blot analysis. The following siRNAs were purchased from GE Dharmacon: human β1 integrin (cat#L-004506–00-0005, siRNA target sequence: GUGCAGAGCCUUCAAUAAA, GGUAGAAAGUCGGGACAAA, UGAUAGAUCCAAUGGCUUA, GGGCAACGUGUGAGAUGU), human αV integrin (cat#L-004565–00-0005, siRNA target sequence: CCUCUGACAUUGAUUGUUA, CCGAAACAAUGAAGCCUUA, GAACAUGUCCUCCUUAUAC, GUUCACGCCUGCUAACAUU), human HGFR (cat#L-003156–00-0005, siRNA target sequence: GAACUGGUGUCCCGGAUAU, GAACAGCGAGCUAAAUAUA, GAGCCAGCCUGAAUGAUGA, GUAAGUGCCCGAAGUGUAA), human IGF-IR (cat#L-003012–00-0005, siRNA target sequence: GGAAGCACCCUUUAAGAAU, GGACUCAGUACGCCGUUUA, AAAUACGGAUCACAAGUUG, AGUGAGAUCUUGUACAUUC), non-targeting control (cat#D-001810–10-20, siRNA target sequence: AGACAAUGCUGUACGGAAU, GGCUAAAGCUCCAGGCGUU, CAAAGGAUGUCAUUCGUAA, AAUAAAGAGCAGUCGCAAA).
Blocking integrin activity
For blocking β1 integrin function, MAB 13 (50 µg/ml) and rat IgG2aκ (50 µg/ml, BD Pharmingen, cat#553927) as the isotype control were used after dialyzing in Dulbecco’s phosphate-buffered saline (DPBS) three times at 4°C overnight to remove the preservative. For blocking both α5β1 and αV integrins, RGD peptide (5 mg/ml, H-Gly-Arg-Gly-Asp-Ser-OH, Bachem, cat#H-1345.0025) was used after reconstituted with DMEM. Prior to cell invasion assay, cells were pre-incubated with either the purified antibodies or the peptide for 30 min at 37°C.
Cell invasion assay
A QCM 24-well cell invasion assay kit (Millipore, cat#ECM554) was used for cell invasion activity, and experiments were performed according to the manufacturer’s protocol. Specifically, siRNA-treated cells were used for cell invasion assay after 72 hrs of siRNA transfection. Briefly, 2.5 × 10⁵ cells were seeded into an invasion chamber containing an 8 µm pore size polycarbonate membrane coated with a thin layer of ECMatrix. The ECM layer occludes the membrane pores that block non-invasive cells from migration through the membrane. After 48 hrs, invaded cells on the bottom of the insert membrane were dissociated from the membrane by incubating with cell detachment buffer, and subsequently lysed and detected by CyQuant GR dye. The relative fluorescence units (RFU) were measured using a fluorescence plate reader VICTOR X3 (PerkinElmer).
Cell migration assay
5 × 10⁵ cells were seeded in 6-well plates and cultured overnight at 37°C. Next day, cells were scratched by using a 200 µl pipet’ tip (SORENSON) and the images were taken by Nikon microscope with INFINITY software/CCD camera.
Human receptor tyrosine kinase phosphorylation antibody array
Human RTK phosphorylation antibody array allows simultaneous detection of the relative phosphorylation levels of 71 receptor tyrosine kinases in cell lysates. The array was purchased from Ray Biotech, Inc. and the assays were performed according to the manufacturer’s instructions.
Soft agar assay
The assay was performed as previously reported.Citation50
Statistical analysis
GraphPad Prism was used for statistical studies. Statistical significance was determined by Student’s t-test (*, p-value < 0.05; **, p-value < 0.01; ***, p-value < 0.0001). Data is expressed as mean ± SD.
Abbreviations
| ADC | = | Antibody-drug conjugate |
| BF | = | Bright field |
| DAPI | = | 4',6-Diamidino-2-Phenylindole |
| DMEM | = | Dulbecco’s Modified Eagle’s medium |
| DMSO | = | Dimethyl sulfoxide |
| ECL | = | Enhanced chemiluminescence |
| ECM | = | Extracellular matrix |
| EGFR | = | Epidermal growth factor receptor |
| FBS | = | Fetal bovine serum |
| FDA | = | Food and Drug Administration |
| GAPDH | = | Glyceraldehyde 3-phosphate dehydrogenase |
| HER2 | = | Human epidermal growth factor receptor 2 |
| HGFR | = | Hepatocyte growth factor receptor |
| IGF-IR | = | Insulin-like growth factor receptor |
| LAMP-1 | = | Lysosomal-associated membrane protein 1 |
| MAB | = | Monoclonal antibody |
| NIH | = | National Institutes of Health |
| PCR | = | Polymerase chain reaction |
| Q-PCR | = | Quantitative PCR |
| RFU | = | Relative fluorescence units |
| RGD | = | Arginylglycylaspartic acid |
| RNA | = | Ribonucleic acid |
| RTK | = | Receptor tyrosine kinases |
| SiRNA | = | Small interfering RNA |
| TBS | = | Tris-buffered saline |
| T-DM1 | = | Ado-trastuzumab emtansine |
| T-DM1R | = | T-DM1 resistance |
| WB | = | Western Blot |
| WCL | = | Whole-cell lysate |
Competing interests/Disclaimer
The authors do not have any financial interests. This article reflects the views of the authors and should not be construed to represent FDA’s views or policies.
Acknowledgments
We thank Drs. Chikako Torigoe and Tao Xie of FDA for critical internal review of this manuscript and Ms. Sarah Lyon for critical editing.
Additional information
Notes on contributors
Wen Jin Wu
Y.E. and W.J.W. developed, designed, and conceived the project. Y.E. and W.J.W. analyzed and interpreted data. Y.E. performed most experiments. Y.S. established JIMT1-derived T-DM1-resistant cell and performed fluorescent immunostaining, cell growth and migration assays, and kinase array assay and assisted in Western blot analysis. L.A.Y. assisted in fluorescent immunostaining and Western blot analysis. Y.E., N.M. and W.J.W. wrote the manuscript with input from all authors. W.J.W. supervised the study.
References
- Ducry L, Stump B. Antibody-drug conjugates: linking cytotoxic payloads to monoclonal antibodies. Bioconjug Chem. 2010;21(1):5–13. doi:10.1021/bc9002019.
- Lewis Phillips GD, Li G, Dugger DL, Crocker LM, Parsons KL, Mai E, Blättler WA, Lambert JM, Chari RVJ, Lutz RJ, et al. Targeting HER2-positive breast cancer with trastuzumab-DM1, an antibody-cytotoxic drug conjugate. Cancer Res. 2008;68(22):9280–9290. doi:10.1158/0008-5472.CAN-08-1776.
- Giordano SH, Temin S, Kirshner JJ, Chandarlapaty S, Crews JR, Davidson NE, Esteva FJ, Gonzalez-Angulo AM, Krop I, Levinson J, et al. Systemic therapy for patients with advanced human epidermal growth factor receptor 2-positive breast cancer: American Society of Clinical Oncology clinical practice guideline. J Clin Oncol. 2014;32(19):2078–2099. doi:10.1200/JCO.2013.54.0948.
- Erickson HK, Lewis Phillips GD, Leipold DD, Provenzano CA, Mai E, Johnson HA, Gunter B, Audette CA, Guta M, Pinkas J, et al. The effect of different linkers on target cell catabolism and pharmacokinetics/pharmacodynamics of trastuzumab maytansinoid conjugates. Mol Cancer Ther. 2012;11(5):1133–1142. doi:10.1158/1535-7163.MCT-11-0727.
- Dokmanovic M, ElZarrad KM, Hirsch DS, Wu JW. Antibody-drug conjugates as therapeutic agents in oncology: overview and perspectives. In: Atta-ur-Rahman M, Choudhary I, editors. Frontiers in anti-cancer drug discovery. Oak Park (IL): Bentham Science Publishers; 2013. p. 139–189.
- Senter PD. Potent antibody drug conjugates for cancer therapy. Curr Opin Chem Biol. 2009;13(3):235–244. doi:10.1016/j.cbpa.2009.03.023.
- Boyraz B, Sendur MA, Aksoy S, Babacan T, Roach EC, Kizilarslanoglu MC, Petekkaya I, Altundag K. Trastuzumab emtansine (T-DM1) for HER2-positive breast cancer. Curr Med Res Opin. 2013;29(4):405–414. doi:10.1185/03007995.2013.775113.
- Barok M, Joensuu H, Isola J. Trastuzumab emtansine: mechanisms of action and drug resistance. Breast Cancer Res. 2014;16(2):209. doi:10.1186/s13058-014-0492-9.
- Loganzo F, Tan X, Sung M, Jin G, Myers JS, Melamud E, Wang F, Diesl V, Follettie MT, Musto S, et al. Tumor cells chronically treated with a trastuzumab-maytansinoid antibody-drug conjugate develop varied resistance mechanisms but respond to alternate treatments. Mol Cancer Ther. 2015;14(4):952–963. doi:10.1158/1535-7163.MCT-14-0862.
- Takegawa N, Nonagase Y, Yonesaka K, Sakai K, Maenishi O, Ogitani Y, Tamura T, Nishio K, Nakagawa K, Tsurutani J. DS-8201a, a new HER2-targeting antibody-drug conjugate incorporating a novel DNA topoisomerase I inhibitor, overcomes HER2-positive gastric cancer T-DM1 resistance. Int J Cancer. 2017;141(8):1682–1689. doi:10.1002/ijc.30870.
- Lewis Phillips GD, Fields CT, Li G, Dowbenko D, Schaefer G, Miller K, Andre F, Burris HA, 3rd, Albain KS, Harbeck N. Dual targeting of HER2-positive cancer with trastuzumab emtansine and pertuzumab: critical role for neuregulin blockade in antitumor response to combination therapy. Clin Cancer Res. 2014;20(2):456–468. doi:10.1158/1078-0432.CCR-13-0358.
- Sabbaghi M, Gil-Gómez G, Guardia C, Servitja S, Arpí O, García-Alonso S, Menendez S, Arumi-Uria M, Serrano L, Salido M, et al. Defective cyclin B1 induction in trastuzumab-emtansine (T-DM1) acquired resistance in HER2-positive breast cancer. Clin Cancer Res. 2017;23(22):7006–7019. doi:10.1158/1078-0432.CCR-17-0696.
- Ríos-Luci C, García-Alonso S, Díaz-Rodríguez E, Nadal-Serrano M, Arribas J, Ocaña A, Pandiella A. Resistance to the antibody-drug conjugate T-DM1 is based in a reduction in lysosomal proteolytic activity. Cancer Res. 2017;77(17):4639–4651. doi:10.1158/0008-5472.CAN-16-3127.
- Sung M, Tan X, Lu B, Golas J, Hosselet C, Wang F, Tylaska L, King L, Zhou D, Dushin R, et al. Caveolae-mediated endocytosis as a novel mechanism of resistance to trastuzumab emtansine (T-DM1). Mol Cancer Ther. 2018;17(1):243–253. doi:10.1158/1535-7163.MCT-17-0403.
- Hood JD, Cheresh DA. Role of integrins in cell invasion and migration. Nat Rev Cancer. 2002;2(2):91–100. doi:10.1038/nrc727.
- Desgrosellier JS, Cheresh DA. Integrins in cancer: biological implications and therapeutic opportunities. Nat Rev Cancer. 2010;10(1):9–22. doi:10.1038/nrc2748.
- Hynes RO. Integrins: bidirectional, allosteric signaling machines. Cell. 2002;110(6):673–687.
- Huttenlocher A, Horwitz AR. Integrins in cell migration. Cold Spring Harb Perspect Biol. 2011;3(9):a005074. doi:10.1101/cshperspect.a005074.
- Hirsch DS, Wu WJ. Cdc42: an effector and regulator of ErbB1 as a strategic target in breast cancer therapy. Expert Rev Anticancer Ther. 2007;7(2):147–157. doi:10.1586/14737140.7.2.147.
- Hynes NE, MacDonald G. ErbB receptors and signaling pathways in cancer. Curr Opin Cell Biol. 2009;21(2):177–184. doi:10.1016/j.ceb.2008.12.010.
- Tanner M, Kapanen AI, Junttila T, Raheem O, Grenman S, Elo J, Elenius K, Isola J. Characterization of a novel cell line established from a patient with herceptin-resistant breast cancer. Mol Cancer Ther. 2004;3(12):1585–1592.
- Oropesa-Ávila M, Fernández-Vega A, de la Mata M, Maraver JG, Cordero MD, Cotán D, de Miguel M, Calero CP, Paz MV, Pavón AD. Apoptotic microtubules delimit an active caspase free area in the cellular cortex during the execution phase of apoptosis. Cell Death Dis. 2013;4:e527. doi:10.1038/cddis.2013.58.
- Loganzo F, Sung M, Gerber HP. Mechanisms of resistance to antibody-drug conjugates. Mol Cancer Ther. 2016;15(12):2825–2834. doi:10.1158/1535-7163.MCT-16-0408.
- Murphy DA, Courtneidge SA. The ‘ins’ and ‘outs’ of podosomes and invadopodia: characteristics, formation and function. Nat Rev Mol Cell Biol. 2011;12(7):413–426. doi:10.1038/nrm3141.
- Mould AP, Akiyama SK, Humphries MJ. The inhibitory anti-beta 1 integrin monoclonal antibody 13 recognizes an epitope that is attenuated by ligand occupancy. Evidence for allosteric inhibition of integrin function. J Biol Chem. 1996;271(34):20365–20374.
- Yamada KM, Kennedy DW, Yamada SS, Gralnick H, Chen WT, Akiyama SK. Monoclonal antibody and synthetic peptide inhibits of human tumor cell migration. Cancer Res. 1990;50(15):4485–4496.
- Slamon DJ, Clark GM, Wong SG, Levin WJ, Ullrich A, McGuire WL. Human breast cancer: correlation of relapse and survival with amplification of the HER-2/neu oncogene. Science. 1987;235(4785):177–182.
- Crouch S, Spidel CS, Lindsey JS. HGF and ligation of αvβ5 integrin induce a novel, cancer cell-specific gene expression required for cell scattering. Exp Cell Res. 2004;292(2):274–287.
- Brooks PC, Klemke RL, Schӧn S, Lewis JM, Schwartz MA, Cheresh DA. Insulin-like growth factor receptor cooperates with integrin αvβ5 to promote tumor cell dissemination in vivo. J Clin Invest. 1997;99(6):1390–1398. doi:10.1172/JCI119298.
- Klemke RL, Yebra M, Bayna EM, Cheresh DA. Receptor tyrosine kinase signaling required for integrin αvβ5-directed cell motility but not adhesion to vitronectin. J Cell Biol. 1994;127(3):859–866.
- Seguin L, Kato S, Franovic A, Camargo MF, Lesperance J, Elliott KC, Yebra M, Mielgo A, Lowy AM, Husain H, et al. An integrin β3-KRAS-RalB complex drives tumor stemness and resistance to EGFR inhibition. Nat Cell Biol. 2014;16(5):457–468. doi:10.1038/ncb2953.
- Steeg PS. Targeting metastasis. Nat Rev Cancer. 2016;16:201–218. doi:10.1038/nrc.2016.25.
- Chen KG, Sikic BI. Molecular pathways: regulation and therapeutic implications of multidrug resistance. Clin Cancer Res. 2012;18(7):1863–1869. doi:10.1158/1078-0432.CCR-11-1590.
- Borst P, Evers R, Kool M, Wijnholds J. A family of drug transporters: the multidrug resistance-associated proteins. J Natl Cancer Inst. 2000;92(16):1295–1302.
- Munoz M, Henderson M, Haber M, Norris M. Role of the MRP1/ABCC1 multidrug transporter protein in cancer. IUBMB Life. 2007;59(12):752–757. doi:10.1080/15216540701736285.
- Dos Santos PB, Zanetti JS, Ribeiro-Silva A, Beltrão EI. Beta 1 integrin predicts survival in breast cancer: a clinicopathological and immunohistochemical study. Diagn Pathol. 2012;7:104. doi:10.1186/1746-1596-7-104.
- Hu Z, Gao S, Gao J, Hou R, Liu C, Liu J, Liu D, Zhang S, Lin B. Elevated levels of Lewis y and integrin α5β1 correlate with chemotherapeutic drug resistance in epithelial ovarian carcinoma. Int J Mol Sci. 2012;13(12):15588–15600. doi:10.3390/ijms131215588.
- Park CC, Zhang H, Pallavicini M, Gray JW, Baehner F, Park CJ, Bissell MJ. Beta1 integrin inhibitory antibody induces apoptosis of breast cancer cells, inhibits growth, and distinguishes malignant from normal phenotype in three dimensional cultures and in vivo. Cancer Res. 2006;66(3):1526–1535. doi:10.1158/0008-5472.CAN-05-3071.
- Albelda SM, Mette SA, Elder DE, Stewart R, Damjanovich L, Herlyn M, Buck CA. Integrin distribution in malignant melanoma: association of the beta 3 subunit with tumor progression. Cancer Res. 1990;50(20):6757–6764.
- Horioka K, Ohuchida K, Sada M, Zheng B, Moriyama T, Fujita H, Manabe T, Ohtsuka T, Shimamoto M, Miyazaki T, et al. Suppression of CD51 in pancreatic stellate cells inhibits tumor growth by reducing stroma and altering tumor-stromal interaction in pancreatic cancer. Int J Oncol. 2016;48(4):1499–1508. doi:10.3892/ijo.2016.3374.
- Waisberg J, de Souza Viana L, Affonso Junior RJ, Silva SR, Denadai MV, Margeotto FB, de Souza CS, Matos D. Overexpression of the ITGAV gene is associated with progression and spread of colorectal cancer. Anticancer Res. 2014;34(10):5599–5608.
- Berghoff AS, Kovanda AK, Melchardt T, Bartsch R, Hainfellner JA, Sipos B, Schittenhelm J, Zielinski CC, Widhalm G, Dieckmann K, et al. αvβ3, αvβ5 and αvβ6 integrins in brain metastases of lung cancer. Clin Exp Metastasis. 2014;31(7):841–851. doi:10.1007/s10585-014-9675-0.
- Vogetseder A, Thies S, Ingold B, Roth P, Weller M, Schraml P, Goodman SL, Moch H. αv-integrin isoform expression in primary human tumors and brain metastases. Int J Cancer. 2013;133(10):2362–2371. doi:10.1002/ijc.28267.
- Li F, Liu Y, Kan X, Li Y, Liu M, Lu JG. Elevated expression of integrin αv and β5 subunit in laryngeal squamous-cell carcinoma associated with lymphatic metastasis and angiogenesis. Pathol Res Pract. 2013;209(2):105–109. doi:10.1016/j.prp.2012.11.001.
- van der Horst G, Bos L, van der Mark M, Cheung H, Heckmann B, Clément-Lacroix P, Lorenzon G, Pelger RC, Bevers RF, van der Pluijm G. Targeting of alpha-v integrins reduces malignancy of bladder carcinoma. PLoS One. 2014;9(9):e108464. doi:10.1371/journal.pone.0108464.
- Liu H, Radisky DC, Yang D, Xu D, Radisky ES, Bissell MJ, Bishop JM. MYC suppresses cancer metastasis by direct transcriptional silencing of αv and β3 integrin subunits. Nat Cell Biol. 2012;14(6):567–574. doi:10.1038/ncb2491.
- van den Hoogen C, van der Horst G, Cheung H, Buijs JT, Pelger RC, van der Pluijm G. Integrin αv expression is required for the acquisition of a metastatic stem/progenitor cell phenotype in human prostate cancer. Am J Pathol. 2011;179(5):2559–2568. doi:10.1016/j.ajpath.2011.07.011.
- Nemeth JA, Nakada MT, Trikha M, Lang Z, Gordon MS, Jayson GC, Corringham R, Prabhakar U, Davis HM, Bechman RA. Alpha-v integrins as therapeutic targets in oncology. Cancer Invest. 2007;25(7):632–646. doi:10.1080/07357900701522638.
- Yan H, Endo Y, Shen Y, Rotstein D, Dokmanovic M, Mohan N, Mukhopadhyay P, Gao B, Pacher P, Wu WJ. Ado-trastuzumab emtansine targets hepatocytes via human epidermal growth factor receptor 2 to induce hepatotoxicity. Mol Cancer Ther. 2016;15(3):480–490. doi:10.1158/1535-7163.MCT-15-0580.
- Hirsh DS, Shen Y, Wu WJ. Growth and motility inhibition of breast cancer cells by epidermal growth factor receptor degradation is correlated with inactivation of cdc42. Cancer Res. 2006;66(7):3523–3530. doi:10.1158/0008-5472.CAN-05-1547.