
ABSTRACT
For many protein therapeutics including monoclonal antibodies, aggregate removal process can be complex and challenging. We evaluated two different process analytical technology (PAT) applications that couple a purification unit performing preparative hydrophobic interaction chromatography (HIC) to a multi-angle light scattering (MALS) system. Using first principle measurements, the MALS detector calculates weight-average molar mass, Mw and can control aggregate levels in purification. The first application uses an in-line MALS to send start/stop fractionation trigger signals directly to the purification unit when preset Mw criteria are met or unmet. This occurs in real-time and eliminates the need for analysis after purification. The second application uses on-line ultra-high performance size-exclusion liquid chromatography to sample from the purification stream, separating the mAb species and confirming their Mw using a µMALS detector. The percent dimer (1.5%) determined by the on-line method is in agreement with the data from the in-line application (Mw increase of approximately 2750 Da). The novel HIC-MALS systems demonstrated here can be used as a powerful tool for real-time aggregate monitoring and control during biologics purification enabling future real time release of biotherapeutics.
Proteins are commonly known to aggregate; however, when used as drugs, protein aggregates can affect quality, safety, and efficacy. For biotherapeutics, aggregation may be generated at multiple steps in protein production, including fermentation, purification, formulation, and storage.Citation1 Various stress conditions, such as pH, light, mechanical, and thermal (heat or freeze/thaw), can contribute to aggregate formation.Citation2,Citation3 These aggregates can have adverse immune responses and may result in reduced efficacy.Citation4,Citation5
Aggregation is considered a product-related impurity, and aggregate level is an important critical quality attribute (CQA) that must be monitored and controlled. Thus, downstream purification unit operations to remove aggregate impurities are crucial to the development of safe and efficacious biologic drugs. Protein A affinity chromatography, commonly the first step in the monoclonal antibody (mAb) purification process, is capable of a large reduction of host cell proteins and DNA, but has poor selectivity for separating aggregates.Citation6 Ion exchange chromatography (IEX), size-exclusion chromatography (SEC), and hydrophobic interaction chromatography (HIC) are all further polishing steps that can decrease aggregate levels.Citation7 These purification methods must be carefully designed because aggregate removal often comes at the expense of yield. Peak cutting or loading is often kept conservative to minimize the risk of aggregate breakthrough in the effluent.Citation7,Citation8
Implementation of Process Analytical Technology (PAT) with protein purification can help assess the quality of the product. The Food and Drug Administration has encouraged the use of PAT to build quality into pharmaceutical manufacturing processes to ensure a consistent final product.Citation9,Citation10 In this study, we coupled a HIC purification system with light scattering (LS) as a PAT to monitor and control effluent aggregation levels in real time. Light scattering is a common technique for the physical characterization of proteins. It is one of the few absolute methods that can provide the weight-average molar mass, Mw, of the protein over a broad range.Citation11,Citation12 Multi-angle light scattering (MALS) is a static light scattering technique that measures the intensity of scattered light at different scattering angles. The measured intensity is proportional to Mw and concentration of the protein. The protein concentration can be measured using ultraviolet absorption (UV), differential refractive index, or salternate concentration determination methods. Analytical SEC is typically coupled with MALS to separate monomeric protein from the impurities such as aggregates, fragments, or truncated forms of the product and to identify the impurities.Citation13,Citation14 Without separation from SEC, LS cannot identify individual species and their molar mass, but changes in weight-average molar mass (Mw) relative to the desired final product provide valuable information that can be used to assess product quality. Furthermore, if the protein degradation pathway and product impurities are known a priori, Mw can be used to determine the percentage of each species present in a mixture. For example, if the protein is known to form only monomers and dimers that have certain molecular weights, the percentage of each species can be deconvoluted from the average Mw by treating it as a weighted average of the two species.
Although there is previous work in the literature that focuses on real time LS monitoring and control of polymer properties,Citation15,Citation16 this study is novel in that it uses LS as a PAT in a biopharmaceutical setting. Here, we monitored mAb aggregates in real time for a flowthrough HIC purification step. Since aggregates tend to be more hydrophobic than monomers, under certain buffer conditions, they can be retained on hydrophobic resins while the monomer flows through.Citation17,Citation18 However, as the column becomes saturated, aggregates will begin to break through and coelute with monomers in the flowthrough. Typically, during development of HIC steps, fractions are collected and analyzed via analytical SEC for impurity assessment, and the Mw and aggregate fraction confirmed by SEC-MALS. This step is both time-consuming and laborious, and it is performed after the purification has finished. Pooling decisions based on the amount of impurity and total protein yield are only then made. When screening different operation conditions (e.g., pH and salt concentrations), this greatly increases the time needed to develop a successful purification step. As demonstrated in our study, monitoring Mw and aggregate levels with MALS during purification steps in real time has the advantage of removing the laborious and time-consuming analysis of offline fractions. At the production level, the MALS setup has the added benefit of additional quality assurance. This approach is particularly beneficial to address variability that can occur across lots for batch processes and within lots for continuous processes where increases in aggregate levels can be quickly detected with MALS. Further, loading limits for flowthrough steps can be more aggressive because loading can be continued until a specified aggregate level is observed in the breakthrough. This maximum usage of a resin’s aggregate binding capacity can reduce the number of cycles and buffers needed for processing batches.
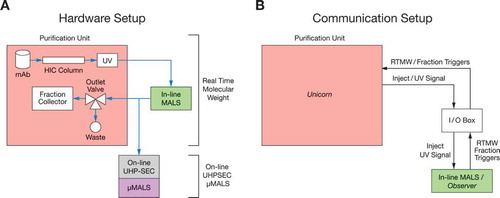
Here, we present two PAT applications using LS to monitor and control the biologics purification process. To the best of our knowledge, this is the first description of such applications in literature. As shown in , the purification unit is equipped with a HIC purification column where the sample is detected in-line by a MALS detector that measures Mw in real time and an on-line ultra-high performance size-exclusion liquid chromatography with µMALS (on-line UHP-SEC-µMALS) that samples and measures aggregate content and Mw. For the in-line application, the protein from the purification unit flows directly into the MALS, and then back into the purification unit for fractionation. This eliminates the need to sample while providing Mw data instantaneously with automated feedback control in real time. The in-line experiment does not rely on analytical SEC separation. Conversely, the on-line experiment uses an on-line liquid chromatography systemCitation19 to automatically and directly sample the purification process every 5 min using the process pump of the UPLC. The types and amount of aggregates are determined by separation on SEC-UV and Mw of the different mAb species are determined by µMALS. shows the communication signals between the in-line MALS and the purification unit.
Figure 1. Experimental setup of both hardware and communication of coupling light scattering with purification system.
a). The MALS detector was connected in-line, downstream of the purification unit. HIC purified samples were also sampled downstream of the in-line MALS by on-line UHPLC. On-line UHP-SEC-µMALS served as another application to monitor the fraction and molar mass of aggregates. The samples were separated by analytical SEC and evaluated using a UHP-SEC capable multi-angle light scattering detector (µMALS) and UV signal of the on-line UHPLC as the concentration source. b) The start or inject signal and the UV signal from the purification unit were sent to the in-line MALS via an I/O Box. The UV signal of the purification unit was the concentration source used to calculate Mw of the protein eluted from the HIC column. Real time molecular weight and start/stop trigger signals were sent by the in-line MALS detector to the purification system (via a voltage signal) for fractionation when the measured Mw fell between preset Mw ranges.
Flowthrough HIC chromatography was performed to purify mAb A and specifically remove aggregates. The real time data from the flowthrough HIC purification run connected to in-line MALS is shown in . The concentration signal (---) is plotted on the right y-axis and the measured average molecular weight (—) is plotted on the left y-axis. Trigger signals, based on the preset Mw criteria, are indicated by the (- - -) where the start is 27.8 min and stop is 76.6 min. The trigger signal shows when the MALS detector communicated with the purification unit to change the outlet valve position to collect/discard the material using an on/off or 2V/0V voltage signal, respectively. In flow-through HIC chromatography, the more hydrophobic aggregates retain to the column while the early eluate is mainly monomeric mAb. As the column saturates and higher molecular weight species break through with the monomeric antibody, the Mw increases. The results show Mw increase of ~ 2750 Da as the collection starts at approximately 145.9 kDa and ends at approximately 148.7 kDa, which is expected based on the preset Mw criteria. Once the protein flows into the in-line MALS detector, the Mw is instantly calculated (< 1 s) and the outlet valve of the purification unit is given a signal to collect or discard the material. The initial 20 to 23 min region of the purification run results in a lower than expected Mw, due to rapidly changing concentration. Rapid changes in concentration can affect the MALS results if the delay volume and fluid dispersion parameters between the concentration detector and MALS detector are not accounted for and well established. The degree of impact we observed could be improved upon through advanced characterization of the system, but in general the method will have challenges at the leading edge where concentration changes very rapidly. At the leading edge, it may be optimal to trigger based on combined Mw and concentration criteria. The rapidly changing concentration is also a challenge in the chase step and can cause unreliable Mw. After reaching the high Mw trigger (76.6 min), collection was stopped, and the chase phase of the HIC purification was begun at approximately 85 min. Since the purpose of flowthrough HIC described here was to load the column to its maximum acceptable aggregate capacity (based on Mw criteria), the product of the chase step was not collected, but LS and concentration data were collected for future optimization of the assay.
Figure 2. Real time MALS data from a HIC purification.
a). The concentration and Mw signals are plotted along with the trigger signals. Throughout the purification, there is an increase in Mw (—) as aggregates saturate the HIC column and dimers coelute with the monomers. The protein is eluted from the column and passes through both the UV and in-line MALS detectors. The Mw is calculated in < 1 s using both the UV and light scattering signal and a start/stop trigger (- - -) is sent to the purification unit when the protein meets the preset Mw criteria. The concentration is calculated from the UV detector of the purification unit (---). b) No significant differences were observed between the data from real time (—) and post processed modes of analysis (---).
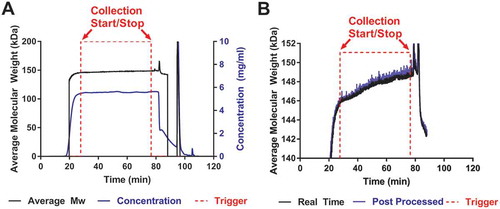
To compare the validity of the real time molecular weight (RTMW) data, conventional post processing software was also used to collect the data. The RTMW data (—) are similar to the post-processed data (---), as seen in . The post-processed data are captured using the same LS detector, but analyzed after the purification run has ended using conventional software, while RTMW data are calculated and captured in real time during the purification run. The real time run eliminates the need to fractionate and analyze the samples offline. The time lost during these steps can also be crucial if the protein is unstable in high salt buffers. Most importantly, the time saved by eliminating offline sample collection analysis can speed up the development of purification steps. More potential operating conditions can be screened in a shorter time without the need to wait for sample analysis turnaround.
The LS detector and RTMW software are also readily integrated to existing processes. The in-line aspect and high chemical compatibility of the detector make it easy to sanitize with the already pre-existing cleaning procedures for purification skids. The detectors also come with two different flow cell options: 1) the standard flow cell able to accept flow rates of 0.1 – 100 mL/min and pressures up to 65 bar; and 2) a special order flow cell for flow rates of 0.01 – 5 L/min and pressures up to 40 bar. Lastly, the prototype Observer software provides a real-time graphical representation of Mw, is designed to give clear go/no-go feedback to a technical level operator, and is designed for extension to 21CFR11 compliance, which would then make it suitable for GMP use.
On-line UHP-SEC-µMALS was used to determine the accuracy of the above data in addition to providing another PAT application to quickly monitor downstream processing steps. Samples from the HIC purification were drawn downstream of the in-line MALS detector by on-line UHPLC, and monomers and high molecular weight species (HMW) were separated on UHP-SEC and further analyzed using a µMALS detector (). shows the % HMW (▲, mainly dimeric) data from the on-line experiment correlated well with the RTMW data (—) from the in-line experiment. RTMW data showed the Mw increase of ~ 2750 Da between the start and stop fractionation signal (- - -). On-line UHP-SEC-µMALS was used to sample throughout the purification run and the aggregate content increase plotted in . The HMW species between the start and stop trigger signals increased from ~ 0% to ~ 1.5% (). shows representative SEC chromatograms from the beginning and end of the HIC purification (circled % HMW points in ), clearly displaying the increase in % HMW species. The SEC-µMALS profile ( inset) of the 76.6 min time point confirmed the molecular weight of the monomer species as approximately 148,500 kDa and the HMW was identified as a dimeric species with a molecular weight of approximately 307,000 kDa.
Figure 3. On-line UHP-SEC-µMALS data correlates well with the real time Mw data from in-line MALS.
a) Real time molecular weight (—) shown previously is rescaled to show the increase in Mw of ~ 2750 Da. The HMW content (▲) increases by 1.5% over the course of the purification as determined by on-line UHP-SEC-µMALS. b) On-line UHP-SEC chromatograms of the samples at the start and stop trigger points showed an increase in aggregate content of 1.5%. On-line UHP-SEC-µMALS data confirmed the HMW content to be dimeric (inset). The 1.5% dimeric content correlates to a Mw increase of mAb by ~ 2250 Da. The real time data showed an increase of ~ 2750 Da and is within 0.5% dimeric content of the on-line UHP-SEC-µMALS data.
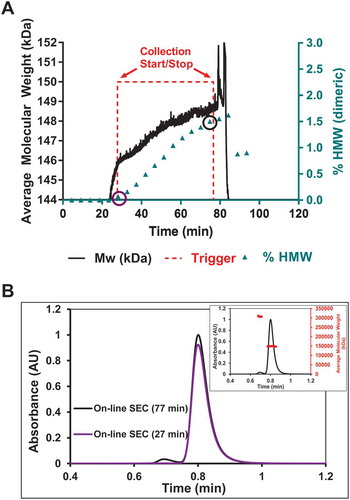
As shown in , the in-line measurements of overall weight-average molar mass agrees with on-line measurements of aggregate content and aggregate identity across the region of interest in the HIC purification. Collection is stopped at the appropriate trigger, namely when the weight average molar mass has increased from a value that is representative of 100% monomer to a value that is corresponds to a solution containing 98.5% monomeric species and 1.5% dimeric species. Notably, this measurement is performed in-line without the need for additional separation by SEC. In this case, we measured a 2750 Da increase by in-line MALS, which is comparable to the theoretical increase of 2250 Da. The presence of 1.5% HMW species was validated by on-line measurements. One possible reason for the small difference in Mw between the in-line and on-line experiments could be due to low concentrations of oligomers that were below the limit of detection of the AKTA UV detector, but have a large contribution of Mw. Additionally, there is a slight difference in timing of the sample by on-line UHPLC and when the stop trigger occurred. Future studies will investigate the relationship between run-to-run precision and accuracy and the accuracy of the relative change in Mw over the course of the purification. Regardless, the accuracy of the method for this experiment between the in-line MALS and on-line UHP-SEC was well within 0.5% dimer content. With this level of correlation, in-line MALS can ensure minimal aggregation in the product and control the purification process.
The in-line method offers automation of the analysis using the real-time software with feedback control, which is a big advantage for further implementation into process development and eventually production. The ability to calculate RTMW using in-line MALS can also improve how a downstream purification step is operated. Loading for flowthrough steps is often kept conservative to minimize risk of aggregate breakthrough in the effluent. We have shown here that we can circumvent this by monitoring the increase in weight-average molar mass for HIC purification steps in real time. A threshold Mw can be determined as needed based on process requirements and then converted to a corresponding % HMW increase, assuming the aggregation profile of the molecule is known. For this work, the collection of flowthrough ended only when the predetermined Mw range was increased by 2750 Da. This strategy can enable dynamic loading where a column loading is not based on a predetermined amount, but instead loaded until a specific tolerance of HMW species is reached. The maximum usage of a column/resin’s HMW binding capacity can reduce the number of cycles required for the same output, and thus reduce buffer requirements for processing of batches. Finally, additional quality assurance can be met because perturbations in a process that increase HMW could potentially be captured immediately with either of the PAT means mentioned above.
Spectroscopic PAT tools are used to assess the raw materials in the media feed in biologics production, as well as to control cell culture feeds in upstream bioprocessing. These technologies, however, are limited in providing information about the biotherapeutic CQAs (typically require on-line LC for CQA information). In-line light scattering is the first PAT to determine the CQA of average Mw in real time without the need for sampling or additional analytical separation. The opportunities in this space include expansion into broader development utilization of in-line light scattering for process understanding and control. Additionally, development of pilot scale capability for RTMW could enable process monitoring and feed forward and feedback control across the biopharmaceutical manufacturing process including continuous processing. Efforts are ongoing to scale up this technology for clinical and commercial process development and supply. The on-line UHP-SEC-µMALS work is also a suitable method to accurately determine the aggregate species because it uses the separation power of analytical SEC; however, improvement in aseptic connections for direct connection to the process is needed. The integration of RTMW as PAT for biotherapeutics demonstrates further advancement within the quality by design (QbD) framework of building quality into products. As technologies for in-line real time CQA monitoring and control continue to expand it lays the foundation for real time release of biotherapeutics.
Samples and reagents
The IgG1 mAb A was produced under stably transfected CHO-GS cell line (Lonza, Slough, U.K.). Sodium phosphate dibasic heptahydrate, sodium phosphate monobasic monohydrate, sodium sulfate and sodium chloride were obtained from Millipore Sigma (St. Louis, MO, U.S.A.). Sodium hydroxide and bovine serum albumin (BSA) standard was received from Thermo Fisher Scientific (Waltham, MA, U.S.A.). Toyopearl Butyl-650M resin was obtained from Tosoh Bioscience (Tokyo, Japan). The resin was packed in a 20 cm height by 0.34 cm diameter Omnifit glass column from Diba Industries (Danbury, CT, U.S.A.). The purification system used for the HIC chromatography was an AKTA Avant 25 from GE Healthcare Life Sciences (Uppsala, Sweden). Deionized water (18 MΩ) from a Milli-Q purification system (Millipore Sigma, MA, U.S.A.) was used to dissolve chemicals and served as a diluent for all experiments.
Flowthrough HIC purification with real time MW by in-line MALS
Prior to HIC purification, Protein A was used to capture mAb A and anion exchange purification was used to remove impurities, such as host cell proteins and DNA, similar to methods previously described.Citation7 The impurity levels for host cell proteins by ELISA were < 50 ng/mg and residual DNA by qPCR was below the limit of quantitation of the assay. The AEX protein product was then diluted from 10 to 4.5 mg/mL with 1.4 M sodium sulfate, pH adjusted with 1 M Tris base (Tris (hydroxymethyl)aminomehtane), and 0.2 µm filtered to make the HIC load.
Prior to loading, the HIC column was sanitized with 0.5 N NaOH for 3 column volumes (CV) and then equilibrated with 5 CV sodium phosphate buffer with sodium sulfate at moderate ionic strength. The protein solution was then directly loaded on the column at 150 mg/mL loading. All flow velocities were at 300 cm/hr. Unicorn software 6.3 (GE Healthcare, Sweden) was used to control the AKTA Avant 25 for purification. The eluent of the HIC column flowed through the AKTA UV detector and miniDAWN TREOS MALS detector (Wyatt Technology, Santa Barbara, CA USA) for molecular weight determination and then back into the outlet valve of the AKTA unit. All detectors were connected in-line via 1/16” x 0.02” ID PEEK tubing. The TREOS was re-plumbed using 0.04” ID tubing to reduce the backpressure on the column.
Signals were sent between the AKTA Avant and the miniDAWN TREOS MALS detector via an AKTA I/O Box E9. An auto-inject or start/pulse signal from the AKTA to the TREOS triggered the beginning of data collection. The UV signal from the AKTA was used as the concentration source along with the extinction coefficient of mAb A (1.39 mL mg−1 cm−1). The linearity and accuracy of the AKTA Avant UV detector was found to be comparable to a standalone UV spectrophotometer up to 5 mg/ml in concentration. The MALS detector sent a voltage proportional to Mw and a fraction trigger signal to the AKTA Avant, which physically changed the valve position to fractionate when the preset molecular weight criteria were met. The trigger was off (voltage = 0 V) when the criteria was unmet and on (voltage = 2 V) when met. The on/off voltage signal was set as the fractionation criteria in the Unicorn software for the AKTA Avant. Prototype Observer software (Wyatt Technology, Santa Barbara, CA) collected and analyzed the light scattering and concentration data for real time determination of Mw. In addition, post-process data processing analyses were performed with ASTRA 6 (version 6.1.7.17; Wyatt Technology, Santa Barbara, CA).
Prior to performing RTMW experiments, several experimental parameters were determined. The delay volume between the UV detector (280 nm) and the LS detector was calculated by running BSA on a Superdex 200 10/300 GL (GE Healthcare, Sweden) with an isocratic elution at 0.5 mL/min and phosphate buffered saline pH 7.2 (Thermo Fisher Scientific, Waltham, MA) as mobile phase. The time it took the protein to reach the in-line MALS detector from the UV detector of the purification unit was 15 s. This delay time is directly related to the flow rate of the purification. Inter-detector band broadening and alignment parameters were determined using the algorithms in Astra 6 software. A scouting HIC purification run was performed to identify stable regions for baseline subtraction that are needed for accurate Mw determination. The data were processed using ASTRA 6 to determine the molecular weight range of the protein and to set the appropriate molecular weight criteria for trigger events. The absolute refractive index (aRI) of the HIC buffer was determined using two independent Optilab T-rEX refractive index detectors (Wyatt Technology). The aRI of the buffer relative to pure water was used to calculate a dn/dcCitation20 of 0.175 mL/g for mAb A in the HIC purification buffer sodium sulfate. Following the method development work described above, Mw was found to be consistent across different eluting concentrations, indicating that the second virial coefficient (A2) contribution was small enough to be ignored. The Mw of mAb A determined by MALS was within 3% of the expected Mw. All the parameters determined by ASTRA in the HIC scouting run, including the preset molecular weight range, were transferred to Observer for the real-time purification run.
Using Observer, the HIC purification was performed again with the preset criterion to monitor the average molecular weight and control the process. A trigger was sent to the AKTA Avant for fractionation purposes when the conditions set in Observer were met. The preset criteria included the molecular weight of 145,500 – 148,000 kDa with a 500 Da hysteresis and 20 consecutive points that must meet the trigger requirement.
On-line UHP-SEC-µMALS
PATROL UPLC from Waters (Milford, MA) equipped with a photo-diode array (PDA) detector and Empower chromatography data collection system was connected using a T-connection between the in-line MALS detector and the AKTA outlet valve. While performing the HIC flowthrough, samples were drawn from the purification stream using the process pump of the process sample manger on the UPLC and run on-line every 4 min 40 sec. Each sample was separated by UHP-SEC followed by analysis by µMALS. The sample draw and delivery rates were 1 mL/min, and a fixed injection volume of 10 µL was injected on a custom Waters BEH 200 SEC column 4.6 x 75 mm. The volume from the purification process that was drawn by the on-line LC for each injection was 1 mL. The large volume was drawn for adequate washing of the loop and to ensure the most representative sample was analyzed. The elution of the mAb from the column was performed using an isocratic elution at 0.75 mL/min flow rate using 100 mM sodium phosphate, 100 mM NaCl pH 7.0. The column temperature was 30°C and the run time was 2 min. After the separation, the effluent flowed through the Waters PDA detector (280 nm) and µDAWN multi-angle light scattering detector (Wyatt Technology, Santa Barbara, CA). The SEC chromatograms were integrated to calculate % monomer and % HMW (high molecular weight) species. The light scattering and concentration data were analyzed in ASTRA to determine molecular weight. Inter-detector band broadening and alignment were applied using the algorithms in ASTRA 6 using BSA protein standard according to manufacturer-recommended methods. The dn/dc used was 0.185 mL/g since phosphate buffer was used for SEC. The Mw of mAb A (monomer and HMW) determined by µDAWN measured was within 3% of the expected Mw.
Abbreviations
| CQA | = | critical quality attribute |
| HIC | = | hydrophobic interaction chromatography |
| HMW | = | high molecular weight |
| IEX | = | ion exchange chromatography |
| LS | = | light scattering |
| MALS | = | multi-angle light scattering |
| µMALS | = | micro multi-angle light scattering |
| Mw | = | weight-average molar mass; |
| on-line LC | = | on-line liquid chromatography |
| PAT | = | process analytical technology |
| RTMW | = | real time molecular weight |
| SEC | = | size-exclusion chromatography |
| UHP-SEC | = | ultra-high performance size exclusion chromatography |
| UV | = | ultraviolet |
| QbD | = | quality by design |
Conflict of Interest
Merck & Co, Inc. does not have any conflict to disclose. Wyatt Technology Corporation along with other similar manufacturers would benefit if light scattering methods are adopted within a PAT framework.
Acknowledgments
The authors would like to thank collaborators from MRL Bioprocess Development.
References
- Vazquez-Rey M, Lang DA. Aggregates in monoclonal antibody manufacturing processes. Biotechnol Bioeng. 2011;108(7):1494–1508.
- Cromwell ME, Hilario E, Jacobson F. Protein aggregation and bioprocessing. AAPS J. 2006;8(3):E572–9. doi:10.1208/aapsj080366.
- Mason BD, Schöneich C, Kerwin BA. Effect of pH and light on aggregation and conformation of an IgG1 mAb. Mol Pharm. 2012;9(4):774–790. doi:10.1021/mp2004719.
- Moussa EM, Panchal JP, Moorthy BS, Blum JS, Joubert MK, Narhi LO, Topp EM. Immunogenicity of therapeutic protein aggregates. J Pharm Sci. 2016;105(2):417–430. doi:10.1016/j.xphs.2015.11.002.
- Rosenberg AS. Effects of protein aggregates: an immunologic perspective. AAPS J. 2006;8(3):E501–E507. doi:10.1208/aapsj080359.
- Evans W. Removing aggregates in monoclonal antibody purification. Pharm Technol. 2015;39(3):72–74.
- Liu HF, Ma J, Winter C, Bayer R. Recovery and purification process development for monoclonal antibody production. mAbs. 2010;2(5):480–499.
- Shukla AA, Hubbard B, Tressel T, Guhan S, Low D. Downstream processing of monoclonal antibodies—application of platform approaches. J Chromatogr B. 2007;848(1):28–39. doi:10.1016/j.jchromb.2006.09.026.
- Center for Drug Evaluation and, R.; Center for Veterinary, M.; United States. Food and Drug Administration. Office of Regulatory, A. Guidance for industry [electronic resource]: PAT, a framework for innovative pharmaceutical development, manufacturing, and quality assurance; Rockville, MD: 2004 Sep [accessed 2018 May 14. https://www.fda.gov/downloads/drugs/guidances/ucm070305.pdf.
- Rathore AS, Bhambure R, Ghare V. Process analytical technology (PAT) for biopharmaceutical products. Anal Bioanal Chem. 2010;398(1):137–154. doi:10.1007/s00216-010-3781-x.
- Folta-Stogniew E, Williams K. Determination of molecular masses of proteins in solution: implementation of an HPLC size exclusion chromatography and laser light scattering service in a core laboratory. J Biomol Techniques. 1999;10(2):51–63.
- Wyatt PJ. Light scattering and the absolute characterization of macromolecules. Anal Chim Acta. 1993;272(1):1–40. doi:10.1016/0003-2670(93)80373-S.
- Bouvier ESP, Koza SM. Advances in size-exclusion separations of proteins and polymers by UHPLC. Trends Anal Chem. 2014;63:85–94. doi:10.1016/j.trac.2014.08.002.
- Fekete S, Beck A, Veuthey JL, Guillarme D. Theory and practice of size exclusion chromatography for the analysis of protein aggregates. J Pharm Biomed Anal. 2014;101:161–173. doi:10.1016/j.jpba.2014.04.011.
- Hungenberg KD, Reed WF. Online monitoring, control, and optimization of polymer reactions and processes. Macromolecular React Eng. 2017;11(4). doi:10.1002/mren.201700030.
- McAfee T, Leonardi N, Montgomery R, Siqueira J, Zekoski T, Drenski MF, Reed WF. Automatic control of polymer molecular weight during synthesis. Macromolecules. 2016;49(19):7170–7183. doi:10.1021/acs.macromol.6b01522.
- Chen J, Tetrault J, Ley A. Comparison of standard and new generation hydrophobic interaction chromatography resins in the monoclonal antibody purification process. J Chromatogr A. 2008;1177(2):272–281. doi:10.1016/j.chroma.2007.07.083.
- Yuefeng L, Brian W, Ronald G. Recent advancement in application of hydrophobic interaction chromatography for aggregate removal in industrial purification process. Curr Pharm Biotechnol. 2009;10(4):427–433.
- Patel BA, Pinto NDS, Gospodarek A, Kilgore B, Goswami K, Napoli WN, Desai J, Heo JH, Panzera D. Pollard D and others. On-line ion exchange liquid chromatography as a process analytical technology for monoclonal antibody characterization in continuous bioprocessing. Anal Chem. 2017;89(21):11357–11365. doi:10.1021/acs.analchem.7b02228.
- Mori S, Barth HG. Size exclusion chromatography. Berlin: Springer; 1999.