
ABSTRACT
Charge variant analysis is a widely used tool to monitor changes in product quality during the manufacturing process of monoclonal antibodies (mAbs). Although it is a powerful technique for revealing mAb heterogeneity, an unexpected outcome, for example the appearance of previously undetected isoforms, requires further, time-consuming analysis. The process of identifying these unknowns can also result in unwanted changes to the molecule that are not attributable to the manufacturing process. To overcome this, we recently reported a method combining highly selective cation exchange chromatography-based charge variant analysis with on-line mass spectrometric (MS) detection. We further explored and adapted the chromatographic buffer system to expand the application range. Moreover, we observed no salt adducts on the native protein, also supported by the optimal choice of MS parameters, resulting in increased data quality and mass accuracy. Here, we demonstrate the utility of this improved method by performing an in-depth analysis of adalimumab before and after forced degradation. By combining molecular mass and retention time information, we were able to identify multiple modifications on adalimumab, including lysine truncation, glycation, deamidation, succinimide formation, isomerisation, N-terminal aspartic acid loss or C-terminal proline amidation and fragmentation along with the N-glycan distribution of each of these identified proteoforms. Host cell protein (HCP) analysis was performed using liquid chromatography-mass spectrometry that verified the presence of the protease Cathepsin L. Based on the presence of trace HCPs with catalytic activity, it can be questioned if fragmentation is solely driven by spontaneous hydrolysis or possibly also by enzymatic degradation.
Introduction
The development and manufacture of therapeutic monoclonal antibodies (mAbs) is a highly regulated process for which guidelines from the International Conference on Harmonisation and regulatory agencies state the levels of heterogeneity allowed in a biopharmaceutical product.Citation1 MAbs and related products are subject to a wide variety of modifications including glycosylation, lysine truncation, oxidation, deamidation, disulfide bond scrambling, fragmentation, aggregation, glycation, isomerization and pyroglutamate formation.Citation2 Some modifications can affect drug efficacy and safety, and can thus be considered critical quality attributes (CQAs). CQAs are directly related to the components present in and the physiochemical conditions of the cell culture media at the time of fermentationCitation1,Citation3–Citation6 and can be influenced by critical process parameters. To assess product quality, it is therefore mandatory to closely monitor CQAs, using adequate analytical techniques that utilise differences in physicochemical properties of the analytes, such as size, surface charge or hydrophobicity.
The surface charge of a mAb can be subject to change by several of the modifications mentioned above, either by providing or depleting acidic or basic residues or by changing protein higher order structure.Citation7 This surface charge diversity has been utilised in the past to analyse mAb heterogeneity with charge sensitive methods, most notably cation exchange chromatography (CEX). CEX can be used in either salt gradient or pH-gradient elution mode, which is the chromatographic equivalent to isoelectric focusing.Citation8–Citation10 Both modes have been applied successfully and were subject to a series of comparison studies with diverse outcomes.Citation11–Citation13 In industry, charge variant analysis (CVA) is commonly used for direct comparison of different product batches to ensure consistent product quality. Recently CVA, applying both weak cation exchange (WCX) and strong cation exchange (SCX) chromatography, was used in a process analytical technology (PAT) framework as a powerful tool to control and optimise upstream and downstream processing.Citation14 While well suited for comparability studies, one limitation is the necessity to perform elaborate sample preparation procedures and follow-up experiments for initial identification of the peaks and in case of any out-of-specification events. These experimental procedures usually involve peak collection followed by buffer exchange to allow further analysis, which can be time consuming and costly.Citation15 More importantly, these procedures are a possible source for sample preparation-induced modifications.
For this reason, intensive efforts were undertaken to hyphenate CVA to mass spectrometric (MS) detection using complex approaches, e.g., 2-dimensional (2D)-liquid chromatography (LC) hyphenated to time-of-flight (ToF)-MS.Citation16 Other approaches relied on on-line hyphenation employing various buffer solutions.Citation17–Citation19 Each of these attempts showed useful application; nonetheless, either an elaborate instrumental setup, an insufficiently stable pH gradient or poor MS data quality make these methods unsuitable for generic applicability. Recently, we developed a powerful tool for on-line CVA-MS using volatile buffers that has been shown to provide a stable pH gradient, hence facilitating CVA of multiple, commercially available mAb drug products using Orbitrap™-based MS detection.Citation20 Even though appropriate method parameters facilitated antibody variant annotation with mass accuracies of >10 parts per million (ppm), the method suffered from the presence of adducts caused by the nature of the buffer system and the electrospray ionisation (ESI)-source parameters applied.
We further examined the properties of this volatile buffer system and became aware of a limitation on the analysis of mAbs with high isoelectric points (pI). Here, we present a modified buffer system with an expanded application range, enabling the analysis of highly basic mAbs like rituximab or the NIST reference antibody. In addition, by applying the optimal settings for MS data acquisition, we completely mitigated the occurrence of adduction, resulting in a more generic and sensitive method for quick and thorough analysis of mAb heterogeneity. We demonstrate that data acquisition strongly benefits from higher resolution settings when discrimination of co-eluting near isobaric substances is required. Furthermore, we demonstrate the power of this improved CVA-MS method by performing an in-depth characterisation of adalimumab before and after forced degradation. Adalimumab was recently subjected to batch-to-batch and originator-to-biosimilar comparison experiments.Citation21,Citation22 In these studies, glycan profiling indicated a dominance of G0F and G1F glycans and the most frequent glycoforms were shown to be G0F/G0F, G0F/G1F and G1F/G1F or G0F/G2F. CVA performed in the course of batch-to-batch comparison revealed the presence of highly abundant basic species, attributed to different C-terminal lysine forms. The same analysis also revealed the presence of minor acidic species, which were, however, unidentified.
Using our native CVA-MS approach, we were able to obtain very high chromatographic resolution and successful identification of the majority of the 16 charge variants observed. Among them were proteoforms modified by different levels of C-terminal lysine truncation, deamidation, succinimide aspartic acid (Asp) formation, glycation and fragmentation. To investigate whether host cell proteins (HCPs) might be involved in the fragmentation of adalimumab, we performed an HCP analysis employing peptide mapping. Several HCPs were detected, among them the protease Cathepsin L, which could suggest the occurrence of the detected fragments to partly be due to enzymatic proteolysis. Carboxypeptidase B (CpB) digestion and peptide mapping experiments were performed as orthogonal methods to confirm the results obtained on the intact protein level.
Results
Adjustment of the CVA-MS buffer system
We recently presented a CVA-MS method that is based on volatile chromatographic buffers with relatively low ionic strength that enable on-line Orbitrap mass spectrometric detection of charge variants of multiple mAbs.Citation20 A feature of the method is the use of low ionic strength eluents, which are a prerequisite for successful MS detection, but which exhibit relatively low buffering capacity. In the course of the previous study, we also reported a buffering effect of the strong cation exchange (SCX) stationary phase used, which can resist pH changes especially in the higher pH range.
Buffer B was originally prepared with a pH of 10.18. The pH delivered on column, however, did not exceed 9.7 when measured with an on-line pH meter. This discrepancy did not compromise the analysis of mAbs with apparent pI-values ≤9.1; mAbs exceeding this isoelectric point have not been tested. To further investigate the operational pI-range, two mAbs with high isoelectric points, the NIST reference antibody (pI = 9.2) and rituximab (pI = 9.4) were included into the sample set.Citation23
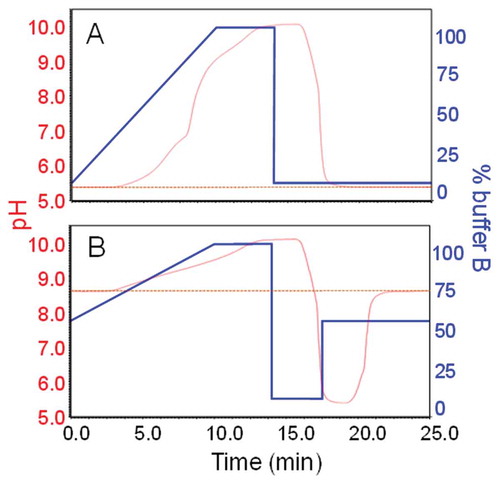
Using the original setup, CVA-MS analysis of these 2 mAbs resulted in only partial elution of charge variants. We concluded that the use of the original buffer system was limited to mAbs with pI values of <9.2. Consequently, the original buffer B pH was adjusted from ~10.2 to ~10.9, which resulted in a pH-range of ~5.3 to ~10.2 covered by the buffer system used (). The drawback of the higher pH buffer was a slightly longer re-equilibration time. When using a standard equilibration procedure, we found that the time required for re-equilibration was heavily dependent on the gradient starting condition required for the proximate run (data not shown). We compensated for this by using dual-step equilibration where we rapidly reduced the pH by flushing with 100% buffer A before adjustment to the desired pH conditions (). That this procedure enables full column equilibration, which is the prerequisite for reproducibility, is shown in , where starting conditions were set to the pH equalling 50% buffer B.
Figure 1. A.) Gradient from 0–100% buffer B in 10 minutes followed by 4 minutes of column flushing and 12 minutes of column equilibration. Twelve minutes of column equilibration are equalling ~28 column volumes at a flow rate of 0.4 mL min−Citation1. The buffer pH was monitored in real-time over the full duration of the run and is represented by the red profile. The pH trace indicates the chromatographic system to cover a pH-range of ~5.3 to ~10.2. B.) pH trace indicating full column equilibration exemplarily shown for gradient starting conditions of 50% buffer B. By the application of a 2-step equilibration procedure, full column equilibration was achieved in less than 10 minutes.
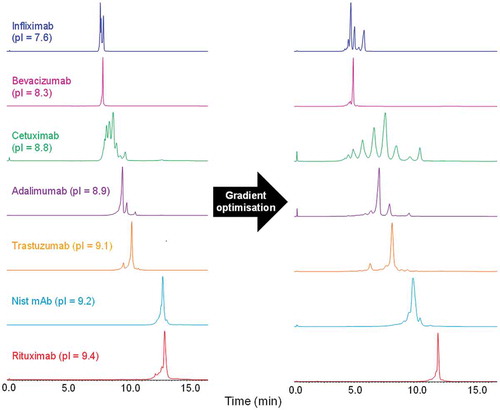
To demonstrate the utility of this buffer system, we developed chromatographic methods for CVA-MS analysis of seven different mAbs. For the majority of the mAbs studied, a method was established within three chromatographic injections by stepwise customisation of the gradients applied while keeping the total gradient time constant at 10 minutes. The benefits of individual gradient optimisation are demonstrated in . The majority of the mAbs tested showed a marked increase in the number of distinguishable charge variant peaks. The pI values shown in have previously been determined via imaged capillary isoelectric focusing by Goyon et al.Citation23
Figure 2. A.) Charge variant separation of seven monoclonal antibodies using a gradient from 0–100% buffer B in 10 min. B.) Charge variant separation after individual gradient optimisation. Instrument settings and gradients used for all mAbs are provided in the methods section.
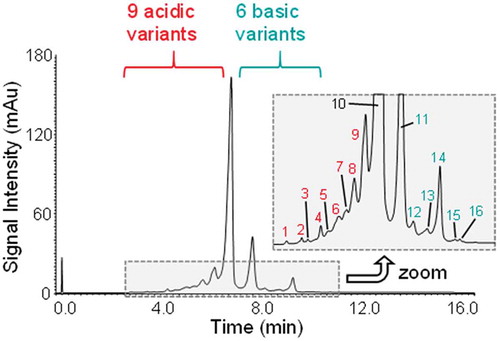
The ultra-high performance liquid chromatography (UHPLC)-setup used in this study is fully MS friendly and provides excellent chromatographic selectivity. For most of the mAbs analysed, this results in a variety of fully and partially resolved peaks. One good example is adalimumab, which exhibits a relatively complex charge variant pattern with a high number of low abundant peaks. The chromatogram obtained by method optimisation was analysed in more detail, and is shown in . Magnification of the low abundant peaks shows nine acidic-, six basic- and the main variant. This heterogeneity and the excellent separation observed made adalimumab our candidate of choice for subsequent intact mass and retention time-based peak annotation following MS detection.
Figure 3. UV-chromatogram highlighting the charge variant separation of adalimumab. Sixteen different species were separated as detailed in the zoom window. The data were acquired using the optimised gradient for adalimumab ().
Impact of MS resolution settings
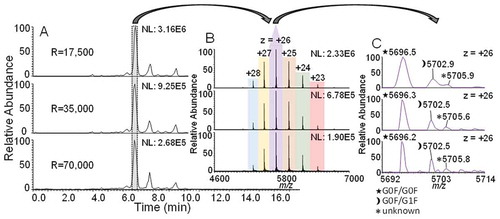
One hundred µg of adalimumab were analysed with MS resolution settings of 17,500, 35,000 and 70,000. shows a comparison of the MS base peak chromatograms (BPCs) and the averaged spectra obtained for the main adalimumab charge variant. The BPCs generated with all three resolution settings look highly similar and also closely resemble the chromatograms acquired with fluorescence detection shown in Figure S1 of the Supporting Information.
Figure 4. A.) BPCs of adalimumab at resolution settings 17,500, 35,000 and 70,000. B.) Mass spectra of the main variant peak. Different charge states are color coded and labelled. MS signal intensities reflected by the normalized level (NL) for the BPCs and the charge state envelopes are included in top right of images. C.) Magnification of charge state + 26 with labels of the three most abundant isoforms. Peaks are assigned by three symbols, a legend can be found on the bottom left.
The optimal resolution setting generally depends on several physical parameters: the molecular mass, charge state and collisional cross section of the ions, as well as the pressure regime inside the mass spectrometer, relating to the pressure during ion trapping and mass detection. These factors affect the stability, i.e., the lifetime of analyte ions in the Orbitrap, resulting in rather fast signal decay of protein ions. As large and heavily modified protein ions cannot be isotopically resolved, it is generally advised to start with the lowest available resolution setting that translates directly into a short transient detection time and maximum sensitivity. Increasing the resolution setting by one or two steps may sometimes help to resolve adducts or near-isobaric species. However, increasing the resolution setting will result in decreased intensity. The lowest resolution setting therefore results in the maximum intensity and with that sensitivity, whereas higher resolution settings will result in resolved species close in mass-to-charge ratio (m/z), but at the cost of slightly decreased intensity.Citation24 Thus, the optimal resolution setting is a fine balance between sensitivity and resolving all species close in m/z and very much depends on the composition and complexity of the sample.
We have recently shown that the use of a higher resolution setting can benefit correct mass assignment with co-eluting near isobaric species, such as unmodified and adducted species of the same isoform.Citation20 In this study, we modified ESI source parameters with regards to the application of a higher setting for source-induced collision induced fragmentation (SID). This in consequence led to a complete abolishment of adducted species that were formerly described when a comparatively low SID setting was used. Irrespective of the occurrence of adduction, we demonstrate that higher resolving power can also be beneficial for the differentiation of two near isobaric substances that co-elute from the SCX stationary phase by chance. However, for also capturing the very low abundant species analysed in this study, we found the resolution setting of 35,000 to be the optimal setting.
The main adalimumab CVA peak, which is highlighted in , corresponds to the antibody charge variant missing both C-terminal lysine residues of the Fc region. The two most dominant glycoforms were determined to be G0F/G0F and G0F/G1F. The lower abundant G0F/G1F glycoform in the spectral magnification in (m/z = 5,702.9) is near-isobaric with a co-eluting species that cannot properly be resolved at a resolution setting of 17,500. The insufficient resolving power affects the m/z value of this variant, as well as the average mass obtained after deconvolution with a 56 ppm mass deviation from the theoretical mass. Increasing the resolution setting to 35,000 starts to resolve the peak pattern, but with a small shoulder remaining, resulting in an improved mass accuracy of 16 ppm. Finally a resolution setting of 70,000 results in fully baseline resolved peaks and best mass accuracy of 4 ppm.
These findings demonstrate the superiority of CVA-MS over CVA with conventional detection, as co-eluting substances can be distinguished from each other via difference in their intact mass. Furthermore, it is shown that optimal method parameters for MS data acquisition are dependent on the sample and spectral complexity. As a side note, the mass deviations reported cannot directly be deduced from the m/z values labelled in because the peak labels provided by the software indicate the highest point of a peak, which is not necessarily the exact center of the peak. Additionally, deconvolution is based on a series of charge states and not only a single one.
Lysine truncation
The charge variant pattern of adalimumab is dominated by three forms differing in the number of C-terminal lysine residues ().Citation22 Different C-terminal lysine forms derive from incomplete CpB cleavage in upstream processing and are among the most commonly observed basic variants in mAbs and related products.Citation7 As lysine is a basic residue, incomplete lysine clipping results in the generation of basic variants showing increased retention on a SCX stationary phase.
Using the gradient optimised for the separation of adalimumab, we were able to baseline separate three antibody forms, corresponding to the presence of zero, one and two C-terminal lysine residues (). Using the Sliding Window deconvolution feature of the BioPharma Finder™ 2.0 software, the three most abundant glycoforms of all three lysine variants were annotated with mass deviations of less than 10 ppm. The Sliding Window feature furthermore enabled a relative quantification of all lysine variants annotated, which can be observed in .
Figure 5. A.) BPC of adalimumab acquired at a resolution setting of 70,000. The main peak in blue corresponds to adalimumab without both C-terminal lysine residues, orange represents the variant containing one C-terminal lysine and green the variant carrying both C-terminal lysine residues. B.) BPC of CpB digested adalimumab. The arrows mark the species that have decreased or increased upon digestion. C.) Relative abundance of the 3 most intense glycoforms of all 3 lysine variants identified.
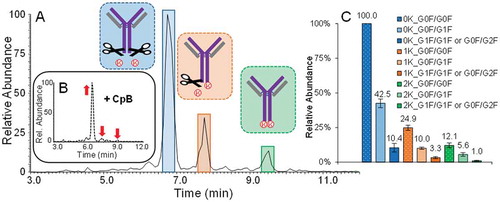
The BPC of a CpB digested sample, shown in , supports the conclusions drawn from molecular mass and retention time. Following digestion with CpB the peak areas of the two basic variants were significantly decreased, even though small peaks remained. Utilising intact mass information, we were able to confirm that both peaks were not attributable to unclipped C-terminal lysine, but to the co-elution of different basic adalimumab variants. The identification of these species was approached following more in-depth investigation of minor species, further discussed below.
Additionally, when analysing the three most prominent peaks, an unknown variant that co-elutes with the main species was observed. This variant was detected at the same m/z value reported for the unknown labelled with an asterisk in , with an average mass of 148,322.3 Daltons (Da) after deconvolution. A more detailed outline of the identification and quantification of lysine variants can be found in Table S4 in the Supporting Information.
Other basic variants
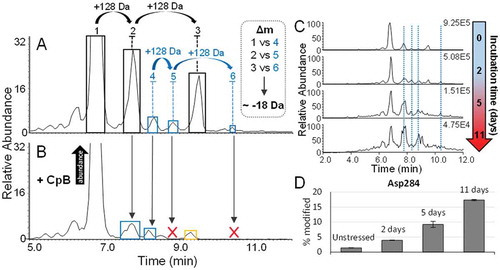
shows a magnification of the adalimumab BPC focusing on minor basic variants that are labelled in either blue or yellow. For peaks 4, 5 and 6, which are marked in blue, deconvolution revealed a repetitive mass increase of 128 Da in an increasingly basic order, similar to what was seen for the three most intense peaks. This indicates the presence of three C-terminal lysine forms of an adalimumab variant already carrying a basic modification. This assumption was further supported by the disappearance of the two latter peaks upon CpB digestion, marked by the red “X” in the BPC of . Interestingly, we found the antibody variant remaining at the peak number 2 position after CpB digestion to be close in mass with the consecutive peak labelled with “4” in blue in . Peak annotation was performed using the two most abundant glycoforms of each peak, as the low abundance of these species prohibited reliable mass determination of the G1F/G1F glycoform. In comparison to the main lysine variants, we found that the three-minor species in blue deviated in mass by ~-18 Da. Taking retention time into consideration, we concluded these species are likely to be three C-terminal lysine variants of an antibody that underwent succinimide formation of an Asp residue. The data leading to this assumption is presented in more detail in Table S5 in the Supporting Information. Succinimide formation in mAbs has previously been described to yield in an increase in protein pI and was also positively correlated to exposure of the molecule to certain environmental conditions, such as acidic pH and elevated temperature.Citation25–Citation27 Succinimide formation of Asp would result in the loss of one acidic residue and would, in consequence, explain an increase in retention on the SCX stationary phase. To investigate our hypothesis further, LC-MS based peptide mapping of the drug substance was performed and revealed the occurrence of succinimide Asp on several residues of up to 1.4% (data not shown). This hypothesis is also further supported by forced degradation experiments. After accelerated aging studies we, amongst other findings, observed an increase in the respective species on the intact protein level with ongoing incubation time (). Peptide mapping data of the same samples revealed an increase in succinimide formation of multiple Asp residues over time. This is illustrated in with the example of Asp284. Asp284, in particular, appears to be prone to succinimide formation with increasing storage duration. After simulated storage of 24 months at 4°C, almost 20% of the residue is modified. This not only suggests correct peak annotation of the succinimide forms on the intact level, but also succinimide Asp formation as a dominant degradation pathway of adalimumab under non-ideal storage conditions.
Figure 6. A.) Magnification of the BPC of an undigested and unstressed adalimumab sample, acquired at a resolution setting of 35,000. The peaks labelled from 1–3 are the main lysine variants as discussed above. Peaks labelled in blue from 4–6 are corresponding to the succinimide Asp containing versions. B.) BPC of a CpB digested sample. Former positions of peaks which have completely disappeared following CpB digestion are indicated by a red “X”. The co-eluting substance, suspected of being a basic variant derived by N-terminal Asp loss or proline amidation is indicated in yellow. The main species is increasing in abundance upon digestion as indicated by the arrow. C.) BPCs of samples incubated at elevated temperature for up to 11 days. D.) Increase of succinimide formation on Asp284 with ongoing incubation time at elevated temperature revealed by peptide mapping.
The presence of a basic species co-eluting with the +2 C-terminal lysine variant, marked in yellow in the BPC of , was also observed upon further analysis of the minor basic variants. This peak represents two glycoforms of a basic charge variant. A third glycoform was not detected, which may be related to the low abundance of this charge variant.
Compared to the two major glycoforms of the main charge variant, this basic species is lower in mass, deviating by 112 to 113 Da. Hydrolysis C-terminally of Asp is one of the most commonly occurring mAb degradation pathways.Citation28 The mass shift observed could be indicative of an N-terminal Asp loss, which would cause a mass decrease of ~115 Da. The complete loss of an acidic amino acid could also explain the relatively late elution. Another possible explanation could be the occurrence of C-terminal proline amidation on each one of the heavy chains. This modification was previously reported for an IgG1 molecule and could explain the late elution based on a theoretical mass difference of ~116 Da.Citation29 The 2–3 Da discrepancy makes an unambiguous assignment to either one of the modifications based on intact mass difficult; nevertheless, peptide mapping data indicates the presence of low abundant peptides corresponding to both of them (Figures S2, S3). The relatively high retention time in CEX chromatography combined with the fact that the proline amidated peptide showed a three-times higher peak area in the peptide mapping experiments strongly indicates the intact species is the double C-terminally amidated form.
Deamidation & isomerisation
Deamidation, next to sialylation, glycation and fragmentation are frequently occurring modifications on mAbs leading to the generation of acidic species.Citation7 Deamidated and non-modified species can therefore be distinguished by using adequate charge-sensitive separation techniques.Citation20,Citation26,Citation30–Citation32 The gold standard for identification of deamidated forms is peak collection after separation, followed by proteolytic digestion and peptide mapping.
We have shown that deamidation can also directly be detected on the intact protein level when utilising the CVA-MS method in cases where acidic and main peaks are chromatographically distinguishable from each other.Citation20 In this study, chromatographic selectivity of adalimumab acidic species was high, which resulted in the clear resolution of three peaks in front of the main species. These peaks, highlighted in red in , are indicative of several acidic adalimumab charge variants, of which all were found to be closely isobaric to the main species (Δm = + 0.6 – 2.2 Da). Accounting for the relatively low abundance of the peaks, calculations are based on triplicate measurements of only the most abundant glycoform.
Figure 7. A.) BPC of adalimumab, acquired at a resolution setting of 35,000. The presence and retention times of glycated antibody forms is indicated by blue, orange and green labels in peak fronts of all three major lysine variants. Antibody variants that were found to carry deamidation are indicated in red. B.) Table showing the mass differences between the main glycoform of the three acidic species and the major lysine variant (no C-terminal lysine residues and G0F/G0F glycoform). The average masses are the masses that were experimentally observed. C.) Ratios of the three most abundant glycoforms of all three major lysine variants of the peak centres compared to peak fronts. D.) Asn329 deamidation of the main peak compared to the acidic peaks 1 and 2. This data is based on preparative peak collection followed by peptide mapping experiments.
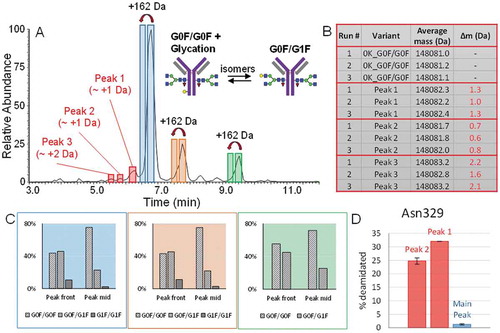
Peak one in was found to contain a species which, on average, is 1.2 Da larger than the main variant, indicating the presence of a singly deamidated form. Peak two shows a similar mass, with an average difference of +0.7 Da, whereas peak three is +2.2 Da divergent from the main variant. An overview of the mass differences observed is given in and in Table S7 in the Supporting Information.
These results suggest the presence of singly and also possibly doubly deamidated adalimumab variants. The presence of two peaks indicating single deamidation could be explained by the formation of both, aspartic acid and isoaspartic acid, which have previously been shown to be distinguishable via charge sensitive separation methods.Citation26,Citation27,Citation31 The presence of deamidated forms is not only suggested on the intact level, but also confirmed via peptide mapping of the two most abundant acidic variants after preparative peak collection. Compared to the main peak these charge variants showed a total incident of asparagine (Asn)329 deamidation of ~31% and ~25%, respectively ().
Glycation
Protein glycation is a non-enzymatic addition of a hexose unit on a lysine residue within the protein sequence and occurs when reducing sugars interact with the protein.Citation33–Citation35 In the past glycation has been linked to an increased incidence of aggregation, and should therefore be monitored.Citation33,Citation36 In a study where a mixture of glycated and non-glycated mAb, as well as the separated fractions were analysed by CEX chromatography, it was shown that glycation resulted in only a slight retention time shift towards the acidic region. The lack of selectivity may not be sufficient to distinguish glycated and main variants as two distinct peaks.Citation36 Using CVA-MS, we were able to partially overcome this limitation by integration and deconvolution of different regions of a single peak.
The ratios between the three main glycoforms G0F/G0F, G0F/G1F and G1F/G1F or G0F/G02F were found to change from peak front to peak mid from ~10:10:3 to ~10:4:1, whereas the latter would be the only ratio expected to be seen across all prominent charge variant peaks (). The presence of an additional galactose residue on an N-glycan does not affect protein pI, and hence should not result in retention time shifts on a CEX stationary phase. Due to the alteration in the ratio of glycoforms over the chromatographic peak, it is therefore more probable that we are observing the presence of glycated species of the three major C-terminal lysine variants. A more detailed presentation of data on detection of glycated forms can be found in Table S6 in the Supporting Information. Although the lack of sufficient separation paired with the isobaric nature of a glycated antibody and a non-glycated version with an additional galactose on one Fc glycan prevents quantification, this finding clearly demonstrates the power of the CVA-MS approach, as the information that can be gained is much more comprehensive than what can be obtained by conventional detection methods. The presence of glycation in the drug product in general was also confirmed via peptide mapping, as several lysine residues showed glycation of up to 0.5% (data not shown).
Fragmentation
The main focus of this study was to thoroughly investigate mAb heterogeneity on the intact protein level by native on-line LC-MS. The acquisition parameters employed for MS analysis were chosen to fully capture the charge envelope of a native mAb, utilising the mass range of up to 8,000 m/z provided by the MS instrumentation used.
To also visualize potentially present lower molecular weight species, such as antibody fragments, the data files acquired were filtered post-acquisition to only display ions within a mass range of m/z 2,500–5,000. shows a BPC resulting from application of such a mass filter. What can be seen is the same data file which was shown through – but with a limited mass range, hence excluding all ions representing intact antibody species.
Figure 8. A.) Adalimumab BPC acquired at a resolution setting of 35,000 adjusted to a mass range of m/z 2,500 to 5,000. The spectra represent the charge state envelopes which were obtained when averaging each of the three peaks. The fragments corresponding to the same fragmentation events are illustrated in matching color (Peaks 1 and 3, blue and peak 2 purple). Their average masses after deconvolution are shown in the tables. The appearance of the charge envelope of the intact mAb in the averaged spectrum of peak 3 can be explained by the simultaneous elution of the fragment and acidic intact antibody variants which elute relatively early. B.) Fragmentation sites and resulting fragment species are shown on the intact mAb as well as by a magnification of the upper hinge region. The His-Thr site shown in purple is the one which has also been reported as a specific cleavage site of Cathepsin L1. C.) BPCs showing the mass range of m/z 2,500–5,000 of the unstressed drug product and the drug product after accelerated aging. Species which have disappeared during incubation are indicated by the red “X”. Newly generated variants and their mass shifts are indicated by red arrows and labels. As the peak labelled in grey contains more than one species in the unstressed drug product, the averaged spectra are shown in grey on the right hand side.
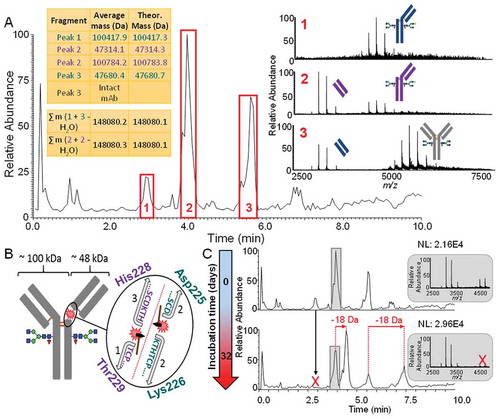
Whereas very low molecular weight species (<3,500 Da), derived from the drug product formulation, were detected at the start of the run, three peaks labelled in red in were found to contain in total four charge state distributions typical for proteins but not corresponding to the size of an intact mAb. Deconvolution of the mass spectra revealed that the peaks contain species of either ~48 kilodaltons (kDa) or ~100 kDa, suggesting the presence of antibody fragments. MAb fragmentation can occur at different stages such as upstream and downstream processing, formulation or storage. Numerous possible pathways for non-enzymatic protein fragmentation have been described in the literature.Citation28 Mechanisms for protein fragmentation have increasingly been studied in recent years, especially in relation to residual host cell proteins causing degradation of biopharmaceuticals.Citation37–Citation40 Fragmentation of the molecule can result in loss of potency, and represents a CQA.
demonstrates that the three peaks of the BPC marked in red contain two species of ~48 kDa and two of ~100 kDa in mass. Utilising molecular mass information after deconvolution, we found that the major fragment masses, when combined, result in a mass of ~148,080 Da, equal to the main variant of intact adalimumab and hence are indicative of two distinct fragmentation sites (, upper and lower tables). The size ranges of the fragments observed provided valuable information regarding annotation of the fragmentation sites. Disulfide bond disruptions of any kind, leading to fragmentation, were ruled out because potential fragments would either be ~25 kDa, ~75 kDa or ~125 kDa in mass. Accounting for the fact that the higher molecular weight species were found as different glycoforms, we hypothesized that fragmentation must occur in the upper hinge region, as depicted in . By comparing theoretical and observed fragment masses, the two fragmentation sites were distinguished to be C-terminal to Asp225 and histidine (His)228 (). More details on fragment identification can be found in Table S8 in the Supporting Information. The upper hinge region has repeatedly been described as a region prone to non-enzymatically driven fragmentation events.Citation41–Citation44 Cleavage thereby has been shown to be either mediated by direct hydrolysis or by β-elimination, and specific cleavage sites have been shown to be heavily influenced by the pH of the protein environment.Citation43 The two distinct cleavage sites reported in this study have previously been detected on an IgG1 antibody and reported by Tao et. al.Citation44 This finding suggests that these sites may be prone to hydrolysis in IgG1 molecules in general. To investigate whether fragmentation at the two distinct sites could potentially also be related to protease activity, we performed a peptide mapping experiment on the drug product where we deliberately overloaded the column to find potentially present low abundant HCPs. In total, 51 different HCPs were identified, six of them by two or more unique peptides (Table S9). We especially focused on Cathepsin L1 because it shows specificity for the His-Thr cleavage site reported herein, according to the MEROPS database.Citation45–Citation47 Three unique peptides were found for Cathepsin L, the associated MSCitation2 spectra with assigned b- and y-ions are shown in the Supporting Information, Figure S4. The shortest peptide ‘STYR’ was found to be also present in the sequence of adalimumab, where it, however, is not a true tryptic peptide. In consequence, it should mainly be derived from the HCP and not from the drug substance, but the formation of semi-tryptic peptides from adalimumab cannot entirely be ruled out. Using label free quantitation, we found the concentration of Cathepsin L in the drug product to be in the range of ~4 ppm (ng HCP per mg therapeutic protein). Considering its specificity for one of the cleavage sites identified, the presence of detectable amounts of Cathepsin L could be crucial for drug stability. This may be the case especially under non-ideal storage conditions where the enzymatic activity of the protease can be dramatically increased.
The accelerated aging samples previously discussed were also analysed for the presence of fragments. While the intact molecule appears to increasingly degrade with time, certain fragment peaks clearly remain for the simulated time of three years studied herein, as is the case for the fragments of ~48 kDa. The ~100 kDa fragments slowly decrease over time until they have completely disappeared, as is indicated by the red “X” in . also shows that new species arise with ongoing forced degradation time. Closer analysis revealed that the two additional peaks are made up by variants corresponding to the two lower molecular weight fragments but with a mass difference of −18 Da. This indicates forced degradation-mediated succinimide formation not only on the intact protein but also on fragment level. This is further supported by retention time shifts, as they would be expected for species with an additional basic modification. Moreover, this is not the first observation of succinimide formation on fragments after accelerated aging studies as such a finding has been reported before.Citation44
A majority of studies on antibody fragmentation cited here were based on peptide mapping or middle up approaches after peak collection by size-exclusion chromatography. In comparison to these approaches, CVA-MS for fragment characterisation provides comparable depth of information while avoiding multiple analyses and sample preparation procedures. This makes CVA-MS an incredibly powerful method for fast and in-depth analysis of mAbs.
Discussion
Here, we present a method for charge variant analysis of mAbs with on-line MS detection which, in terms of universal applicability and occurrence of adduction, is markedly superior to what has previously been presented. Using adalimumab as an example, we showed that gradient optimisation can result in a plethora of charge variant peaks, 16 in total for adalimumab, that are chromatographically resolvable. We demonstrated that MS resolution settings can be selected to best meet the experimental requirements, and that the obtained MS data are very well suited for the analysis of even very low abundant charge variant species. Using molecular mass and retention time information, we were able to identify more than 16 different adalimumab charge variants, some of which were not sufficiently chromatographically distinguishable but were detectable by mass spectrometric means, which previously would have been an unachievable feat. Most species could be annotated confidently because the molecular mass, retention time and, in many cases enzyme digestion, peptide mapping, or forced degradation experiments showed conclusive outcomes. Among the modifications identified were the following: various levels of lysine truncation, glycation and succinimide formation of differently lysine truncated forms, deamidation, isomerisation, as well as double deamidation, N-terminal Asp loss or C-terminal proline amidation and fragmentation at two distinct sites. We have also shown the utility of CVA-MS for the analysis of degraded antibody samples and found fragmentation and Asp succinimide formation to be major degradation pathways of adalimumab over long-term storage. In addition, we found highly compelling leads for the presence of low amounts of Cathepsin L within the drug product, possibly a contributor to antibody degradation under non-ideal storage conditions. Even though the method herein reported is very powerful, it has its limitations. Complementary experiments such as, for example, peptide mapping are still required for the unambiguous determination of modification sites.Citation29,Citation48,Citation49 The required sample preparation, however, takes time and bears the risk of introducing artificial modifications. Recently, a fully automated peptide mapping approach of charge variant fractions employing a four-dimensional chromatographic setup was presented.Citation50 Whereas such elaborate workflows can partly mitigate these problems, they also rely on highly complex setups. In addition, peptide mapping in general results in a collapse of the dynamic range of protein variants because the peptides cannot be traced back to the particular proteoform of origin. We have shown that, in addition to the analysis of intact protein variants, CVA-MS is also very well suited for the analysis of protein heterogeneities of lower molecular mass. The characterisation of higher molecular mass species such as dimers and even higher molecular weight assemblies has previously been shown accessible to analysis via SEC-MS.Citation51
From a single injection without any sample preparation, substantial amounts of data can be obtained, which would normally require multiple modes of analysis with several sample preparation techniques. Thus, CVA-MS is a technique that allows the monitoring of multiple attributes on the intact protein level. Having applied CVA-MS for the analysis of adalimumab, we have reported novel information on antibody heterogeneity and on its susceptibility to degradation, which can have fundamental implications for the introduction of potential biosimilar candidates in the future.
Materials and methods
Materials
Water (Optima™, LC-MS grade, Catalog No 10505904), 0.1% formic acid in water (Optima, LC-MS grade, Catalog No 10188164) and 0.1% formic acid in acetonitrile (Optima, LC-MS grade, Catalog No 10118464) were provided by Fisher Scientific. DL-dithiothreitol (DTT) (Catalog No D0632-1G), acetic acid (ACS reagent grade, ≥99.7%, Catalog No A0808), ammonium bicarbonate (BioUltra, ≥99.5%, Catalog No 09830) and ammonium hydroxide solution (BioUltra, 1 M in H2O, Catalog No 09859) were purchased from Sigma-Aldrich. The commercially available products trastuzumab, infliximab, bevacizumab, rituximab and cetuximab were provided by the Hospital Pharmacy Unit of the University Hospital of San Cecilio in Granada, Spain. Adalimumab was provided by St. Vincent’s University Hospital in Dublin, Ireland and the NIST mAb reference material (Catalog No RM8671) was purchased from the National Institute of Standards and Technology. Carboxypeptidase B (Catalog No 10103233001) was obtained from Hoffmann-La Roche AG. The SMART Digest trypsin kit, magnetic bulk resin option (Catalog No 60109–101-MB), KingFisher Deepwell 96-well plates and KingFisher Duo 12-tip combs were obtained from Thermo Scientific™. Vivaspin® 500 spin filters with 10 kDa cut-off were provided by Sartorius. Hi3 Phos B Standard (Catalog No 186006011) for label-free Hi3 quantification of HCPs was obtained from Waters.
Forced degradation of adalimumab
Two hundred and ten µg of adalimumab in formulation buffer were incubated in triplicate for 2, 5, 11, 16, 21, 27 and 32 days at 55°C respectively in an Incubating Mini Shaker from VWR. Time points were chosen to, according to the Arrhenius equation, resemble theoretical storage durations of 2, 6, 12, 18, 24, 30 and 36 months at 4°C using an aging factor of 2.0. Sample condensation during elevated temperature incubation was counteracted by daily centrifugation of the samples at 1,000 rounds per minute for 1 minute. After heat exposure, samples were stored at −20°C.
Sample preparation for LC-MS analyses
Carboxypeptidase digestion of the intact antibody was performed by the addition of the enzyme to obtain a substrate-enzyme ratio of 5:1 (w/w). Digestion was performed at 37°C for 2 hours with agitation at 450 rounds per minute. For peptide mapping, 60 µg of adalimumab were buffer exchanged to water to a final concentration of 0.83 mg mL−Citation1 using VIVASPIN spin filters with a cut-off size of 10,000 Da. For peptide mapping of the stressed samples, 20 µg per replicate were merged to obtain the final protein amount of 60 µg for each condition. Digestion was carried out with a KingFisher Duo Prime Purification System under operation of the BindIt software, version 4.0. Samples were diluted with SMART buffer in a KingFisher Deepwell 96-well plate to obtain a final concentration of 0.3 mg mL−Citation1. Magnetic beads were picked up with KingFisher Duo 12-tip combs and were washed for 1 minute in SMART buffer diluted with water in a ratio of 1:4 (v/v) before they were moved into the sample wells. Digestion was performed at 70°C for 40 minutes; afterwards tip combs, together with the magnetic beads, were removed. Digested samples were reduced by addition of a 100 mM DTT solution to reach a final DTT concentration of 5 mM and incubation at 37°C for 30 minutes. Following reduction, samples were directly analysed via LC-MS/MS. Quantification of HCPs was accomplished by spiking Waters Hi3 Phos B standard, consisting of an equimolar mixture of 6 synthetic peptides of rabbit Phosphorylase B proteins to obtain a final injection amount of 25 pmol per peptide. For this experiment the column was deliberately overloaded by injecting a protein amount approximately 30-fold higher compared to what was injected in standard peptide mapping experiments.
CVA with UV detection for gradient optimisation
For mAb gradient optimisation, 25 mM ammonium bicarbonate and 30 mM acetic acid in water (pH 5.3) were used as buffer A and 10 mM ammonium hydroxide in water (pH 10.9) was used as buffer B. Buffers were prepared as 5X stock solutions and stored for 2 weeks at 4°C before use. Separations were performed on a Thermo Scientific™ Ultimate™ 3000 HPLC system equipped with a variable wavelength detector, a split-loop autosampler, a dual gradient pump, a column compartment and an Ultimate™ 3000 PCM-3000 pH and conductivity monitor. As chromatographic column, a MAbPac™ SCX-10 RS column with dimensions of 2.1 × 50 mm and 5 μm particle size was used (Thermo Fisher Scientific, Sunnyvale, CA, USA). The column oven was held at 25°C, a flow rate of 0.4 mL/min−Citation1 was applied and detection was performed via UV absorption at 280 nm. For gradient optimisation, 50 µg of antibody were injected per run. Gradients for all mAbs after optimisation can be obtained from . Run time was 25 minutes in total consisting of 10 minutes gradient time, 3 minutes column flushing at 100% buffer B and 12 minutes re-equilibration time.
Table 1. Optimised gradients for all 7 mAbs. Corresponding separations can be obtained from .
CVA-MS analysis of adalimumab
Separations were performed on a Thermo Scientific Vanquish™ Horizon UHPLC system equipped with a fluorescence detector F, a split sampler HT, a binary pump H and a column compartment. The chromatographic column used, as well as the buffers, temperature, flow rate and the gradient applied were the same as described for gradient optimisation. Fluorescence detection was employed using excitation and emission wavelengths of 280 nm and 360 nm, respectively before MS detection. One hundred µg were injected per run for MS data acquisition on a Q Exactive™ Plus mass spectrometer enabled with the BioPharma option (Thermo Fisher Scientific, Bremen, Germany), providing a mass range of up to 8,000 m/z. Data acquisition of unstressed and stressed adalimumab samples was performed in triplicate. LC and MS systems were hyphenated via a Heated Electrospray Ionization-II probe in a standard Ion Max ion source. A detailed summary of MS tune and method parameters can be found in Table S1 in the Supporting Information.
Data analysis was performed in Thermo Scientific BioPharma Finder™ 2.0 software using the ReSpect™ algorithm for deconvolution. Deconvolution of spectra of main lysine variants was performed using the Sliding Window deconvolution feature. All other analyses were based on deconvolution after manual peak integration. The average molecular masses obtained after deconvolution were compared to the theoretical mass of intact adalimumab considering G0F/G0F, G0F/G1F and G1F/G1F or G0F/G2F glycoforms as well as theoretical masses of modifications such as: single and double lysine loss, glycation, single and double deamidation, succinimide formation, Asp loss or double C-terminal proline amidation and fragmentation. Exact masses used for comparison and annotation were obtained by using the atomic weights and isotopic compositions provided by the Commission on Isotopic Abundances and Atomic Weights. Details on the BioPharma Finder™ 2.0 parameter settings used can be found in Table S3 in the Supporting Information.
Separation and collection of acidic and main adalimumab peaks for peptide mapping
A Thermo Fisher Scientific Vanquish Flex UHPLC system with diode array detection was used for separation. All LC parameters were similar to what has been described for gradient optimisation. Peaks of 5 CVA runs were collected and merged, total sample amount injected was 100 µg per run.
Peptide mapping
Peptide mapping experiments were performed on a Thermo Fisher Scientific Vanquish Flex UHPLC system coupled to a Q Exactive Plus mass spectrometer. Separations were performed on an Acclaim™ VANQUISH C18 column (Thermo Fisher Scientific, Sunnyvale, CA, USA) with dimensions of 250 × 2.1 mm and a particle size of 2.2 µm at 25°C and a flow rate of 0.3 ml min−Citation1 with 0.1% formic acid in water as buffer A and 0.1% formic acid in acetonitrile as buffer B, using a gradient of 2–40% buffer B in 45 min. Details regarding MS tune and method settings can be obtained from Table S2 in the Supporting Information. The injected sample amount for analysis of the drug product was ~5 µg, whereas, for peptide mapping-based search for HCPs, ~160 µg of protein digest was injected per run. LC-UV measurements were acquired under Thermo Scientific Chromeleon CDS 7.2. LC-MS data acquisition was performed under Thermo Scientific Xcalibur 4.0. Acquired data files were analysed via BioPharma Finder 2.0 software. For peptide identification, adalimumab light- and heavy-chain sequences were introduced into the software and the following modifications were set: C-terminal lysine loss, deamidation of glutamine and asparagine, oxidation of methionine, tryptophan and cysteine, glycation of lysine and succinimide formation on aspartic acid. Search results were filtered for a confidence score of ≥0.8. Peptide mapping experiments of the whole drug product were performed in triplicate. In case of peptide mapping experiments of peaks collected after charge variant separation, the final results were obtained by either triplicate or duplicate injections.
For HCP analysis, data files obtained were searched against the Cricetulus Griseus database from Uniprot using PEAKS studio 7.5 (Bioinformatics Solutions Inc., Waterloo, ON, Canada). The parent mass error tolerance was set to 10 ppm, fragment mass error tolerance was set to 0.01 Da. Trypsin was chosen as digestion enzyme, one missed cleavage and no non-specific cleavages were allowed. Oxidation and deamidation were included as variable modifications, and a false discovery rate cut-off of 1% was applied. Protein annotation, data visualisation and quantification was performed in Progenesis QI for Proteomics, (Non-Linear Dynamics, Newcastle, United Kingdom).
Abbreviations
| 2D | = | 2-dimensional |
| Asn | = | asparagine |
| Asp | = | aspartic acid |
| BPC | = | base peak chromatogram |
| CEX | = | cation exchange chromatography |
| CpB | = | carboxypeptidase B |
| CQAs | = | critical quality attributes |
| CVA | = | charge variant analysis |
| CVA-MS | = | charge variant analysis-mass spectrometry |
| Da | = | daltons |
| DTT | = | DL-dithiothreitol |
| ESI | = | electrospray ionisation |
| HCP | = | host cell protein |
| His | = | histidine |
| kDa | = | kilodaltons |
| LC | = | liquid chromatography |
| LC-MS | = | liquid chromatography-mass spectrometry |
| m/z | = | mass to charge ratio |
| mAb | = | monoclonal antibody |
| MS | = | mass spectrometry |
| NL | = | normalized level |
| PAT | = | process analytical technology |
| pI | = | isoelectric point |
| ppm | = | parts per million |
| SCX | = | strong cation exchange |
| SID | = | in-source collision induced dissociation |
| ToF | = | time-of-flight |
| UHPLC | = | ultra-high performance liquid chromatography |
| WCX | = | weak cation exchange |
Supplemental Material
Download MS Word (189.9 KB)Acknowledgments
The authors gratefully acknowledge funding from Science Foundation Ireland under Grant Number 13/CDA/2196 and collaborators from Thermo Fisher Scientific for instrument access and support.
Disclosure statement
K. Cook and K. Scheffler are employees of Thermo Fisher Scientific, the corporation that develops and distributes the MAbPac SCX and Acclaim Vanquish columns, the KingFisher Duo Prime Purification System and SMART Digest kit, the Dionex UltiMate 3000 and Vanquish UHPLC systems, the Q Exactive Plus mass spectrometer, and Chromeleon CDS, Xcalibur and BioPharma Finder software.
Beyond this, the authors are not aware of any affiliations, memberships, funding, or financial holdings that might perceive as affecting the objectivity of this article.
Supplementary Material
Supplemental data for this article can be accessed on the publisher’s website.
Related Research Data
References
- Berkowitz SA, Engen JR, Mazzeo JR, Jones GB. Analytical tools for characterizing biopharmaceuticals and the implications for biosimilars. Nat Rev Drug Discov. 2012;11:527–540. doi:10.1038/nrd3746.
- Liu H, Gaza-Bulseco G, Faldu D, Chumsae C, Sun J. Heterogeneity of monoclonal antibodies. J Pharm Sci. 2008;97:2426–2447. doi:10.1002/jps.21180.
- Torkashvand F, Vaziri B. Main quality attributes of monoclonal antibodies and effect of cell culture components. Iran Biomed J. 2017;21:131–141.
- Hintersteiner B, Lingg N, Zhang P, Woen S, Hoi KM, Stranner S, Wiederkum S, Mutschlechner O, Schuster M, Loibner H, et al. Charge heterogeneity: basic antibody charge variants with increased binding to Fc receptors. mAbs. 2016;8:1548–1560. doi:10.1080/19420862.2016.1225642.
- Khawli LA, Goswami S, Hutchinson R, Kwong ZW, Yang J, Wang X, Yao Z, Sreedhara A, Cano T, Tesar DB, et al. Charge variants in IgG1: isolation, characterization, in vitro binding properties and pharmacokinetics in rats. mAbs. 2010;2:613–624. doi:10.4161/mabs.2.6.13333.
- Lingg N, Berndtsson M, Hintersteiner B, Schuster M, Bardor M, Jungbauer A. Highly linear pH gradients for analyzing monoclonal antibody charge heterogeneity in the alkaline range: validation of the method parameters. J Chrom A. 2014;1373:124–130. doi:10.1016/j.chroma.2014.11.021.
- Du Y, Walsh A, Ehrick R, Xu W, May K, Liu H. Chromatographic analysis of the acidic and basic species of recombinant monoclonal antibodies. mAbs. 2012;4:578–585. doi:10.4161/mabs.21328.
- Sluyterman LAA, Elgersma O. Chromatofocusing - isoelectric-focusing on ion-exchange columns .1. General principles. J Chrom. 1978;150:17–30. doi:10.1016/S0021-9673(01)92092-8.
- Sluyterman LAA, Wijdenes J. Chromatofocusing - isoelectric-focusing on ion-exchange columns .2. Experimental-verification. J Chrom. 1978;150:31–44. doi:10.1016/S0021-9673(01)92093-X.
- Sluyterman LAA, Wijdenes J. Chromatofocusing .3. The properties of a deae-agarose anion-exchanger and its suitability for protein separations. J Chrom. 1981;206:429–440. doi:10.1016/S0021-9673(00)88912-8.
- Fekete S, Beck A, Veuthey JL, Guillarme D. Ion-exchange chromatography for the characterization of biopharmaceuticals. J Pharm Biomed Anal. 2015;113:43–55. doi:10.1016/j.jpba.2015.02.037.
- Fekete S, Beck A, Fekete J, Guillarme D. Method development for the separation of monoclonal antibody charge variants in cation exchange chromatography, Part I: salt gradient approach. J Pharm Biomed Anal. 2015;102:33–44. doi:10.1016/j.jpba.2014.08.035.
- Fekete S, Beck A, Fekete J, Guillarme D. Method development for the separation of monoclonal antibody charge variants in cation exchange chromatography, Part II: pH gradient approach. J Pharm Biomed Anal. 2015;102:282–289. doi:10.1016/j.jpba.2014.09.032.
- Patel BA, Pinto NDS, Gospodarek A, Kilgore B, Goswami K, Napoli WN, Desai J, Heo JH, Panzera D, Pollard D, et al. On-line ion exchange liquid chromatography as a process analytical technology for monoclonal antibody characterization in continuous bioprocessing. Anal Chem. 2017;89:11357–11365. doi:10.1021/acs.analchem.7b02228.
- Griaud F, Denefeld B, Lang M, Hensinger H, Haberl P, Berg M. Unbiased in-depth characterization of CEX fractions from a stressed monoclonal antibody by mass spectrometry. mAbs. 2017;9:820–830. doi:10.1080/19420862.2017.1313367.
- Stoll DR, Hannes DC, Danforth J, Wagner E, Guillarme D, Fekete S, Beck A. Direct identification of rituximab main isoforms and subunit analysis by online selective comprehensive two-dimensional liquid chromatography-mass spectrometry. Anal Chem. 2015;87:8307–8315. doi:10.1021/acs.analchem.5b01578.
- Muneeruddin K, Bobst CE, Frenkel R, Houde D, Turyan I, Sosic Z, Kaltashov IA. Characterization of a PEGylated protein therapeutic by ion exchange chromatography with on-line detection by native ESI MS and MS/MS. Analyst. 2017;142:336–344. doi:10.1039/c6an02041k.
- Muneeruddin K, Nazzaro M, Kaltashov IA. Characterization of intact protein conjugates and biopharmaceuticals using ion-exchange chromatography with online detection by native electrospray ionization mass spectrometry and top-down tandem mass spectrometry. Anal Chem. 2015;87:10138–10145. doi:10.1021/acs.analchem.5b02982.
- Talebi M, Nordborg A, Gaspar A, Lacher NA, Wang Q, He XZ, Haddad PR, Hilder EF. Charge heterogeneity profiling of monoclonal antibodies using low ionic strength ion-exchange chromatography and well-controlled pH gradients on monolithic columns. J Chrom A. 2013;1317:148–154. doi:10.1016/j.chroma.2013.08.061.
- Fussl F, Cook K, Scheffler K, Farrell A, Mittermayr S, Bones J. Charge variant analysis of monoclonal antibodies using direct coupled ph gradient cation exchange chromatography to high resolution native mass spectrometry. Anal Chem. 2018. doi:10.1021/acs.analchem.7b05241.
- Tebbey PW, Varga A, Naill M, Clewell J, Venema J. Consistency of quality attributes for the glycosylated monoclonal antibody Humira (R) (adalimumab). mAbs. 2015;7:805–811. doi:10.1080/19420862.2015.1073429.
- Liu J, Eris T, Li C, Cao S, Kuhns S. Assessing analytical similarity of proposed amgen biosimilar ABP 501 to adalimumab. BioDrugs. 2016;30:321–338. doi:10.1007/s40259-016-0184-3.
- Goyon A, Excoffier M, Janin-Bussat MC, Bobaly B, Fekete S, Guillarme D, Beck A. Determination of isoelectric points and relative charge variants of 23 therapeutic monoclonal antibodies. J Chromatogr B Analyt Technol Biomed Life Sci. 2017;1065-1066:119–128. doi:10.1016/j.jchromb.2017.09.033.
- Makarov A, Denisov E. Dynamics of ions of intact proteins in the Orbitrap mass analyzer. J Am Soc Mass Spectrom. 2009;20:1486–1495. doi:10.1016/j.jasms.2009.03.024.
- Chu GC, Chelius D, Xiao G, Khor HK, Coulibaly S, Bondarenko PV. Accumulation of succinimide in a recombinant monoclonal antibody in mildly acidic buffers under elevated temperatures. Pharm Res. 2007;24:1145–1156. doi:10.1007/s11095-007-9241-4.
- Ponniah G, Nowak C, Neill A, Liu H. Characterization of charge variants of a monoclonal antibody using weak anion exchange chromatography at subunit levels. Anal Biochem. 2017;520:49–57. doi:10.1016/j.ab.2016.12.017.
- Harris RJ, Kabakoff B, Macchi FD, Shen FJ, Kwong M, Andya JD, Shire SJ, Bjork N, Totpal K, Chen AB. Identification of multiple sources of charge heterogeneity in a recombinant antibody. J Chromatogr B Biomed Sci Appl. 2001;752:233–245. doi:10.1016/S0378-4347(00)00548-X.
- Vlasak J, Ionescu R. Fragmentation of monoclonal antibodies. mAbs. 2011;3:253–263.
- Kaschak T, Boyd D, Lu F, Derfus G, Kluck B, Nogal B, Emery C, Summers C, Zheng K, Bayer R, et al. Characterization of the basic charge variants of a human IgG1 Effect of copper concentration in cell culture media. mAbs. 2011;3:577–583. doi:10.4161/mabs.3.6.17959.
- Ponniah G, Kita A, Nowak C, Neill A, Kori Y, Rajendran S, Liu H. Characterization of the acidic species of a monoclonal antibody using weak cation exchange chromatography and LC-MS. Anal Chem. 2015;87:9084–9092. doi:10.1021/acs.analchem.5b02385.
- Neill A, Nowak C, Patel R, Ponniah G, Gonzalez N, Miano D, Liu H. Characterization of recombinant monoclonal antibody charge variants using OFFGEL fractionation, weak anion exchange chromatography, and mass spectrometry. Anal Chem. 2015;87:6204–6211. doi:10.1021/acs.analchem.5b01452.
- Gandhi S, Ren D, Xiao G, Bondarenko P, Sloey C, Ricci MS, Krishnan S. Elucidation of degradants in acidic peak of cation exchange chromatography in an IgG1 monoclonal antibody formed on long-term storage in a liquid formulation. Pharm Res. 2012;29:209–224. doi:10.1007/s11095-011-0536-0.
- Banks DD, Hambly DM, Scavezze JL, Siska CC, Stackhouse NL, Gadgil HS. The effect of sucrose hydrolysis on the stability of protein therapeutics during accelerated formulation studies. J Pharm Sci. 2009;98:4501–4510. doi:10.1002/jps.21749.
- Fischer S, Hoernschemeyer J, Mahler HC. Glycation during storage and administration of monoclonal antibody formulations. Eur J Pharm Biopharm. 2008;70:42–50. doi:10.1016/j.ejpb.2008.04.021.
- Gadgil HS, Bondarenko PV, Pipes G, Rehder D, McAuley A, Perico N, Dillon T, Ricci M, Treuheit M. The LC/MS analysis of glycation of IgG molecules in sucrose containing formulations. J Pharm Sci. 2007;96:2607–2621. doi:10.1002/jps.20966.
- Quan C, Alcala E, Petkovska I, Matthews D, Canova-Davis E, Taticek R, Ma S. A study in glycation of a therapeutic recombinant humanized monoclonal antibody: where it is, how it got there, and how it affects charge-based behavior. Anal Biochem. 2008;373:179–191. doi:10.1016/j.ab.2007.09.027.
- Gao SX, Zhang Y, Stansberry-Perkins K, Buko A, Bai S, Nguyen V, Brader ML. Fragmentation of a highly purified monoclonal antibody attributed to residual CHO cell protease activity. Biotechnol Bioeng. 2011;108:977–982. doi:10.1002/bit.22982.
- Robert F, Bierau H, Rossi M, Agugiaro D, Soranzo T, Broly H, Mitchell-Logean C. Degradation of an Fc-fusion recombinant protein by host cell proteases: identification of a CHO cathepsin D protease. Biotechnol Bioeng. 2009;104:1132–1141. doi:10.1002/bit.22494.
- Wang W, Ignatius AA, Thakkar SV. Impact of residual impurities and contaminants on protein stability. J Pharm Sci. 2014;103:1315–1330. doi:10.1002/jps.23931.
- Bee JS, Tie L, Johnson D, Dimitrova MN, Jusino KC, Afdahl CD. Trace levels of the CHO host cell protease cathepsin D caused particle formation in a monoclonal antibody product. Biotechnol Prog. 2015;31:1360–1369. doi:10.1002/btpr.2150.
- Cohen SL, Price C, Vlasak J. Beta-elimination and peptide bond hydrolysis: two distinct mechanisms of human IgG1 hinge fragmentation upon storage. J Am Chem Soc. 2007;129:6976–6977. doi:10.1021/ja0705994.
- Cordoba AJ, Shyong BJ, Breen D, Harris RJ. Non-enzymatic hinge region fragmentation of antibodies in solution. J Chrom B. 2005;818:115–121. doi:10.1016/j.jchromb.2004.12.033.
- Gaza-Bulseco G, Liu H. Fragmentation of a recombinant monoclonal antibody at various pH. Pharm Res. 2008;25:1881–1890. doi:10.1007/s11095-008-9606-3.
- Xiang T, Lundell E, Sun Z, Liu H. Structural effect of a recombinant monoclonal antibody on hinge region peptide bond hydrolysis. J Chrom B. 2007;858:254–262. doi:10.1016/j.jchromb.2007.08.043.
- Rawlings ND, Barrett AJ, Bateman A. MEROPS: the peptidase database. Nucleic Acids Res. 2010;38:D227–33. doi:10.1093/nar/gkp971.
- Rawlings ND. Peptidase specificity from the substrate cleavage collection in the MEROPS database and a tool to measure cleavage site conservation. Biochimie. 2016;122:5–30. doi:10.1016/j.biochi.2015.10.003.
- Berasain P, Carmona C, Frangione B, Dalton JP, Goni F. Fasciola hepatica: parasite-secreted proteinases degrade all human IgG subclasses: determination of the specific cleavage sites and identification of the immunoglobulin fragments produced. Exp Parasitol. 2000;94:99–110. doi:10.1006/expr.1999.4479.
- Diepold K, Bomans K, Wiedmann M, Zimmermann B, Petzold A, Schlothauer T, Mueller R, Moritz B, Stracke JO, Mølhøj M, et al. Simultaneous assessment of asp isomerization and asn deamidation in recombinant antibodies by LC-MS following incubation at elevated temperatures. PloS one. 2012;7:ARTN e30295. doi:10.1371/journal.pone.0030295.
- Haberger M, Bomans K, Diepold K, Hook M, Gassner J, Schlothauer T, Zwick A, Spick C, Kepert JF, Hienz B, et al. Assessment of chemical modifications of sites in the CDRs of recombinant antibodies Susceptibility vs. functionality of critical quality attributes. mAbs. 2014;6:327–339. doi:10.4161/mabs.27876.
- Gstottner C, Klemm D, Haberger M, Bathke A, Wegele H, Bell C, Kopf R. Fast and automated characterization of antibody variants with 4D HPLC/MS. Anal Chem. 2018;90:2119–2125. doi:10.1021/acs.analchem.7b04372.
- Haberger M, Leiss M, Heidenreich AK, Pester O, Hafenmair G, Hook M, Bonnington L, Wegele H, Haindl M, Reusch D, et al. Rapid characterization of biotherapeutic proteins by size-exclusion chromatography coupled to native mass spectrometry. mAbs. 2016;8:331–339. doi:10.1080/19420862.2015.1122150.