
 ?Mathematical formulae have been encoded as MathML and are displayed in this HTML version using MathJax in order to improve their display. Uncheck the box to turn MathJax off. This feature requires Javascript. Click on a formula to zoom.
ABSTRACT
As an immune evasion strategy, MICA and MICB, the major histocompatibility complex class I homologs, are proteolytically cleaved from the surface of cancer cells leading to impairment of CD8 + T cell- and natural killer cell-mediated immune responses. Antibodies that inhibit MICA/B shedding from tumors have therapeutic potential, but the optimal epitopes are unknown. Therefore, we developed a high-resolution, high-throughput glycosylation-engineered epitope mapping (GEM) method, which utilizes site-specific insertion of N-linked glycans onto the antigen surface to mask local regions. We apply GEM to the discovery of epitopes important for shedding inhibition of MICA/B and validate the epitopes at the residue level by alanine scanning and X-ray crystallography (Protein Data Bank accession numbers 6DDM (1D5 Fab-MICA*008), 6DDR (13A9 Fab-MICA*008), 6DDV (6E1 Fab-MICA*008). Furthermore, we show that potent inhibition of MICA shedding can be achieved by antibodies that bind GEM epitopes adjacent to previously reported cleavage sites, and that these anti-MICA/B antibodies can prevent tumor growth in vivo.
Introduction
The major histocompatibility complex (MHC) class I homologs MICA and MICB are stress-inducible, surface glycoproteins that are up-regulated in many tumor types, including breast, lung, renal, colon, prostate and ovarian cancers.Citation1 MICA and MICB act as ligands for co-stimulation of CD8 + T-cells and stimulation of natural killer (NK) cells by binding and signaling through the NKG2D receptor.Citation2 To escape immune surveillance, tumor cells use metalloproteases to shed MICA/B from the cell surface, and this soluble MICA/B impairs T-cell and NK cell responses.Citation1,Citation3 Targeting MICA/B in cancer immunotherapy is attractive given the observation that some patients who respond to treatment with therapeutic antibodies that block cytotoxic T lymphocyte-associated antigen 4 (CTLA-4) also develop antibodies against MICA, and high titers of anti-MICA antibodies correlate with reduced levels of soluble MICA and increased cytotoxicity of CD8 + T-cells and NK cells.Citation4 Recently, surface stabilization of MICA/B on tumor cells with antibodies that prevent cleavage and subsequent shedding directly demonstrated potent NK-mediated antitumor immunity.Citation5 Hence, identification of antibodies with the greatest potency to inhibit shedding of the most common MICA/B alleles would be valuable.
To identify such antibodies, we aimed to target epitopes that overlap with previously identified cleavage sites.Citation6,Citation7 We immunized mice with MIC protein(s) and retrieved a panel of > 50 antibodies that bound MICA/B. However, due to the limitations of established epitope mapping technologies, it was not readily possible to identify the antibodies that bound near the proteolysis sites. Using the high throughput method of antibody competition, we observed a correlation between antibodies that bound a similar region and shedding inhibition, but the low resolution of this method was unable to reveal any spatial epitope information. Epitope mapping technologies that provide high-resolution at the sequence level include alanine scanning mutagenesis, peptide mapping, oxidative footprinting by fast photochemical oxidation of proteins (FPOP), X-ray crystallography, and cryo-electron microscopy (cryo-EM). All of these methods, however, are low throughput and also suffer from intrinsic limitations. Alanine scanning mutagenesis, where each antigen residue is mutated to alanine and tested for antibody binding, provides epitope mapping at the single residue level, yet not all antigens can tolerate mutagenesis to alanine. Peptide mapping uses overlapping peptides of the antigen sequence to detect antibody binding, but conformational epitopes cannot be detected by this method. FPOP identifies antigen epitopes that are protected from oxidation when bound to an antibody, yet only has sequence resolution at the proteolytic peptide level. Moreover, not all amino acids are equally susceptible to oxidation,Citation8 further limiting its application. With significant advancements in the field, EM is becoming more feasible for epitope mapping. Negative stain 2-dimentional EM analysis can be used in a high throughput manner to grossly map a panel of antibodies;Citation9 however, it generally requires large antigen-binding fragment (Fab) complexes (≥ 100–200 kDa). While X-ray crystallography and single-particle analysis by cryo-EM capture the highest resolution epitope information with a snapshot of intact antigen bound to antibody, these are the most labor-intensive methods and typically reserved for select antibodies.
Thus, limited by the intrinsic trade-off between the resolution and the throughput of existing epitope mapping techniques (Fig. S1), we developed the glycosylation-engineered epitope mapping (GEM) method to provide both high-throughput and high-resolution epitope mapping. GEM uses mutagenesis of single residues at strategic locations within an antigen sequence to introduce an N-linked glycosylation site on the solvent-exposed surface of the protein. When GEM mutants are recombinantly produced in mammalian cells, N-linked glycans are added to the mutation site and provide steric hindrance to antibodies that bind epitopes containing this or neighboring residues. GEM combines the high-throughput nature of competition binding with the high-resolution sequence information of alanine scanning, but it requires far fewer proteins to be produced compared to alanine scanning. As a proof of concept, we applied GEM to the well-characterized anti-human epidermal growth factor receptor-2 (HER2) antibodies, hum4D5 and hum2C4, and their known epitopes on HER2. We demonstrate that GEM epitopes are consistent with mutational analysis and epitopes defined by X-ray crystal structures. We then applied the GEM method to characterize a panel of anti-MICA/B antibodies. GEM allowed rapid and detailed mapping of an epitope that overlaps with known MICA cleavage sites and correlates with strong shedding inhibition of MICA/B from tumor cells. Furthermore, targeting this specific epitope results in surface stabilization of MICA/B and prevention of tumor growth in vivo.
Results
Anti-MICA shedding inhibition activity and correlation to epitope
MICA/B is a type I transmembrane protein with an extracellular domain (ECD) composed of an alpha-1 (α1), alpha-2 (α2), and alpha-3 (α3) domain that adopts an MHC class I-like structure.Citation10 The α1 and α2 domains bind the activating immunoreceptor, NKG2D,Citation11 whereas the α3 domain together with the stalk region is where MICA/B cleavage sites have been identified.Citation6,Citation7 To generate antibodies that could inhibit MICA/B cleavage from cells, we immunized mice with either recombinant human MICA/B ECD or the α3 domain protein of the four most prevalent alleles in the Caucasian population – MICA*002, MICA*004, MICA*008 and MICB*005 (data not shown).Citation12–Citation16 Although more than 91% identical in their α3 domains, these alleles are distinct (Fig. S2). We selected antibodies for the ability to bind both the ECD and the α3 domain of all four alleles by ELISA and identified 59 clones (data not shown). To simplify further characterization of these clones, we focused on a single allele, MICA*008, as it is widely expressed in the populationCitation17 and shares ≥ 92% identity with the other three alleles in the α3 domain, and tested inhibition of its shedding from MEL-JUSO cells in the presence of the antibodies (Table S1). The 59 anti-MICA antibodies exhibit a wide range of shedding inhibition, with 18 antibodies inhibiting shedding of MICA*008 from 1–40%, 26 antibodies from 41–60%, and 13 antibodies from 61–81%.
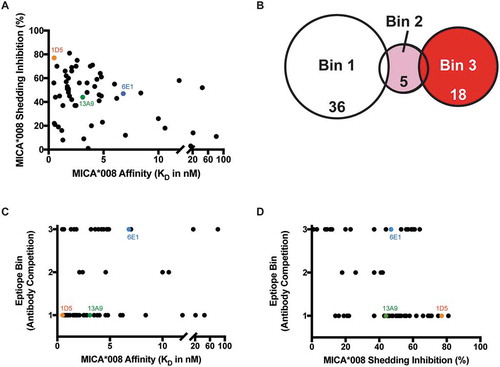
To understand the contributions of affinity and epitope to the shedding inhibition properties of the anti-MICA/B antibodies, we measured binding affinities to the MICA*008 α3 domain and determined epitope bins by competition binding (Table S1). While a wide range of binding affinities were observed (0.5 to 80 nM), there was no strict correlation of affinity to the ability of the antibodies to inhibit shedding of MICA*008 from cells (). Three epitope bins were identified by competition binding experiments. Bin 1 and bin 3 are unique, while bin 2, containing just a few antibodies, shows partial overlap with bins 1 and 3 (). Within bins 1 and 3, wide ranges of affinities are seen, suggesting no correlation between binding affinity and epitope bin (). Finally, we investigated whether shedding inhibition is correlated with binding to a particular epitope on MICA*008 (). Bin 1 contains the 10 antibodies with the highest MICA shedding inhibition activity, while bin 3 has the three antibodies with the lowest shedding inhibition ability, suggesting a potential correlation between epitope and activity (). However, given the wide range of shedding inhibition observed for antibodies in these bins, we required a higher resolution method to more finely map the epitopes that correlate to the strongest MICA shedding inhibition activity.
Figure 1. Anti-MICA antibodies binned by traditional epitope competition experiments elicit a range of shedding inhibition. (A-D) 59 anti-MICA antibodies that bind MICA*002, *004 and *008 and MICB*005 were characterized by competition binding studies. Orange depicts antibody clone 1D5, green 13A9 and blue 6E1. (A) Antibodies do not show a correlation between ability to prevent MICA*008 shedding and affinity to MICA*008. (B) Epitope binning by array-based SPR (Wasatch) competition of anti-MICA antibodies categorizes them into three distinct MICA*008 epitope bins. (C) The three epitope bins determined by antibody competition do not correlate to MICA*008 affinity. (D) The anti-MICA antibodies show a correlation between MICA*008 epitope bin and ability to inhibit shedding. Bin 1 contains the anti-MICA antibodies that inhibit shedding the most, while bin 3 contains those that inhibit shedding the least.
GEM application to anti-HER2 antibodies
To address the need for a high resolution and high throughput epitope mapping method, we developed GEM (). This method modifies a protein antigen sequence to introduce a single, N-linked glycosylation site (N-X-S/T, where X ≠ P). Then, a small number of GEM variants can be screened for binding to a panel of antibodies, where the epitope is defined as the site or sites on an antigen where no (or less) binding to the antibody is seen due to the epitope being masked by N-linked glycosylation. A GEM epitope bin can then be assigned to each antibody, pinpointing the location of its epitope on the protein antigen.
Figure 2. Glycosylation-engineered epitope mapping can finely map an antibody epitope location. (A) Schematic of the glycosylation-engineered epitope mapping (GEM) method. GEM variants are created by introducing a single N-linked glycosylation site (N-X-S/T, X ≠ P) into a protein antigen. The GEM variants are screened for binding to an antibody panel by ELISA. An epitope is defined when loss of binding is observed due to the GEM site being masked by N-linked glycosylation. Antibodies are then grouped into similar high-resolution epitope mapping bins. (B) Cartoon representation of the HER2 ECD (PDB: 1N8Z) crystal structure shows colored spheres at the Asn residue for the 10 engineered N-linked glycosylation sites. Five GEM sites in domain II are predicted to be hum2C4 epitopes, while five sites in domain IV are predicted to be hum4D5 epitopes. (C) Differential scanning fluorimetry (DSF) of HER2 GEM variants shows similar stability to human (Hu) HER2 ECD alone or Hu IgG1 Fc alone. (D) ELISA heat map showing binding of anti-HER2 antibodies hum2C4, hum4D5 and hum7C2 to BSA, wild-type (WT) Hu HER2 ECD or 10 GEM variants. The predicted epitope of each HER2 GEM variant is also indicated. White boxes represent binding, dark gray boxes represent no binding and light gray boxes represent < 30% binding. No binding is defined as ≤ 3 standard deviations of the average BSA controls per plate.
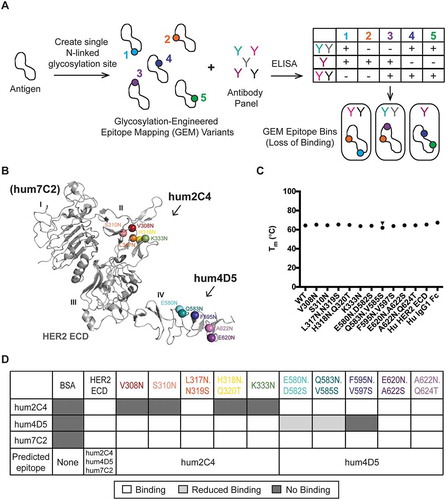
Since crystal structures of the HER2 ECD in complex with the humanized anti-HER2 Fabs hum4D5Citation18 and hum2C4Citation19 are available, we used HER2 to establish our GEM method. Hum2C4 binds loops within domain II of HER2, whereas hum4D5 binds loops within domain IV (). To mitigate the risk of introducing mutations that could cause HER2 misfolding, we preserved the natural N-linked glycosylation sites and designed additional GEM variants. Also, we limited the location of asparagine substitutions to surface-exposed residues by performing solvent accessible surface area (SASA) calculations to ensure N-linked glycan could be added without perturbing the protein structure. Five residues in both domains II (V308N, S310N, L317N.N319S, H318N.Q320T and K333N) and IV (E580N.D582S, Q583N.V585S, F595N.V597S, E620N.A622S, A622N.Q624T) that were identified as part of the epitopes for hum2C4 and hum4D5, respectively, were selected for the location of the GEM variants ().
Thermal stability of the 10 HER2 ECD GEM variants with a C-terminal human IgG1 crystallizable fragment (Fc) tag were measured by differential scanning fluorimetry (DSF), and the melting temperatures shown to be very similar to either the wild-type HER2 ECD alone or the human IgG1 Fc alone (), indicating that the GEM substitutions do not affect stability of the proteins. Additionally, the HER2 GEM variants were analyzed by mass spectrometry to confirm the addition of an N-linked glycan to the engineered site (). All sites contain N-linked glycosylation above background except the HER2 GEM variant A622N.Q624T.
Table 1. Glycopeptide mapping of HER2 GEM variants.
Antibody binding to the wild-type (WT) HER2 ECD, the 10 HER2 GEM variants and the negative control, bovine serum albumin (BSA), was then tested by ELISA (). An additional anti-HER2 antibody, hum7C2, which binds to domain ICitation20 was used as a positive control. Hum2C4 showed a loss of binding to four of the five GEM variants designed within the hum2C4 epitope in HER2, including V308N, S310N, H318N.Q320T and K333N. Of the five GEM variants within the hum4D5 epitope in HER2, hum4D5 was unable to bind to F595N.V597S, and showed significantly reduced binding (< 30% compared to WT) to E580N.D582S and Q583N.V585S. In contrast, hum7C2 was able to bind to all 10 GEM variants of HER2 ECD that were outside of the predicted hum7C2 epitope as well as WT HER2. Overall, these results agree well with the known epitopes of the anti-HER2 antibodies and suggest that GEM could be used to identify epitopes for other antibodies.
Structural analysis of anti-mica epitopes by GEM
With the GEM method established and validated by our study with HER2 antigen, we sought to apply this towards identification of the anti-MICA/B epitopes that correlate with strong shedding inhibition activity. Cleavage sites within the α3 domain of MICA*001 have been previously reportedCitation6,Citation7 and map primarily to one side of the immunoglobulin fold in the crystal structures of MICA*001 (PDB codes 1B3J and 1HYR), which we term the ‘front’ face of the α3 domain (). Given that antibody binding will impose steric hindrance, we hypothesized that epitopes that overlap with cleavage sites would provide the strongest inhibition of MICA shedding. To test this hypothesis, we designed seven MICA*008 GEM variants, four (R202N, G243N, R279N and N298.G299.S300, appended to the C-terminus) that are adjacent to previously reported cleavage sites, and three controls (E215N, I236T (N234 is in the native sequence) and H248N) that are distal to the cleavage sites (). As with the HER2 variants, we preserved the natural MICA*008 N-linked glycosylation sites, targeted surface-exposed residues within loop regions or at the ends of β-strands,Citation21 and used single amino acid changes when possible to avoid causing protein misfolding. All seven GEM variants show glycan occupancy at the engineered sites as confirmed by mass spectrometry (). Additionally, the melting temperatures of the MICA*008-mouse IgG2a Fc GEM variants were determined by DSF. With the exception of E215N and R279N, all the melting temperatures of the MICA variant domains (Tm1) were similar to WT (Fig. S3). E215N showed a Tm1 of ~ 7°C lower than WT, and a Tm1 could not be determined for R279N because high initial fluorescence masked the Tm1. All the Fc domain melting temperatures (Tm2) of the fusion proteins were very similar to mouse IgG2a Fc alone.
Table 2. Glycopeptide mapping of MICA GEM variants.
Figure 3. GEM identifies anti-MICA epitopes correlated with strong shedding inhibition activity. (A) Cartoon representation of the MICA*001 α3 domain crystal structure (PDB: 1HYR) shows (left) previously reported cleavage sites of MICA in yellow or (right) the location of the seven individual MICA*008 GEM variants in colored spheres with the exact substitutions indicated. (B) ELISA heat map of 59 anti-MICA antibodies and their ability to bind to the seven glycosylation-engineered MICA*008 variants. White boxes indicate binding and colored boxes represent a loss of binding of at least 60 %. Eight bins (bins A-H) are identified using the GEM method for the anti-MICA antibodies, and the number of anti-MICA antibodies per bin is indicated. Three bins (bins A, B and D) show ≥ 70% shedding inhibition of MICA*008, and the epitope bin by traditional antibody competition is also shown. (C) All glycosylation site mutations used in GEM are mapped onto the ‘front’ and ‘back’ surface of the MICA*008 α3 domain structure (from the complex with the 13A9 Fab in ). GEM positions defining epitope bins A-H in (B) are mapped onto the surface of the structure and colored according to (A and B). Epitope bins containing antibodies demonstrating 70% or greater inhibition of shedding are highlighted with boxes.
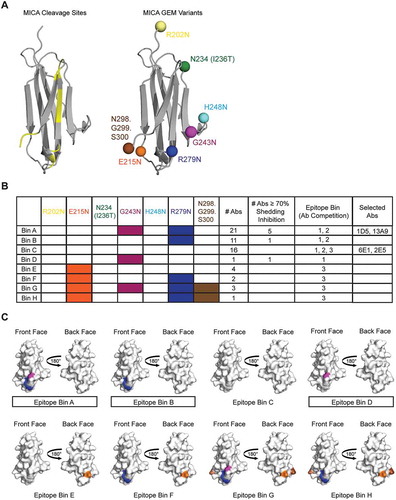
We then tested binding of our 59 anti-MICA/B antibodies to the seven MICA GEM variants and identified eight unique epitope bins (A-H) (). We classified an antibody into an epitope bin when a loss of binding of more than 60% was observed. The binding of some antibodies was affected by multiple GEM variants, suggesting that their structural epitope is clearly distinct from antibodies that show loss of binding to a single site. Therefore, we classified them as separate GEM epitopes. Upon further examination of the antibodies that demonstrate the strongest MICA*008 shedding inhibition (≥ 70%), we find that they fall into bins A, B and D, which include G243N, R279N or both G243N and R279N ( and ). Both G243N and R279N are adjacent to the reported cleavage sites. Taken together, these results support the expectation that antibodies binding epitopes that overlap with cleavage sites will be the most effective at preventing MICA*008 shedding ().
Structural analysis of the 1D5 epitope by FPOP and alanine scanning
To confirm the GEM epitope bin A that was most effective at preventing shedding, we selected 1D5, an antibody with high affinity (KD ≤ 1 nM) and high potency (EC50 ≤ 0.04 µg/mL) for all four MICA/B alleles tested (). We initially tried to determine the epitope of 1D5 using overlapping peptides derived from the MICA*008 α3 domain, but we did not detect binding of 1D5 to any of the peptides, suggesting that a conformational epitope is recognized (data not shown). Next, we performed FPOP on the MICA*008 α3 domain in the presence or absence of the 1D5 Fab, and tryptic or chymotryptic MICA*008 peptides were analyzed by mass spectrometry. A significant change in oxidative protection was observed in the presence of the 1D5 Fab compared to the MICA*008 α3 domain alone for Trp239, within the MICA*008 α3 domain tryptic peptide Asn234-Arg240, and for Ile272 and Phe280, within the chymotryptic peptide Val268-Phe280 (). Interestingly, the chymotryptic peptide Val268-Phe280, contains Arg279, which was identified as part of the 1D5 GEM epitope in bin A ( and ). The other 1D5 epitope residue identified by GEM, Gly243, was not identified as part of the epitope by FPOP ( and ). This is not surprising because glycine is the slowest amino acid to react with hydroxyl radicals, and, therefore, not expected to be oxidized.Citation8
Table 3. Shedding inhibition and affinity of anti-MICA/B antibodies.
Figure 4. 1D5 epitope identified by GEM is consistent with FPOP and alanine scanning. (A) MICA*008 α3 domain peptides that showed a change in oxidation by FPOP when bound to the 1D5 Fab compared to the α3 domain alone are mapped onto the crystal structure. These include the tryptic peptide N234-R240 (cyan) and the chymotryptic peptide V268-F280 (yellow). Residues that showed the greatest change in oxidation are labeled and their side chains are shown. (B) Surface-exposed residues on the ‘front face’ of the α3 domain included in the alanine scan are highlighted. Residues that retain binding to 2E5, an antibody that binds the ‘back face’ of MICA, when mutated to alanine are colored lime green. Residues that lose binding to both 1D5 and 2E5 when mutated to alanine are colored magenta and labeled. (C) Residues identified as part of the 1D5 epitope by alanine scanning are highlighted on the crystal structure. Residues that when mutated to alanine show a mild, moderate, strong or severe decrease in 1D5 binding are colored green, yellow, orange and red, respectively. (D) Comparison of the 1D5 epitope determined by GEM, FPOP and alanine scanning methods. Epitopes determined by the three techniques are colored orange, have their side chains shown as sticks, and residues labeled. For simplicity, only surface-exposed residues are labeled for the FPOP epitope.
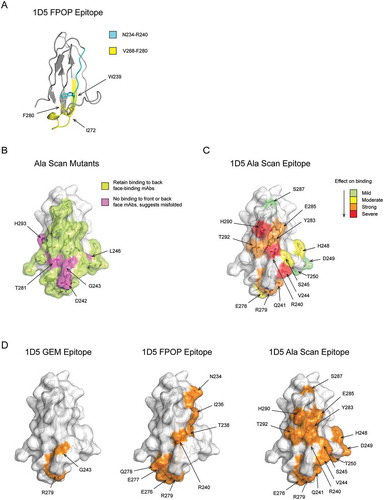
To further validate the epitopes identified by the GEM method with a second orthogonal epitope mapping technology, we carried out alanine scanning. All 33 surface-exposed residues on the ‘front’ face of the MICA*008 α3 domain were individually substituted with alanine and tested for binding to the 1D5 Fab (). To confirm proper folding of each alanine mutant, binding to the 2E5 Fab, which binds with 1.8 nM affinity to the ‘back’ face of MICA*008 (Table S1 and ) was also tested. Alanine mutations that showed a loss of binding to both 1D5 and 2E5 were reasoned to cause misfolding of the MICA*008 α3 domain, and not included in the analysis. Five such mutations (D242A, G243A, L246A, T281A, and H293A) were observed (). Alanine mutations in the MICA*008 α3 domain resulting in the most severe decrease in binding of 1D5 relative to the WT α3 domain included R240A, V244A and H290A, while alanine mutations resulting in a strong decrease in binding of 1D5 included Q241A, R279A, Y283A, E285A and T292A (). We would predict that these eight residues in the strong and severe category are critical for the high-affinity binding of 1D5, and when mapped on the structure, they cluster together at the center of the binding region. Residues mutated to alanine at the periphery of the epitope are expected to result in more subtle changes in binding, and indeed mutations that result in moderate (S245A, H248A, and E276A) or mild decreases in binding (D249A, T250A and S287A) of 1D5 lie on the edge of the epitope surrounding the mutations that cause strong and severe binding decreases ().
The results from the alanine scanning are consistent with the 1D5 epitope mapped by GEM (). Arg279, identified as a key residue of the 1D5 epitope by the GEM method, was also identified as showing a strong decrease in 1D5 binding when mutated to alanine. In addition, residues Arg240, Gln241, and Val244 account for three of the four residues that have the largest impact on binding to 1D5 when mutated to alanine (). These residues flank Gly243 identified by GEM, but the G243A variant had to be excluded from the analysis due to misfolding of the mutant protein. The MICA*008 alanine mutant H248A caused a moderate decrease in 1D5 binding, but did not alter binding when a glycosylation site was engineered at this location. Strikingly, crystal structure determination of the 1D5 Fab in complex with the MICA*008 α3 domain indicated that Arg279 and Gly243 are part of the 1D5 epitope, whereas His248 is not (see below, and Table S3). Using only one-fifth of the variants needed for alanine scanning the ‘front’ face of MICA, GEM enabled accurate identification of the best epitope to prevent shedding.
Figure 5. Strong shedding inhibition of anti-MICA antibodies correlates with binding to GEM epitope bin A, which overlaps with known MICA cleavage sites. (A, top) The epitopes of the 1D5, 13A9, and 6E1 Fabs defined as MICA*008 α3 domain residues within 4.5 Å of the Fabs in the X-ray crystal structures are colored orange, green, or blue, respectively. (A, middle) The Fab epitopes determined by GEM are mapped onto the surface of the α3 domain structure. Residues that when mutated to introduce an N-linked glycosylation site cause a decrease in Fab binding are colored magenta, whereas residues that when mutated do not affect Fab binding are colored lime green. The outline of the 1D5, 13A9, and 6E1 Fab epitopes determined by X-ray crystallography are shown with an orange, green, or blue dotted line, respectively. Note that S297, the carboxy-terminal MICA*008 residue in the structure and part of the 13A9 crystallography epitope, is colored green as a surrogate for the GEM mutant N298.G299.S300, which had no effect on 13A9 binding. (A, bottom) Residues immediately N-terminal to reported MICA*001 α3 domain cleavage sites are colored yellow on the surface of the MICA*008 α3 domain structure. Crystallography epitopes are shown as in (A, middle). (B) Comparison of the co-crystal structures of the 1D5 Fab (orange) or 13A9 Fab (green) bound to the MICA*008 α3 domain (white cartoon). GEM residues Gly243 and Arg279 identified as epitopes are shown as spheres and colored magenta and blue, respectively.
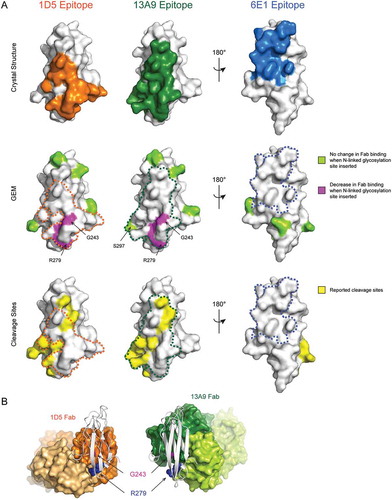
Comparison of the 1D5 epitope mapped by GEM, alanine scanning mutagenesis and FPOP reveals consistent results between the three methods (). Arg279 was identified as a key residue of the 1D5 epitope by all three methods tested. Gly243, which was identified as a key residue of the 1D5 epitope by GEM, was not identified by either FPOP or alanine scanning mutagenesis due to the technical limitations of these technologies. Although each of these epitope mapping methods result in different levels of resolution, the 1D5 epitope mapped by GEM, alanine scanning mutagenesis and FPOP consistently localize 1D5 binding to the ‘front’ face of the MICA*008 α3 domain centered around Gly243 and Arg279.
Structural analysis of the 1D5, 13A9 and 6E1 epitopes by X-ray crystallography
As X-ray crystallography reveals epitope information with high resolution, we used it to ultimately validate our GEM method. In addition to 1D5 we selected 13A9 and 6E1, two antibodies that had single digit nM affinities to MICA*008 ( and ), for structural characterization. 1D5 and 13A9 are in the same GEM epitope bin, but they differ in the degree of binding loss to the G243N and R279N variants. While 1D5 demonstrated almost complete loss of binding to these two GEM variants, 13A9 was characterized by only a partial loss of binding to both (data not shown). We wanted to see if these differences observed in GEM translate to a meaningful difference in the epitope as defined by crystallography. Antibody 6E1 was classified into bin C, a unique bin that did not show impact by any GEM variant (). Additionally, while 6E1 is relatively poor at inhibiting shedding across all four MICA/B alleles tested, 13A9 displays strong shedding inhibition of MICA*002 and MICB*005, two alleles against which 1D5 demonstrated weak shedding inhibition ().
The structure of the 1D5 Fab in complex with the MICA*008 α3 domain confirms that 1D5 indeed binds to the ‘front’ face of the α3 domain (, Top and and ). The epitope, defined as residues within 4.5 Å of the Fab, includes the two critical MICA*008 positions identified by GEM, Gly243 and Arg279. Strikingly, Gly243 is at the center of the epitope, explaining the potent binding inhibition observed by introduction of a glycan at this residue ( and , Middle). Arg279 in MICA*008, identified as a second key epitope residue by the GEM method (), makes several interactions with the 1D5 light chain (LC). The main chain carbonyls of Gly91 and Ser92 of the light chain complementarity-determining region 3 (CDR L3) each form a hydrogen bond with the guanidinium group of the side chain of Arg279 (Fig. S4A). Arg279 also forms an intramolecular salt bridge with Asp242 of MICA, to which the 1D5 heavy chain (HC) also makes two interactions. Tyr35 of CDR H1 makes a hydrogen bond with the main chain carbonyl of Asp242 and Tyr50 of CDR H2 forms a hydrogen bond with the carboxyl group of the Asp242 side chain (Fig. S4B). All residues included in GEM that resulted in no change in 1D5 binding (R202N, E215N, N234 (I236T), H248N, and N298) are also not found to be part of the 1D5 crystallography epitope (, Middle). Thus, the GEM epitope for 1D5 is highly consistent with the crystal structure. In addition, the structure of the MICA α3 domain overlays closely with the α3 domain of the MICA ECD (1B3J), with a root mean square deviation (RMSD) of 0.395 Å across 448 atoms of 605 atoms used for the alignment. The RMSD of the 1D5 epitope region on MICA is 0 Å across 127 atoms. This further confirms that the isolated α3 domain is well folded and the interpretation of binding and structural data will extend to the context of the full length or apo form of the MICA ECD protein.
The structure of the 13A9 Fab in complex with the MICA*008 α3 domain reveals that 13A9 also binds to the ‘front’ face of the α3 domain and that its epitope significantly overlaps with that of 1D5 (, Top and 6B, 6D). Comparison of the GEM and crystallography epitopes reveals that both Gly243 and Arg279, which, when mutated to GEM variants, cause a reduction in 13A9 binding, are indeed part of the crystallography epitope (, Middle). Conversely, all GEM variants that did not alter 13A9 binding (R202N, E215N, N234 (I236T), H248N, and N298) fall outside of the 13A9 crystallography epitope (, Middle). Thus, as is the case for 1D5, the GEM epitope for 13A9 is highly consistent with its crystal structure epitope.
Clone 6E1 was classified as part of GEM bin C and showed no reduction in binding to any of the GEM variants. The structure of the 6E1 Fab in complex with the MICA*008 α3 domain is consistent with this observation. The crystallographic epitope reveals that 6E1 binds to the ‘back’ face of the α3 domain (, Top and 6C and 6D) where no GEM variant had been placed (, Middle).
Comparison of the crystallography epitopes of 1D5 and 13A9 reveals that they overlap significantly (, Tables S3 and S4) and coincide with the reported MICA/B cleavage sites (, Bottom). Whereas 1D5 binds on the lower right side of the ‘front’ face of the α3 domain, 13A9 binds to the upper left side of the ‘front’ face (, Top). These differences also explain why 1D5 binding was completely abolished by both of the GEM variants G243N and R279N, whereas 13A9 demonstrated only a partial loss in binding to these two variants. In good agreement, Gly243 and Arg279 are at the center of the binding interface with the 1D5 Fab, while they are on the periphery of the binding interface with the 13A9 Fab (). Introduction of an N-linked glycan at these residues would certainly disrupt 1D5 binding, but they might be partially accommodated by 13A9 if the asparagine side chains and the attached glycan are oriented away from the 13A9 epitope. Thus, GEM allowed detection of subtle differences between epitopes and rapidly classified MICA epitopes that correlate to strong and weak shedding properties.
In vitro additive activity of anti-MICA antibodies and surface stabilization of MICA
Since 6E1 binds MICA on the ‘back’ face and both 1D5 and 13A9 bind overlapping, but distinct, epitopes on the ‘front’ face, we asked whether combining 6E1 with either 1D5 or 13A9 could prevent MICA shedding at an increased level compared to each antibody alone. 6E1 combined with 1D5 was better at preventing shedding of the MICA*004, MICA*008, and MICB*005 alleles than either antibody individually (). In contrast, an additive effect of 6E1 and 13A9 was observed for MICA only for allele *004 (data not shown). The best improvements seen for the combination of 6E1 and 1D5 compared to each antibody alone was for blocking shedding of the MICB*005 allele, where a > 20% increase was observed (, right panel).
Figure 6. X-ray crystal structures of three distinct anti-MICA Fabs in complex with the MICA*008 α3 domain verify epitopes identified by GEM. The crystal structures of (A) the 1D5 Fab (orange) or (B) the 13A9 Fab (green) in complex with the MICA*008 α3 domain (gray cartoon) shows that both Fabs bind to the ‘front’ face of the α3 domain. (C) The crystal structure of the 6E1 Fab (blue) in complex with the MICA*008 C273S α3 domain (gray cartoon) shows that 6E1 binds to the ‘back’ face of the α3 domain. (D) Overlay of the crystal structures of the three anti-MICA Fabs in complex with the MICA*008 α3 domain, aligned relative to their α3 domains. The 1D5 Fab (orange) and the 13A9 Fab (green) bind to the ‘front’ face of the α3 domain and have overlapping epitopes, whereas the 6E1 Fab (blue) binds to the ‘back’ face.
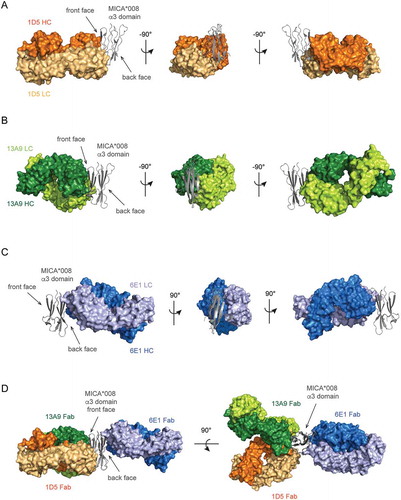
Figure 7. Anti-MICA antibodies can prevent MICA shedding in vitro and show anti-tumor activity in a prevention model in vivo. (A) Shedding inhibition of MICA*008 and 004 alleles and MICB*005 allele are tested with anti-MICA antibodies 1D5, 6E1 and their combination. 1D5 and 6E1 bind non-overlapping epitopes on opposite sides of MICA α3 domain. For all three MICA/B alleles, we see an additive effect in preventing shedding with the 1D5 and 6E1 combination (boxed, solid line) compared to them individually (boxed, dashed line). (B) Treatment of HCC1534 cells in vitro with 1D5 IgG2a or 13A9 IgG2a leads to increased detection of endogenous surface MICA/B. Cells were plated at 12,500 cells per well in 96 well plate. Cells were either incubated with control IgG2a (dark gray, black dashed histogram), 1D5 IgG2a (blue histogram), or 13A9 IgG2a (red histogram) for 24 hours and then stained with anti-MICA/B or an isotype control (light gray histogram). (C) C1R, a human B cell line, was transfected with MICA*002 to generate C1R-MICA*002 for NK killing experiments. Freshly isolated NK cells from normal human donors were added to the C1R-MICA*002 target cells in a 10:1 ratio to assess the in vitro cytolytic activity. Antibodies were added at 10 µg/mL for the assay duration of 4 hrs. Parental C1R cells lacking MHC class I and MICA/B and C1R-MICA*002 cells without antibody treatment (-) served as controls. Data was acquired by flow cytometry following CD56 and 7AAD staining. The NK cytotoxicity was defined as percentage of CD56−7AAD+ in all CD56− target cells. The assay was done in duplicate with NK cells from two different donors. Representative data from one donor is shown. (D) Growth curves of individual HCC1534 tumors. Mice were treated with 10 mg/kg of indicated antibody following tumor cell inoculation. Gray shading indicates days of dosing range.
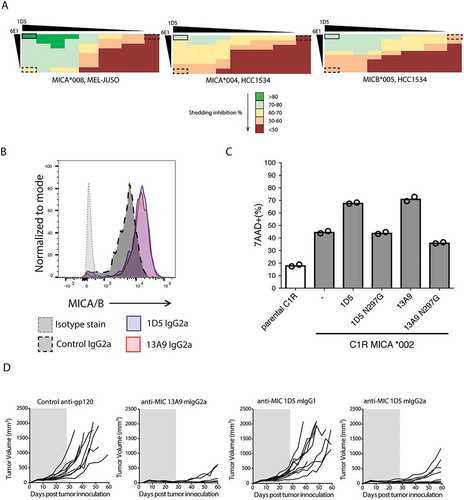
Although 13A9 poorly inhibited shedding of MICA*008 compared to 1D5, it was found to potently inhibit shedding of MICB*005 by 76% with an EC50 of 0.035 µg/mL, while 1D5 inhibited shedding by 60% with a similar EC50 (). Therefore, 1D5 and 13A9 were tested in a flow cytometry-based surface stabilization assay using an HCC1534 human cell line that expresses the MICA*004 and MICB*005 alleles. Following treatment with the α3 domain-specific 1D5 or 13A9 murine (m)IgG2a antibodies, surface expression of MICA/B was quantified using a fluorescently-labeled α1/α2 domain-specific anti-MICA/B antibody, 6D4. In accordance with the shedding inhibition assay, treatment of the MICA/B expressing tumor line, HCC1534, with either 1D5 or 13A9 mIgG2a antibodies in vitro leads to increased cell surface levels of MICA/B (). The 1D5 antibody with a mIgG1 isotype was also tested and displayed similar surface stabilization properties to the mIgG2a isotype (data not shown).
In vitro and in vivo anti-tumor activity of anti-MICA 1D5 and 13A9
Since 1D5 and 13A9 were able to increase cell surface levels of MICA/B and did not interfere with binding to NKG2D (Fig. S5 and data not shown), we tested whether treatment with these antibodies would affect tumor cell killing in vitro. To assess the contribution of MICA on tumor cell killing, we employed the C1R lymphoblastoid line, which is devoid of MHC expression, including the non-classical MHC-I family members MICA and MICB. Whereas the parental C1R cells were susceptible to low levels of NK cell-mediated cytolysis, ectopic expression of MICA increased killing through engaging its receptor NKG2D on NK cells (). The addition of either anti-MICA antibody 1D5 or 13A9 augmented C1R-MICA killing, but not the effectorless N297G variants, suggesting that Fc gamma receptor-mediated activity was required for cytolysis ().
In order to examine the anti-tumor efficacy of anti-MICA/B antibodies in vivo, we employed the HCC1534 model because MICB*005 binds to murine NKG2D (data not shown). Therefore, in Balb/c SCID mice, resident mouse NK cells and macrophage populations are able to respond to HCC1534 tumors. Mice were inoculated with 107 HCC1534 cells, and dosing with either 1D5 or 13A9 began on the same day. Mice were dosed at 10 mg/kg, intravenously for the first dose then intraperitoneally three times a week for four weeks. Untreated and mice treated with an isotype control antibody demonstrated robust HCC1534 tumor growth, with 100% of mice developing tumors (, Left). In contrast, tumor growth in mice treated with 1D5 or 13A9 mIgG2a was significantly delayed, with the majority of tumors demonstrating no growth until after dosing of the antibody was complete (, Right). Interestingly, mice treated with 1D5 mIgG1, which lacks antibody-dependent cell-mediated cytotoxicity activity due to weak binding to murine activating Fcγ receptors, showed only a 9% tumor growth inhibition (TGI), compared with a 91% TGI for the 1D5 mIgG2a and 97% TGI for the 13A9 mIgG2a, suggesting that Fc binding of antibodies by NK cells was critical for tumor regression in our model.
Discussion
Cancer cell recognition by the immune system is in part mediated by the activating receptor NKG2D expressed on cytotoxic T cells and NK cells. The NKG2D ligands, MICA and MICB, are expressed on cancer cells at high levels and shed by the tumor to evade immunosurveillance,Citation22,Citation23 and shed MICA/B proteins have been demonstrated to induce NKG2D internalization.Citation24 Therefore, restoring MICA/B surface levels on cancer cells is an attractive approach for cancer immunotherapy. To this end, we sought to identify anti-MICA/B antibodies that block MICA/B shedding, with the aim of targeting epitopes that overlap with reported cleavage sites. Upon antibody characterization and epitope mapping, we discovered that the resolution of high throughput methods was insufficient to identify clones that bind highly specific epitopes. Thus, we developed GEM as a novel method to rapidly identify anti-MIC antibody epitopes that would reduce MICA/B shedding and provide surface stabilization.
Using seven GEM variants, we investigated the correlation between antibody epitope and its ability to impair MIC shedding in vitro. Using this relatively simple and robust approach, we were able to quickly identify the location of eight distinct epitope bins for 59 antibodies and identified three epitope bins in the MICA/B α3 domain that had superior cleavage inhibition activity. This is quite impressive as GEM uses a limited number of antigen variants compared to alanine scanning mutagenesis. While GEM sacrifices some resolution compared to alanine scanning due to the fewer positions amenable to change as well as binding inhibition from the glycan beyond the single residue level, it provides a high throughput way to triage a large panel of antibodies. In defining the GEM epitopes, we included only the Asn residue to which the glycan is attached and did not extend the epitope definition to surrounding residues, despite the fact that the glycan can provide significant steric hindrance beyond just the Asn. This conservative definition was used because it is difficult to predict the surface area of the protein that the glycan can cover due to heterogeneity in sugars and the large amount of conformational flexibility of a glycan. This may also explain why within a GEM epitope bin variable degree of binding loss can be observed, as illustrated by 1D5 and 13A9. While 1D5 demonstrated complete loss of binding to GEM bin A, 13A9 showed only reduced binding (data not shown). Consistent with the subtle differences in loss of binding to MICA, the crystal structures of 1D5 and 13A9 showed that they bind to the ‘front’ face of the α3 domain of MICA/B with overlapping, yet distinct epitopes. In fact, these modest differences in epitope result in different levels of shedding inhibition. 1D5 showed 74% inhibition of MICA*008 shedding from MEL-JUSO cells, while 13A9 only prevented shedding by 50% (). Thus, GEM has the unique ability to predict slight differences in epitopes that may translate to distinct activity levels.
For the best shedding inhibition of MICA/B, an antibody should either directly block the protease cleavage site or bind distal to the cleavage sites to sterically hinder protease accessibility. The crystallography epitope of 13A9 appears to overlap more with the reported MIC cleavage sites in the MICA*008 α3 domain,Citation6,Citation7 while 1D5 (, Bottom) shows the best potency (). In addition to the α3 domain cleavage sites, MICA/B is clipped in the membrane proximal stalk region.Citation6,Citation7 Different binding orientations of antibodies to the α3 domain could provide different levels of steric hindrance to protease accessibility in the stalk region. Consistent with this notion, 1D5 binds the lower portion of the ‘front’ face of the α3 domain and displays strong shedding inhibition of MICA*008, whereas 13A9 binds the top portion of the ‘front’ face and blocks shedding more poorly ( and ). Furthermore, the reported MICA/B cleavage sites are inferred from detected cleavage products, so it is unclear whether there are 18 unique MIC cleavage sites or if most of these sites were created by exo-peptidases after the initial cleavage event. 6E1, which binds the ‘back’ face of the α3 domain away from the reported cleavage sites, still has shedding inhibition activity, albeit much weaker than the ‘front’ face binding clones. Therefore, steric hinderance of protease accessibility to MICA/B in the α3 domain away from the cleavage sites is also effective at preventing shedding. In fact, in vitro shedding inhibition to multiple MIC alleles was potentiated compared to the individual antibodies by combining the ‘front’ and ‘back’ binding clones 1D5 and 6E1, respectively, making a bispecific molecule an attractive therapeutic format.Citation25,Citation26 Despite the increased activity observed when two antibodies that bind distinct sites on the MICA/B α3 domain are combined, complete shedding inhibition was not achieved, suggesting that targeting the stalk region may also be required.
Based on the high prevalence of MICA*008 across multiple ethnic groups, we selected this allele for our primary analysis. However, we noticed differential shedding inhibition levels of a given antibody with different MICA alleles. This effect was not driven by cell-intrinsic differences between cell lines, as ectopic expression of different MICA alleles in the same host cell resulted in differential sensitivities to antibody treatment. While 1D5 shows strong shedding inhibition of MICA alleles 004 and 008 and weak inhibition for MICA*002 and MICB*005, 13A9 shows the inverse preferences. Most of the amino acid differences between alleles fall outside of the crystallography-defined epitopes for 1D5 and 13A9 (data not shown). Thus, there is no simple structural explanation for the different levels of shedding inhibition between MIC alleles. Additional studies to elucidate the allele specific cleavage mechanisms responsible for shedding of MICA/B from tumor cells are needed.
The inhibition of MICA/B shedding by the 1D5 and 13A9 antibodies leads to surface stabilization of MICA/B ligands in vitro. Surface stabilization was associated with increased target cell killing in vitro. Similar to these in vitro cytolytic assays, the in vivo anti-tumor activity relied on mouse FcγR engagement as antibodies of the murine IgG2a isotype result in more potent tumor rejection than those with the murine IgG1 isotype. This is consistent with the recent finding that an anti-MICA/B human IgG1 antibody triggered stronger cytotoxicity from human NK cells than a variant with the D265A/N297A mutations that abrogate FcγR binding.Citation5 This suggests induction of NK effector function may require interactions beyond MICA/B and NKG2D, such as the recently described requirement for engagement of the human NK-cell, Fc receptor CD16.Citation5 Human MICA*002 and MICB*005 are able to bind the murine NKG2D receptor (data not shown) and our in vivo studies with HCC1534 MICB*005 tumor models found that mouse FcγR interactions are required to strengthen the interaction between human tumor and murine NK cells. The quaternary complex between MICB, NKG2D, CD16 and the anti-MICA/B antibody may help to compete with binding of higher affinity murine NKG2D ligands such as MULT1 or provide a costimulatory signal similar to previous observations.Citation5
GEM is a particularly attractive epitope mapping strategy when a crystal structure of the antigen exists because it facilitates GEM variant design. However, in the absence of an antigen crystal structure, we have had success designing GEM variants and interpreting mapping results using a structural homology model (data not shown). To create the GEM variants, we either introduced an Asn or Ser/Thr to create the consensus motif for N-linked glycosylation, N-X-S/T, on the protein antigen surface. This was relatively easy as Ser and Thr are found in protein sequences quite frequently,Citation27 with Asn, Ser or Thr being surface exposed ~ 57% or 50% of the time, respectively.Citation28 As GEM requires mammalian or other expression systems that are capable of N-linked glycosylation, proteins that can only be made in E. coli are not compatible with GEM. Fortunately, this is likely a rare case for eukaryotic target proteins as protein expression and folding problems more often arise with complex mammalian proteins that cannot be produced in E. coli. Among human secreted and membrane proteins in UniProt, only 53% of all N-X-S/T sites are annotated to be glycosylated,Citation21 but, of our 17 designed GEM variants, only one was found to be aglycosylated. Although we examined two antigens that contain native N-linked glycosylation sites, proteins that are not natively glycosylated are also amenable to GEM (data not shown), as introducing glycosylation can often be stabilizing.Citation29,Citation30 This is further supported by our experience with MICA, where five alanine scan variants resulted in poorly folded protein, including G243A, whereas the G243N GEM variant resulted in properly folded protein, allowing G243 to be identified as part of the epitopes of the highly potent anti-MICA/B antibodies 1D5 and 13A9.
In addition to the examples provided here, there are other potential applications for GEM. One can target a region of interest on a receptor known to provide more potency. For example, bispecific antibodies that retarget cytotoxic T-cells to kill tumor cells prefer a membrane-proximal epitope on their tumor antigen for increased cell killing.Citation31 Similarly, a glycosylation site could be engineered into a ligand to block receptor binding, allowing one to screen for antibodies that hit the receptor-binding epitope on the ligand. Conversely, GEM could be utilized for negative selection where one could discard antibodies that are not desired, perhaps towards a specific epitope correlated to poor activity or a highly conserved region. Particularly of interest in the increasingly competitive market of antibody therapeutics, GEM could target epitopes where there is freedom to operate or eliminate regions where there is not.Citation32 The technology can also be utilized beyond antibody applications to study protein-protein interactions in general, such as identifying the interacting domain of a binding partner within a multidomain protein or elucidating the contacts in a binding interface in greater detail. In summary, GEM is a high-throughput, high-resolution epitope mapping approach that provides the ability to rapidly triage large panels of antibodies and determine the location of binding and interaction sites at the resolution level of individual amino acids.
Accession numbers
6DDM (1D5 Fab-MICA*008), 6DDR (13A9 Fab-MICA*008), 6DDV (6E1 Fab-MICA*008).
Materials and methods
Plasmids
For immunization, antibody characterization, and FPOP: DNA encoding the human MICA*002, MICA*004, MICA*008 and MICB*005 extracellular domains (ECD) (residues Glu24-Ser297) with a C-terminal Flag, the MICA/B α3 domains (residues Thr204-Ser297) or the MICA*008 C273S variant, both with a C-terminal His8 or a murine IgG2a Fc, were cloned into pRK mammalian expression vector.Citation33 Anti-MICA and anti-HER2 Fabs with a C-terminal Flag were cloned as murine/human chimeras into pRK or E. coli expression vectors as previously described.Citation34
For GEM and Alanine Scan: DNA encoding the HER2 ECD (residues Gln24-Gln646) with a C-terminal human IgG1 Fc and variants were cloned. MICA GEM and Ala variants were made using the wild-type or C273S MICA*008 α3 domain-mouse IgG2a Fc fusions, respectively, described above.
For crystallography: DNA encoding both the wild-type human MICA*008 α3 domain (residues Thr204-Ser297) and a C273S mutant with an N-terminal, thrombin-cleavable His6 were cloned into a slightly modified version of the baculovirus expression vector, pAcgp67 (BD Biosciences) for insect cell secreted expression. DNA encoding Streptomyces plicatu EndoH (residues Phe2-Pro313) was also cloned into a slightly modified version of pAcgp67.
Protein Expression and purification
For immunization, antibody characterization, and FPOP: Flag-tagged MICA/B ECDs or His-tagged α3 domains were expressed in CHO DP12 cells as previously described,Citation35 affinity purified using anti-Flag M2 (Sigma Aldrich) or Ni Sepharose Excel (GE Healthcare) columns, respectively, followed by size-exclusion chromatography using a HiLoad Superdex 75 pg column (GE Healthcare).
For GEM and Alanine Scan: anti-HER2 Fabs with a C-terminal Flag and MICA or HER2 fusions with mouse IgG2a Fc or human IgG1 Fc, respectively, were expressed in Expi293TTM cells.Citation36,Citation37 Fabs were affinity purified in batch using anti-Flag resin. MICA and HER2 Fc fusions as well as mouse IgG2a Fc only were column purified using Protein A (Gore Device) and a Superdex 200. A human IgG1 Fc control was generated by cleaving a human IgG1 antibody with Lys-C followed by purification of the Fc fragment on an SP-column. The HER2 ECD (Sino Biological 10,004-H08H, residues Thr23-Thr652 with a C-terminal His tag) control was also used.
For crystallography and FPOP: Fabs were expressed in the E. coli strain 64B4 or derivatives thereof.Citation38 The 13A9 and 6E1 Fabs were expressed in shake flasks and the 1D5 Fab was expressed by fermentation as previously described.Citation39,Citation40 E. coli were pelleted, resuspended in 25 mM Tris, pH 7.5, 150 mM NaCl, 5 mM EDTA, and lysed by microfluidization. 0.4% polyethyleneimine (PEI) was added before centrifugation and filtering. Fabs were purified using GammaBind Plus Sepharose (GE Healthcare) followed by an SP Sepharose High Performance column (GE Healthcare) or a HiLoad Superdex 200 pg column (GE Healthcare). Fabs were dialyzed into 25 mM Tris, pH 7.5, 150 mM NaCl prior to complex formation.
The human MICA*008 α3 domain (WT or C273S) containing an N-terminal, thrombin-cleavable His6 was co-expressed with Streptomyces plicatu EndoH in Trichoplusia ni cells using a baculovirus expression system in the presence of 1 mg/L kifunensine. After 48 hours, supernatants were adjusted to a final concentration of 50 mM Tris, pH 8.0, 5 mM CaCl2, 1 mM NiCl2, centrifuged, filtered and pH adjusted to 7.0. The α3 domain was purified with Ni Sepharose Excel (GE Healthcare) and His6 tag removed by thrombin (GE Healthcare) cleavage. After filtering, untagged MICA*008 was purified via reverse Ni Sepharose Excel, a HiLoad Superdex 75 pg column (GE Healthcare) and a Mono S GL column (GE Healthcare). Untagged α3 domain was dialyzed into 25 mM Tris, pH 7.5, 150 mM NaCl prior to complex formation.
Fab-MICA complexes were formed from a two-fold molar excess of the MICA*008 α3 domain incubated at 4 °C overnight with the Fabs. Complexes containing the 1D5 or 13A9 Fabs were formed with wild-type α3 domain, whereas 6E1 was formed with the C273S mutant. Complexes were purified over a HiLoad Superdex 75 pg column (GE Healthcare).
Generation of anti-MICA/B antibodies
All procedures were approved by Genentech’s Institutional Animal Care and Use Committee before initiation. Antibodies were generated in BALB/c mice. 6E1 came from a protocol using MICA ECD fused to Fc and resuspended with 2-component Ribi in phosphate-buffered saline (PBS) as an immunogen. 1D5 was generated using MICA α3 domains (MICA alleles 002, 004, 008 and MICB*005) fused to murine IgG2a (in house) resuspended with Complete Freund’s Adjuvant in PBS as immunogen. 13A9 was produced using MICA/B ECD domains (alleles as above) with a C-terminal Flag tag using a cocktail consisting of poly I:C+ monophosphoryl lipid A (MBL+ R848+ CpG) in PBS as immunogen. Hybridoma fusions were carried out as described previously.Citation41
MICA/B shedding inhibition assay
Human tumor cell lines MEL-JUSO (Skin melanoma, MICA*008 allele), PANC-1 (pancreatic carcinoma, MICA*002) and HCC1534 (lung adenocarcinoma, MICA*004/MICB*005) were used to examine antibody mediated shedding inhibition. All tumor cells were cultured in RPMI1640 supplemented with 10% fetal bovine serum and 1x GlutaMAX (Thermo Fisher Scientific). To examine shedding inhibition, the tumor cells were harvested and washed with fresh culture medium. 40 µL of cell suspension containing 1 × 10⁴ cells were added to each well of a 384-well polystyrene tissue culture plate (Greiner) followed by adding 40 µL culture medium (control) or 40 µl culture medium containing antibody at 10 µg/ml (67 nM) final concentration (≥ 10-fold the KD for the majority of anti-MICA/B antibodies tested). Cells were then incubated at 37°C, 5% CO2 for 24 hours, and then the culture supernatant harvested and stored at −80 °C.
To quantify shed (s) MICA or MICB in tissue culture supernatant, two sandwich ELISA assays were developed. For sMICA*002, sMICA*004 and sMICA*008 quantification, an anti-MICA mAb (clone AMO1, MBL) was used as the capture antibody and a biotinylated mAb (clone 8C5, Genentech) was used as the detection antibody. For sMICB*005 quantification, an anti-MICB mAb (clone 236,511, R&D systems) was used as the capture antibody and a biotinylated mAb (clone 7E3, Genentech) was used as the detection antibody. ELISA assays were performed based on standard sandwich ELISA protocol. Recombinant MICA*002, MICA*004, MICA*008 and MICB*005 protein were used as the quantification standard. Percent of shedding inhibition of was defined as (1-(sMIC concentration in antibody treated supernatant)/(sMIC concentration in control supernatant))*100. To examine testing antibody-mediated assay interference, tumor cell culture supernatant was first harvested and antibody was spiked into harvested culture supernatant. The sMIC concentration in antibody spiked supernatant was quantified and compared to unspiked sample to determine the degree of assay interference. The lowest assay sensitivity is 15.6 pg/mL.
Biacore
The binding kinetics of the anti-MICA/B antibodies were measured using surface plasmon resonance (SPR) on a Biacore T200 instrument (GE Healthcare). Anti-murine Fc (GE Healthcare) was immobilized on a CM5 sensor chip via amine-based coupling. Anti-MICA/B antibody was captured and human MICA/B α3 domains were flowed over (MICA*002, MICA*004, MICA*008, MICB*005 with His tag or MICA*008.C273S.mouse IgG2a Fc variants). MICA/B was injected 2–3 minutes, at a flow rate of 30 μl/min, at 25°C in running buffer (10 mM HEPES pH 7.4, 150 mM NaCl, 0.005% Tween 20 and 3 mM EDTA) and dissociation was monitored for 5 or 10 minutes. The surface was regenerated between binding cycles with 10 mM Glycine HCl pH 1.7. Sensorgrams were blank subtracted and analyzed using a 1:1 Langmuir binding model with software supplied by the manufacturer.
Antibody competition by Wasatch
A 96 × 96 array-based SPR imaging system (Carterra USA) was used to epitope bin a panel of anti-MICA/B antibodies. Purified monoclonal hybridoma antibodies were diluted at 10 µg/ml in 10 mM sodium acetate buffer pH 4.5. Using amine coupling, antibodies were directly immobilized onto a SPR sensorprism CMD 200M chip (XanTec Bioanalytics, Germany) using a Continuous Flow Microspotter to create an array of antibodies. For binning analysis, the IBIS MX96 SPRi was used to evaluate binding to the immobilized antibodies. The experiment was performed at 25°C in running buffer (Biacore section). Antigen was injected for 4 minutes at 100 nM and then antibody at 10 µg/ml was injected for 4 minutes. The surface was regenerated between cycles with 10 mM glycine pH 2.0 and data processed using the Wasatch binning software tool.
Solvent accessible surface area prediction
Calculations of Solvent Accessible Surface Area (SASA) were done using GETAREA (http://curie.utmb.edu/getarea.html) on the MICA crystal structures (PDB: 1B3J and 1HYR) and the HER2 ECD crystal structure (PDB: 1N8Z). Residues were considered surface exposed if one or both calculations predicted “outside”, no prediction was made, or if a manual structural check using PyMOL contradicted an “inside” prediction from the calculations.
Differential scanning fluorimetry
Protein stability was determined as previously describedCitation34 for HER2-hIgG1 Fc and using 0.5 mg/mL of MICA-mIgG2a Fc.
ELISA for GEM
Hybridoma derived anti-MIC antibodies were tested for binding to the MICA*008 α3 GEM-mouse IgG2a Fc variants, while recombinant anti-HER2 Fabs were tested for binding to the HER2- human IgG1 Fc GEM variants. Nunc maxisorp plates were coated with 2 µg/ml of GEM variants in PBS. Antibodies were added to the plates after blocking with 1X PBS with 0.5% BSA and 0.05% Tween 20. After incubation, plates were washed with wash buffer (1X PBS with 0.05% Tween 20) and secondary antibody (goat anti-mouse F(ab’)2-HRP for MICA or goat anti-human F(ab’)2-HRP for HER2) was added. Plates were washed before adding either BioFX TMB Microwell 1 Component Peroxidase or tetramethylbenzidine (TMB) substrate (KPL). After several minutes of incubation, the reaction was stopped with BioFX stop solution or 1 N solution of HCl, respectively. Plates were read on a Spectra MAX 340 plate reader at either 630 or 450 nm, respectively (Molecular Devices).
Glycosylation site occupancy determination
40 µg purified WT MICA, MICA GEM variants, WT HER2 or HER GEM variants were reduced with 10 mM dithiothreitol (37°C for one hour, Sigma, St. Louis, MO), alkylated with 20 mM iodoacetic acid (Sigma, 20 minutes at ambient temperature), deglycosylated with PNGaseF (Sigma, 1U, 37°C, 18 hours) then digested with either trypsin, chymotrypsin, glutamyl endopeptidase from S. aureus, or Aspariginyl peptidase from P. fragi in 50 mM ammonium bicarbonate pH 8, overnight at 37°C (0.2 µg or 2 µg enzyme, Roche). Solid phase extraction was used to clean samples which were then dried and reconstituted in 10 µL of 2% acetonitrile:0.1% formic acid. Samples were injected via auto-sampler to a BEH µC18 column (Waters Corp) at a flow rate of 1 µL/min using a NanoAcquity UPLC (Waters Corp). A gradient from 98% solvent A (aqueous) to 80% solvent B (organic) was applied over 40 minutes. Samples were analyzed on-line via nanospray ionization into a hybrid LTQ-Orbitrap Elite mass spectrometer (Thermo Fisher Scientific). Data was collected in data dependent mode with the parent ion being analyzed in the orbitrap and the top 8 most abundant ions selected for fragmentation in the LTQ. Data were searched using Protein Metrics Byonic with variable deamidation (Asn), oxidation (Met) and carbamidomethyl (Cys) options selected. Byologic software (Protein Metrics) was used to quantify sites of N-linked glycosylation as evidenced by the presence of asparaginyl deamidation.
Fast photochemical oxidation of proteins
Hydroxyl radical labeling using FPOP was performed as previously described.Citation42 A 1.5:1 molar ratio of 1D5 Fab:MICA*008 α3 domain with a C-terminal His8 tag was prepared in PBS (2.35 mg/mL), incubated at 37 °C for 30 minutes and size-exclusion chromatography performed. Unbound MICA was prepared at 2.35 mg/mL in 1 mL PBS. Scavenger Arginine was then added at 30 mM final concentration and flow-mixed with 30 mM peroxide during labeling. To account for background oxidation, an unexposed sample was compared to three oxidized replicates for each protein state. Samples were reduced, deglycosylated with PNGaseF, alkylated with iodoacetamide and separated by SDS-PAGE. The ~ 15 kDa region corresponding to the MICA*008 α3 domain was excised and digested with trypsin and chymotrypsin at a 1:500 enzyme:substrate ratio. After C18 clean up, dried and reconstituted samples were chromatographically separated and analyzed on a hybrid Elite Orbitrap mass spectrometer (Thermo Fisher Scientific) using conditions described previously.Citation43 Resultant spectra were interrogated against in silico digestions. Oxidation of Cysteine, Tryptophan, Tyrosine, Methionine, Phenylalanine, Histidine, Arginine, Leucine and Isoleucine were quantified by measuring areas under the curve of the matching modified ions versus total occurrence of a given peptide. Oxidation events for both the complex and the unbound MICA*008 α3 domain were mapped onto the sequence and regions of protection were observed as having a significant change between the two values.
Crystallization, X-ray data collection and structure determination
All Fab-MICA complexes were concentrated to 20 mg/mL in 25 mM Tris, pH 7.5, 150 mM NaCl for crystallization. Crystals of the 1D5 Fab-MICA*008 complex grew over 30 days at 4 °C in vapor diffusion hanging drops from a 1:1 mixture of protein to well solution (0.1 M sodium acetate, pH 4.6, 25% PEG4000). Crystals were cryo-protected using well solution, flash frozen, and stored in liquid nitrogen. Data were collected at the SER-CAT 22-ID beamline at the Advanced Photon Source (Argonne National Laboratory). Crystals of the 13A9 Fab-MICA*008 complex grew overnight at 19 °C in vapor diffusion hanging drops from a 2:1 mixture of protein to well solution (0.01 M ZnSO4, 0.1 M MES, pH 6.5, 25% PEG 550 MME). Crystals were crushed with a Seed Bead kit (Hampton Research), diluted 1:500 in well solution, and streak seeded into a 1:1 mixture of protein to well solution (0.01 M ZnSO4, 0.1 M MES, pH 6.5, 16–18% PEG 550 MME). Seeded crystals grew over three days at 19 °C in vapor diffusion hanging drops. Crystals were cryo-protected in 25% glycerol, 0.01 M ZnSO4, 0.1 M MES, pH 6.5, 15% PEG 550 MME, flash frozen, and stored in liquid nitrogen. Diffraction data were collected at the Advanced Light Source beamline 5.0.2 (Lawrence Berkeley National Laboratory). Crystals of the 6E1 Fab-MICA*008 C273S complex grew over five days at 19 °C in vapor diffusion hanging drops from a 1:1 mixture of protein to well solution (0.1 M tri-sodium citrate, 15% isopropanol, 15% PEG 4000). Crystals were cryo-protected using well solution with the addition of 25% glycerol, flash frozen, and stored in liquid nitrogen. Diffraction data were collected at the Stanford Synchrotron Radiation Lightsource beamline 12–2 (SLAC National Accelerator Laboratory). All data were collected under cryo-cooled conditions (100 K) at the indicated wavelengths (Table S2).
Data were integrated and scaled using HKL2000.Citation44 The 1D5 Fab-MICA*008 crystal belonged to the P21 space group with one Fab-MICA complex in the asymmetric unit (ASU). Both the 13A9 Fab-MICA*008 crystal and the 6E1 Fab-MICA*008 C273S crystal belonged to the P212121 space group, each with one Fab-MICA complex in the ASU (Table S2). All structures were determined by molecular replacement using PHASER-MR in PHENIX.Citation45 The CL (residues 108–212 of chain A) and CH1 (residues 121–220 of chain B) domains from the Fab of trastuzumab (Herceptin®) (Protein Data Bank (PDB) accession 1N8Z) were used as search models for the Fab constant domains. Residues 1–108 of chain L from PBD accession 4M1G and 1–113 of chain H from PDB accession 1F3D were used as search models for the variable domains of the 1D5 Fab. Residues 1–107 of chain A from PDB accession 1A2Y and 2–113 of chain B from PDB accession 4J8R were used as search models for the variable domains of the 13A9 Fab. Residues 2–113 of chain B from PDB accession 4J8R and 1–107 of chain J from PDB accession 1F3D were used as search models for the variable domains of the 6E1 Fab. For the 1D5 Fab-MICA*008 complex residues 181–274 of chain C from MICA*001 PDB accession 1HYR was used as a search model for the MICA*008 α3 domain. For subsequent structures of the 13A9 Fab-MICA*008 and 6E1 Fab-MICA*008 complexes, residues 204–297 of MICA*008 from the 1D5 Fab-MICA*008 complex was used as a search model for the α3 domain. All models were built using CootCitation46 and refined in Refmac in CCP4Citation47,Citation48 and PHENIX.Citation45 Mean B-factors were calculated using Baverage in CCP4Citation48 and Wilson B-factors calculated using Xtriage in PHENIX.Citation45 Ramachandran statistics and rotamer outliers were calculated using PDB Tools in PHENIX.Citation45 Contacts were analyzed with Contact/NCONT and PISA in CCP4.Citation48 All structure figures were generated with Pymol (https://pymol.org). The final 1D5 Fab-MICA*008 model contains residues 1–214 of the 1D5 LC, residues 2–216 of the 1D5 HC, and residues 204–297 of the MICA*008 α3 domain, with residues 215–220 of MICA*008 disordered in the structure. The final 13A9 Fab-MICA*008 model contains residues 1–214 of the 13A9 LC, residues 1–217 of the 13A9 HC, and residues 204–297 of the MICA*008 α3 domain. The final 6E1 Fab-MICA*008 model contains residues 1–212 of the 6E1 LC, residues 2–214 of the 6E1 HC, and residues 204–297 of the MICA*008 α3 C273S domain.
In vitro MICA surface stabilization assay
1-2x10⁴ cells were plated per well in 96 well flat bottom plate with 5 µg/mL antibody for 24 hours. Cells were harvested, live/dead stained, stained for isotype control or MICA surface expression (anti-MICA/B [6D4] AF647), and fixed before running on BD Biosciences Fortessa. Each histogram was normalized to (population) mode to correct for slight variations in the number of collected events in FlowJo. 2500–5000 live cell events were collected per sample.
In vivo tumor experiments
Experiments were conducted in 8–10 week old mice and all procedures were approved by the appropriate Institutional Animal Care and Use Committee before initiation. Mice were inoculated by subcutaneous injection of 10 × 106 HCC1534 cells suspended in 100 µL of HBSS and matrigel into the right unilateral flank of female Balb/c SCID mice (CBySmn.CB17-Prkdcscid/J) (JAX Cat No. 001803). Animals were distributed into treatment groups (n = 10 per group) and treatment was initiated on the same day following cell inoculation. All antibodies were administered at 10 mg/kg intravenously in sterile Histidine Buffer 8 for the first dose, then intraperitoneally for the remaining doses. Dosing frequency was determined at three times a week (TIW) for four consecutive weeks. Tumor volumes and body weights were recorded twice weekly over the course of the study. Tumor volumes were determined using digital calipers (Fred V. Fowler Company, Inc, Newton, MA) using the formula (L x W x W)/2. Mice with tumor volumes > 2000 mm3 or recorded body weight loss of > 20% from their weight at the start of treatment were promptly euthanized.
Calculation of tumor growth inhibition (TGI)
A mixed modeling approach was used to analyze the repeated measurement of tumor volumes from the same animals over time (Pinheiro et al. 2008) as this approach addresses both repeated measurements and modest dropouts before study end. Cubic regression splines were used to fit a nonlinear profile to the time courses of log2-transformed tumor volumes in each group. Fitting was done via a linear mixed-effects model, using the package “nlme” (version 3.1–108) in R version 2.15.2 (R Development Core Team 2008; R Foundation for Statistical Computing; Vienna, Austria). Percent tumor growth inhibition (%TGI) was calculated from the average daily area under the curve (AUC) of the cubic regression splines (on the original linear mm3 volume scale) of treatment and control groups over a common time period according to the following formula:
Conflict of interest
All authors are current or former employees of Genentech, Inc., a member of the Roche Group, and may hold stock and options. This work was funded and conducted by Genentech, Inc.
Author Contributions
TNL, CS and JK devised the conceptual framework of the study. JBIII performed in vitro antibody characterization. RC and ZY performed shedding inhibition assays and analyzed data. TNL conducted experiments and data analysis pertaining to GEM. MLM carried out the protein purification, crystallography and structure analysis. AMB, ET and JMS conducted and analyzed in vivo and surface stabilization experiments. WS and PL analyzed glycan occupancy by mass spectrometry. CD carried out blocking experiments in presence of 1D5. YG and PS conducted the FPOP experiments. YG, PS and WS analyzed the FPOP data. TNL, MLM, JK and CS wrote the manuscript. All authors read and approved the final manuscript.
Abbreviations
| ASU | = | asymmetric unit |
| AUC | = | area under the curve |
| BSA | = | bovine serum albumin |
| CHO | = | Chinese hamster ovary |
| cryo-EM | = | cryo-electron microscopy |
| DSF | = | differential scanning fluorimetry |
| ECD | = | extracellular domain |
| ELISA | = | enzyme-linked immunosorbent assay |
| EM | = | electron microscopy |
| Fc | = | fragment crystallizable |
| FPOP | = | fast photochemical oxidation of proteins |
| GEM | = | glycosylation-engineered epitope mapping |
| HER2 | = | Receptor tyrosine-protein kinase erbB-2 |
| NK cell | = | Natural killer cell |
| MHC | = | major histocompatibility comple |
| MICA/MICB | = | major histocompatibility complex class I polypeptide related sequence A/B |
| PBS | = | phosphate-buffered saline |
| PDB | = | Protein Data Bank |
| RMSD | = | root mean square deviation |
| SASA | = | solvent accessible surface area |
| TGI | = | tumor growth inhibition |
| Tm | = | melting temperature |
| WT | = | wild-type |
Supplemental Material
Download Zip (3.1 MB)Acknowledgments
We thank the Biomolecular Resource group, especially Yvonne Franke, for construct generation and insect cell expression, Patrick Lupardus for HER2 construct design, the Research Materials Group for mammalian cell expression, the Antibody Production Group, especially Sophia Lee and Farzam Farahi, and May Lin and Maria Lorenzo in Protein Chemistry for their purification and characterization of antibodies and antigens. We thank Steve Lianoglou for bioinformatics support in categorizing the most common MICA/B alleles. We would like to thank Christine Tan and Meredith Hazen for their contributions to the anti-MICA/B antibody campaigns. We thank Aaron Wecksler for access to instruments and scientific guidance with FPOP experiments. The Advanced Light Source and the Berkeley Center for Structural Biology at the Lawrence Berkeley National Laboratory, the Advanced Photon Source and the Southeast Regional Collaborative Access Team (SER-CAT) at the Argonne National Laboratory, and the Stanford Synchrotron Radiation Lightsource (SSRL) and the SSRL Structural Molecular Biology Program at the SLAC National Accelerator Laboratory are acknowledged for providing X-ray sources for collecting crystallographic data. The Berkeley Center for Structural Biology is supported in part by the National Institutes of Health, National Institute of General Medical Sciences, and the Howard Hughes Medical Institute. The Advanced Light Source is a Department of Energy Office of Science User Facility under Contract No. DE-AC02-05CH11231. Supporting institutions of SER-CAT may be found at www.ser-cat.org/members.html. Use of the Advanced Photon Source was supported by the U. S. Department of Energy, Office of Science, Office of Basic Energy Sciences, under Contract No. W-31-109-Eng-38. Use of the Stanford Synchrotron Radiation Lightsource, SLAC National Accelerator Laboratory, is supported by the U.S. Department of Energy, Office of Science, Office of Basic Energy Sciences under Contract No. DE-AC02-76SF00515. The SSRL Structural Molecular Biology Program is supported by the DOE Office of Biological and Environmental Research, and by the National Institutes of Health, National Institute of General Medical Sciences (including P41GM103393). The contents of this publication are solely the responsibility of the authors and do not necessarily represent the official views of NIGMS or NIH.
Supplemental data
Supplemental data for this article can be accessed on the publisher's website.
Related Research Data
References
- Groh V, Rhinehart R, Secrist H, Bauer S, Grabstein KH, Spies T. Broad tumor-associated expression and recognition by tumor-derived gamma delta T cells of MICA and MICB. Proc Natl Acad Sci USA. 1999;96:6879–6884.
- Bauer S, Groh V, Wu J, Steinle A, Phillips JH, Lanier LL, Spies T. Activation of NK cells and T cells by NKG2D, a receptor for stress-inducible MICA. Science. 1999;285:727–729.
- Salih HR, Rammensee HG, Steinle A. Cutting edge: down-regulation of MICA on human tumors by proteolytic shedding. J Immunol. 2002;169:4098–4102.
- Jinushi M, Hodi FS, Dranoff G. Therapy-induced antibodies to MHC class I chain-related protein A antagonize immune suppression and stimulate antitumor cytotoxicity. Proc Natl Acad Sci USA. 2006;103:9190–9195. doi:10.1073/pnas.0603503103.
- Ferrari de Andrade L, Tay RE, Pan D, Luoma AM, Ito Y, Badrinath S, Tsoucas D, Franz B, May KF Jr., Harvey CJ, et al. Antibody-mediated inhibition of MICA and MICB shedding promotes NK cell-driven tumor immunity. Science. 2018;359:1537–1542. doi:10.1126/science.aao0505.
- Waldhauer I, Goehlsdorf D, Gieseke F, Weinschenk T, Wittenbrink M, Ludwig A, Stevanovic S, Rammensee HG, Steinle A. Tumor-associated MICA is shed by ADAM proteases. Cancer Res. 2008;68:6368–6376. doi:10.1158/0008-5472.CAN-07-6768.
- Wang X, Lundgren AD, Singh P, Goodlett DR, Plymate SR, Wu JD. An six-amino acid motif in the alpha3 domain of MICA is the cancer therapeutic target to inhibit shedding. Biochem Biophys Res Commun. 2009;387:476–481. doi:10.1016/j.bbrc.2009.07.062.
- Xu G, Chance MR. Hydroxyl radical-mediated modification of proteins as probes for structural proteomics. Chem Rev. 2007;107:3514–3543. doi:10.1021/cr0682047.
- Ciferri C, Chandramouli S, Leitner A, Donnarumma D, Cianfrocco MA, Gerrein R, Friedrich K, Aggarwal Y, Palladino G, Aebersold R, et al. Antigenic characterization of the HCMV gH/gL/gO and pentamer cell entry complexes reveals binding sites for potently neutralizing human antibodies. PLoS Pathogens. 2015;11:e1005230. doi:10.1371/journal.ppat.1005230.
- Li P, Willie ST, Bauer S, Morris DL, Spies T, Strong RK. Crystal structure of the MHC class I homolog MIC-A, a gammadelta T cell ligand. Immunity. 1999;10:577–584.
- Li P, Morris DL, Willcox BE, Steinle A, Spies T, Strong RK. Complex structure of the activating immunoreceptor NKG2D and its MHC class I-like ligand MICA. Nat Immunol. 2001;2:443–451. doi:10.1038/87757.
- Gao X, Single RM, Karacki P, Marti D, O’Brien SJ, Carrington M. Diversity of MICA and linkage disequilibrium with HLA-B in two North American populations. Hum Immunol. 2006;67:152–158. doi:10.1016/j.humimm.2006.02.009.
- Petersdorf EW, Shuler KB, Longton GM, Spies T, Hansen JA. Population study of allelic diversity in the human MHC class I-related MIC-A gene. Immunogenetics. 1999;49:605–612.
- Petrova G, Ferrante A, Gorski J. Cross-reactivity of T cells and its role in the immune system. Crit Rev Immunol. 2012;32:349–372.
- Tian W, Cai JH, Wang F, Li LX. MICA polymorphism in a northern Chinese Han population: the identification of a new MICA allele, MICA*059. Hum Immunol. 2010;71:423–427. doi:10.1016/j.humimm.2010.01.025.
- Zhang Y, Han M, Vorhaben R, Giang C, Lavingia B, Stastny P. Study of MICA alleles in 201 African Americans by multiplexed single nucleotide extension (MSNE) typing. Hum Immunol. 2003;64:130–136.
- Kirijas M, Spiroski M. MICA polymorphism, association with diseases and the role of anti-MICA antibodies in organ and stem cell transplantation. Macedonian J Med Sci. 2013;6:285–295.
- Cho HS, Mason K, Ramyar KX, Stanley AM, Gabelli SB, Denney DW Jr., Leahy DJ. Structure of the extracellular region of HER2 alone and in complex with the Herceptin Fab. Nature. 2003;421:756–760. doi:10.1038/nature01392.
- Franklin MC, Carey KD, Vajdos FF, Leahy DJ, de Vos AM, Sliwkowski MX. Insights into ErbB signaling from the structure of the ErbB2-pertuzumab complex. Cancer Cell. 2004;5:317–328.
- Junttila TT, Akita RW, Parsons K, Fields C, Lewis Phillips GD, Friedman LS, Sampath D, Sliwkowski MX. Ligand-independent HER2/HER3/PI3K complex is disrupted by trastuzumab and is effectively inhibited by the PI3K inhibitor GDC-0941. Cancer Cell. 2009;15:429–440. doi:10.1016/j.ccr.2009.03.020.
- Lam PV, Goldman R, Karagiannis K, Narsule T, Simonyan V, Soika V, Mazumder R. Structure-based comparative analysis and prediction of N-linked glycosylation sites in evolutionarily distant eukaryotes. Genomics Proteomics Bioinformatics. 2013;11:96–104. doi:10.1016/j.gpb.2012.11.003.
- Kaiser BK, Yim D, Chow IT, Gonzalez S, Dai Z, Mann HH, Strong RK, Groh V, Spies T. Disulphide-isomerase-enabled shedding of tumour-associated NKG2D ligands. Nature. 2007;447:482–486. doi:10.1038/nature05768.
- Wu JD, Atteridge CL, Wang X, Seya T, Plymate SR. Obstructing shedding of the immunostimulatory MHC class I chain-related gene B prevents tumor formation. Clin Cancer Res. 2009;15:632–640. doi:10.1158/1078-0432.CCR-08-1305.
- Groh V, Wu J, Yee C, Spies T. Tumour-derived soluble MIC ligands impair expression of NKG2D and T-cell activation. Nature. 2002;419:734–738. doi:10.1038/nature01112.
- Brinkmann U, Kontermann RE. The making of bispecific antibodies. mAbs. 2017;9:182–212. doi:10.1080/19420862.2016.1268307.
- Spiess C, Zhai Q, Carter PJ. Alternative molecular formats and therapeutic applications for bispecific antibodies. Mol Immunol. 2015;67:95–106. doi:10.1016/j.molimm.2015.01.003.
- Eitner K, Koch U, Gaweda T, Marciniak J. Statistical distribution of amino acid sequences: a proof of Darwinian evolution. Bioinformatics. 2010;26:2933–2935. doi:10.1093/bioinformatics/btq571.
- Moelbert S, Emberly E, Tang C. Correlation between sequence hydrophobicity and surface-exposure pattern of database proteins. Protein Sci. 2004;13:752–762. doi:10.1110/ps.03431704.
- Shental-Bechor D, Levy Y. Effect of glycosylation on protein folding: a close look at thermodynamic stabilization. Proc Natl Acad Sci USA. 2008;105:8256–8261. doi:10.1073/pnas.0801340105.
- Sola RJ, Griebenow K. Effects of glycosylation on the stability of protein pharmaceuticals. J Pharm Sci. 2009;98:1223–1245. doi:10.1002/jps.21504.
- Li J, Stagg NJ, Johnston J, Harris MJ, Menzies SA, DiCara D, Clark V, Hristopoulos M, Cook R, Slaga D, et al. Membrane-proximal epitope facilitates efficient T cell synapse formation by anti-FcRH5/CD3 and is a requirement for myeloma cell killing. Cancer Cell. 2017;31:383–395. doi:10.1016/j.ccell.2017.02.001.
- Deng X, Storz U, Doranz BJ. Enhancing antibody patent protection using epitope mapping information. mAbs. 2018;10:204–209. doi:10.1080/19420862.2017.1402998.
- Eaton DL, Wood WI, Eaton D, Hass PE, Hollingshead P, Wion K, Mather J, Lawn RM, Vehar GA, Gorman C. Construction and characterization of an active factor VIII variant lacking the central one-third of the molecule. Biochemistry. 1986;25:8343–8347.
- Lombana TN, Dillon M, Bevers J 3rd, Spiess C. Optimizing antibody expression by using the naturally occurring framework diversity in a live bacterial antibody display system. Sci Rep. 2015;5:17488. doi:10.1038/srep17488.
- Wong AW, Baginski TK, Reilly DE. Enhancement of DNA uptake in FUT8-deleted CHO cells for transient production of afucosylated antibodies. Biotechnol Bioeng. 2010;106:751–763. doi:10.1002/bit.22749.
- Bos AB, Duque JN, Bhakta S, Farahi F, Chirdon LA, Junutula JR, Harms PD, Wong AW. Development of a semi-automated high throughput transient transfection system. J Biotechnol. 2014;180:10–16. doi:10.1016/j.jbiotec.2014.03.027.
- Bos AB, Luan P, Duque JN, Reilly D, Harms PD, Wong AW. Optimization and automation of an end-to-end high throughput microscale transient protein production process. Biotechnol Bioeng. 2015;112:1832–1842. doi:10.1002/bit.25601.
- Zhou Y, Liu P, Gan Y, Sandoval W, Katakam AK, Reichelt M, Rangell L, Reilly D. Enhancing full-length antibody production by signal peptide engineering. Microb Cell Fact. 2016;15:47. doi:10.1186/s12934-016-0445-3.
- Simmons LC, Reilly D, Klimowski L, Raju TS, Meng G, Sims P, Hong K, Shields RL, Damico LA, Rancatore P, et al. Expression of full-length immunoglobulins in Escherichia coli: rapid and efficient production of aglycosylated antibodies. J Immunol Methods. 2002;263:133–147.
- Spiess C, Merchant M, Huang A, Zheng Z, Yang NY, Peng J, Ellerman D, Shatz W, Reilly D, Yansura DG, et al. Bispecific antibodies with natural architecture produced by co-culture of bacteria expressing two distinct half-antibodies. Nat Biotechnol. 2013;31:753–758. doi:10.1038/nbt.2621.
- Spiess C, Bevers J 3rd, Jackman J, Chiang N, Nakamura G, Dillon M, Liu H, Molina P, Elliott JM, Shatz W, et al. Development of a human IgG4 bispecific antibody for dual targeting of interleukin-4 (IL-4) and interleukin-13 (IL-13) cytokines. J Biol Chem. 2013;288:26583–26593. doi:10.1074/jbc.M113.480483.
- Zhang Y, Rempel DL, Zhang H, Gross ML. An improved fast photochemical oxidation of proteins (FPOP) platform for protein therapeutics. J Am Soc Mass Spectrom. 2015;26:526–529. doi:10.1007/s13361-014-1055-0.
- Oppikofer M, Bai T, Gan Y, Haley B, Liu P, Sandoval W, Ciferri C, Cochran AG. Expansion of the ISWI chromatin remodeler family with new active complexes. EMBO Rep. 2017;18:1697–1706. doi:10.15252/embr.201744011.
- Otwinowski Z, Minor W. Processing of X-ray diffraction data collected in oscillation mode. Methods Enzymol. 1997;276:307–326.
- Adams PD, Afonine PV, Bunkoczi G, Chen VB, Davis IW, Echols N, Headd JJ, Hung LW, Kapral GJ, Grosse-Kunstleve RW, et al. PHENIX: a comprehensive python-based system for macromolecular structure solution. Acta Crystallogr D Biol Crystallogr. 2010;66:213–221. doi:10.1107/S0907444909052925.
- Emsley P, Lohkamp B, Scott WG, Cowtan K. Features and development of coot. Acta Crystallogr D Biol Crystallogr. 2010;66:486–501. doi:10.1107/S0907444910007493.
- Murshudov GN, Vagin AA, Dodson EJ. Refinement of macromolecular structures by the maximum-likelihood method. Acta Crystallogr D Biol Crystallogr. 1997;53:240–255. doi:10.1107/S0907444996012255.
- Winn MD, Ballard CC, Cowtan KD, Dodson EJ, Emsley P, Evans PR, Keegan RM, Krissinel EB, Leslie AG, McCoy A, et al. Overview of the CCP4 suite and current developments. Acta Crystallogr D Biol Crystallogr. 2011;67:235–242. doi:10.1107/S0907444910045749.