
 ?Mathematical formulae have been encoded as MathML and are displayed in this HTML version using MathJax in order to improve their display. Uncheck the box to turn MathJax off. This feature requires Javascript. Click on a formula to zoom.
ABSTRACT
Controlling acidic charge variants is critical for an industrial bioprocess due to the potential impact on therapeutic efficacy and safety. Achieving a consistent charge variant profile at manufacturing scale remains challenging and may require substantial resources to investigate effective control strategies. This is partially due to incomplete understanding of the underlying causes for charge variant formation during the cell culture process. To address this gap, we examined the effects of four process input factors (temperature, iron concentration, feed media age, and antioxidant (rosmarinic acid) concentration) on charge variant profile. These factors were found to affect the charge profile by modulating the cell culture oxidative state. Process conditions with higher acidic peaks corresponded to elevated supernatant peroxide concentration, intracellular reactive oxygen species (ROS) levels, or both. Changes in glycation level were the primary cause of the charge heterogeneity, and for the first time, supernatant peroxide was found to positively correlate with glycation levels. Based on these findings, a novel mathematical model was developed to demonstrate that the rate of acidic species formation was exponentially proportional to the concentrations of supernatant peroxide and protein product. This work provides critical insights into charge variant formation during the cell culture process and highlights the importance of modulating of cell culture oxidative stress for charge variant control.
Introduction
Biologics comprised three of the top five drugs in revenue in 2016Citation1 and have steadily increased as a share of overall drug approvals in the past 20 years.Citation2 Investment into biopharmaceuticals and manufacturing capacity continues to grow due to good profiles in both efficacy and safety, as well as high approval rates.Citation3,Citation4 Concurrently, the Food and Drug Administration has encouraged a quality-by-design approach, emphasizing consistent product quality attribute (PQA) profiles during manufacturing. Taken together, these developments emphasize the importance of focused efforts not only for increasing the product titer, but also for refining product quality.
Charge variants are modified protein species that are separated by charge-based methodsCitation5 and may result in different efficacy and pharmacokinetics outcomes.Citation6–Citation9 In particular, acidic species may affect the therapeutic efficacy: one study showed that deamidation of an IgG1 molecule reduced antigen binding by 14 fold in cynomolgus monkeys.Citation10 As such, acidic charge variants are often considered critical quality attributes,Citation11–Citation13 and strategies for modulating charge profiles are important aspects of the overall PQA control for the commercial manufacturing bioprocess (see referenceCitation14 for a recent review on managing charge variant profiles).
Controlling charge heterogeneity remains a major challenge for manufacturing of biological therapeutics. Reports have shown that acidic variant levels may change when the manufacturing process was scaled up or transferred to a different facility,Citation15 demonstrating the sensitivity of charge profiles to process changes. Currently, knowledge regarding the underlying mechanisms to these changes during cell culture remain limited because many process development groups rely heavily on design-of-experiment (DOE) studies to achieve the required product quality specifications.Citation16–Citation19 While these approaches are helpful in controlling the level of charged species, they often do not directly address the root causes of the charge heterogeneity.
There have been some reported strategies for reducing charge variants: modulating process pH, temperature, and light exposure;Citation15,Citation20,Citation21 adjusting the concentration of medium additives including trace metals (e.g., copper or iron)Citation18,Citation22–Citation27 or antioxidants;Citation25,Citation28 and controlling glucose concentration for glycation.Citation29 These control strategies modulated the charge profile typically by reducing the deamidation, glycation, or oxidation levels, based on information from in-house peptide mapping and literature reports.Citation7,Citation30–Citation32 However, a clear and direct link is still missing on how exactly these factors influence these modifications. These three reactions are all chemically oxidative reactions that result in the loss of one electron and formation of ammonia (deamidation) or water (oxidation and glycation). We believed that these modifications may be related to oxidative stress; thus, this study was conducted with the hypothesis that reactive oxygen species (ROS), intracellular or extracellular, catalyzed acidic charge variant formation.
Results
Higher level of acidic species is associated with increased oxidative stress
Previous unpublished results showed that feed media (FM) age was a significant factor in generating acidic charge variants. To further investigate this phenomenon, we used aged FM at 10 weeks shelf-life and evaluated the cell performance, titer, and cell performance. The aged FM substantially lowered viable cell density (), viability (), and titer () and increased acidic charge variants, as measured by imaged capillary isoelectric focusing (icIEF). Aged FM appeared to have also affected the metabolic profiles of glutamine, glutamate, lactate, and ammonia (Figure S1A-F). Mass spectrometry (MS) analyses were performed for the samples taken from culture day 12 to determine the modifications that contributed to the change in charge profiles. Glycation levels were evaluated by intact mass analysis of the whole molecule after enzymatic removal of N-linked oligosaccharides with PNGase digestion (Figure S5). Deamidation and oxidation levels were evaluated by tryptic peptide mapping with liquid chromatography (LC)/MS/MS detection. Higher glycation, deamidation, and oxidation levels were observed in the Aged FM condition compared to the Control, as shown in and Figure S5. Additionally, the Control employed a temperature shift (TS) on day 6 of the culture from 36.5ºC to 34ºC; removing the TS (no TS) increased both the acidic charge variants and the titer slightly (). Cell culture performance for the no TS condition also exhibited minor changes during the late stages of the culture process (day 10–12), including lower viability () and small differences in metabolic profiles (Figure S1A-F). Notably, glycation percentage, as measured by affinity chromatography, was found to correlate strongly with acidic variant levels (, RCitation2 = 0.8976) for day 12 samples, suggesting that glycation was a major contributor to the acidic species.
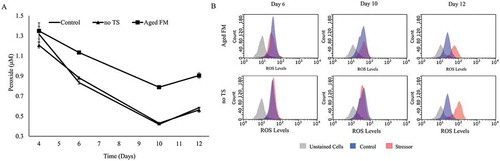
Figure 1. Impact of feed media age and temperature on cell culture performance and acidic peak content. Profiles were shown for (A) Cell growth and (B) viability. Acidic Peak Percent (on the left y-axis, measured by icIEF) and protein Titer (on the right y-axis, normalized to day 12 titer of the Control condition) were depicted, comparing (C) the effect of Aged Feed Media (FM) to the Control condition and (D) the effect of the no temperature shift (no TS) condition. (E) Peptide mapping of these conditions was conducted for the day 12 samples. (F) Day 12 glycation data, as measured by a boronate affinity column, showed good correlation with the day 12 Acidic Peak.
As deamidation, glycation, and oxidation are all oxidation-reduction chemical reactions, we hypothesized that the cellular oxidative state may play a critical role in the formation of acidic charge variants. Oxidative stress was characterized by measuring supernatant peroxide, intracellular ROS, catalase, and glutathione (GSH) (, ). The supernatant peroxide concentration () was higher for the Aged FM condition compared to the Control at all time points. The no TS condition exhibited no obvious differences in supernatant peroxide levels to the Control, but intracellular ROS levels () mirrored changes in the acidic peak, remaining similar on day 6 before deviating on days 10 and 12. Catalase levels () were not statistically different between the Control and the no TS conditions, whereas the Aged FM condition displayed reduced catalase levels on day 10. The GSH concentration was elevated for the Aged FM on day 6, yet was dramatically lower on day 10 compared to the Control. This suggested that cells might have regulated catalase or GSH activity in response to the oxidative stresses caused by the tested conditions ().
Table 1. Catalase and glutathione activity.
Figure 2. Oxidative state of cell culture caused by changes to feed media shelf-life and temperature. (A) Supernatant peroxide concentration was measured for the Control, the Aged Feed Media (FM), and the no temperature shift (no TS) conditions. (B) Flow cytometry data measuring intracellular reactive oxygen species (ROS) were shown for the Aged FM (red) and no TS conditions (red) against the Control condition (blue) on days 6, 10, and 12.
Addition of antioxidant and iron modulated oxidative stress and affected acidic species levels
The above results suggest the importance of controlling ROS for modulating acidic variants, leading to the next study to evaluate whether antioxidant addition may reduce acidic charge variants. Previously, we identified rosmarinic acid (RA) as a leading antioxidant for decreasing acidic charged species and increasing protein titer. Based on those results, 0.36 g/L RA was added to the Control, the no TS, and the Aged FM conditions. Conditions involving iron (80 µM, +Iron condition) and peroxide (+Peroxide condition) were also included to study their effects on charge variant formation. The peroxide level in the Aged FM conditions had increased to 460 μM after the weeks of storage (data not shown). Here, the fresh FM peroxide level was brought to this peroxide concentration (+Peroxide condition) to determine whether this could replicate the increase in acidic charged species observed with the Aged FM condition.
The addition of RA reduced the acidic variants percentage for all conditions tested (). Supplementing RA to the aged FM reduced acidic charge variants by 4.9% and substantially increased the titer by 29.1% (). The addition of iron to the Aged FM condition also reduced the acidic percentage and enhanced the titer. The combination of iron and RA (Aged FM +Iron +RA) performed similarly to the +RA condition in reducing acidic variants for the Aged FM condition (). Iron addition to the Control condition did not affect the acidic peak percentage noticeably whereas RA addition to the Control reduced acidic variants by 3–5% (data not shown). However, the combination of iron and RA reduced the acidic variants by 10% and had negligible effects on the titer compared with the Control process (). The addition of iron, RA, or both to the aged FM or the control condition also resulted in different cell culture growth and metabolic profiles (Figure S2-3).
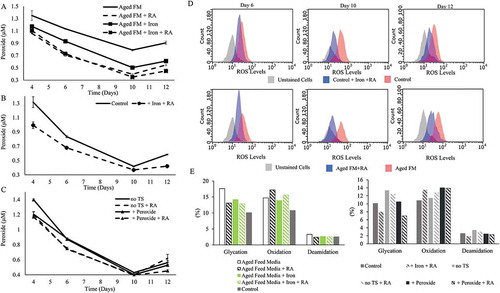
Figure 3. Rosmarinic acid and Iron reduced acidic peak percent. Acidic Peak (on the left y-axis) and Titer (on the right y-axis, normalized to day 12 titer of control sample) were depicted, comparing the effect of the following additives: (A) Iron, Rosmarinic Acid (RA), and + Iron + RA on Aged Feed Media (FM); (B) + Iron + RA on Control condition; (C) + RA on the no temperature shift (no TS) condition; (D) and + RA on the + Peroxide condition.
The acidic peak of the +Peroxide condition was not appreciably different to that of the Control ( and ). The supernatant peroxide concentration was much higher for the Aged FM condition compared to the +Peroxide condition ( and ) even though both FM conditions started with the same hydrogen peroxide concentration. Additions of iron, RA, or both to the Aged FM condition all lowered supernatant peroxide concentration (). For the Aged FM conditions, the supernatant peroxide concentration corresponded directly with acidic peak levels ( and ) and inversely with the protein titer ( and ). Addition of iron and RA to the Control condition reduced the supernatant peroxide levels throughout the culture duration (+Iron +RA; ). RA addition to the no TS and +Peroxide conditions () reduced the supernatant peroxide levels on day 6, but no obvious difference was observed on days 10 or 12. The addition of RA to the Aged FM condition or iron and RA to the Control condition reduced the intracellular ROS levels over the duration of the culture (). Peptide mapping () showed that iron or RA addition reduced glycation for all conditions and that the combination of iron and RA reduced glycation levels even further than either as a single addition, highlighting the significance of modulating oxidative stress for glycation reduction (). RA addition also slightly decreased deamidation levels and increased oxidation levels ().
Figure 4. Rosmarinic acid and Iron reduced cell culture oxidative stress. Supernatant peroxide concentration was measured for characterizing the effect of the following additives: (A) + Rosmarinic Acid (RA), + Iron, and + Iron + RA on Aged Feed Media (FM); (B) + Iron + RA on the Control; and (C) + RA on no temperature shift (TS) and + Peroxide conditions. (D) Flow cytometry data comparing the intracellular reactive oxygen species (ROS) levels for the Control with or without + Iron + RA and the Aged FM condition with or without RA on days 6, 10, and 12 of culture. (E) Peptide mapping of the tested conditions was conducted for the day 12 samples.
Other measures of oxidative state also showed the altered responses to different ROS levels. Catalase activity for the Aged FM condition was significantly lowered on day 10 compared to the Control, but was partially restored with the addition of iron, RA, or the combination (). Relative to the Control condition, all conditions with RA addition exhibited higher GSH levels on day 6, but lower levels on day 10 (). A similar trend for the GSH levels was observed when iron and RA were added to the Control condition (). Iron or RA addition to the aged FM brought the GSH levels closer to the Control condition by decreasing GSH levels on day 6 but increasing on day 10, relative to Aged FM condition without additions ().
Root cause analyses with advanced statistics and mathematical modelling
To identify the root causes for the acidic species, the previous results were compiled with measured cell culture performance across culture time points (- and Figure S1-3) and were evaluated using multi-variate analysis (MVA, see methods section). A partial least squares (PLS) model was built using the test conditions and measurements of cell culture performance (e.g., titer and viability) and oxidative state as the input variables and the acidic peak percent, glycation, deamidation, oxidation, or supernatant peroxide levels as the response variables (). - highlighted the process used to analyze the significant factors with glycation as the response factor. First, the PLS model identified two major principal components, t[1] and t[2], to explain the differences in glycation levels. In particular, t[1] exhibited good differentiation for glycation with lower glycation levels on the left (blue dots), intermediate levels in the center (green dots), and higher levels on the right (red dots) (). The factors within t[1] were further examined, and the weights representing the relationship between each of the factors at the specific time point and the response were calculated. The larger weights signified the greater impact of the factor toward the response. Supernatant peroxide concentration on days 5, 7, and 9–12 correlated strongly with increased glycation levels (). -D depicts the positive correlations of supernatant peroxide concentrations with the day 12 glycation () and levels of acidic species ().
Table 2. PLS analysis of the impact of input factors, cell viability, and oxidative state on acidic modifications.
Figure 5. Root cause analysis for charge variants formation. (A) Partial least square (PLS) model decomposed the collected data into two major principal components, t[1] and t[2] with day 12 Glycation as the response factor in this example. Blue signified low levels of glycation, green signified medium levels, and red signified high levels. (B) Significance (weight) of the supernatant peroxide concentration for affecting glycation was shown across different days in culture. Error bars denoted confidence intervals. (C) Supernatant peroxide concentrations were plotted against the changes in glycation levels on day 12. Blue denoted low levels of acidic peak, green denoted medium levels, and red denoted high levels. Green dotted lines signified the mean supernatant peroxide response, with the red dotted lines as the confidence intervals, set at 3 standard deviations from the mean. Data points are plotted based on day 12 glycation levels, the only time point with measured glycation values. (D) Supernatant peroxide concentrations were plotted against the acidic peak levels on days 6, 10, and 12. Blue denoted low levels of acidic peak, green denoted medium levels, and red denoted high levels. Green dotted lines signified the mean supernatant peroxide levels, with the red dotted lines as the confidence intervals, set at 3 standard deviations from the mean. While supernatant peroxide data was collected on days 4, 6, 10, and 12, charge variant data was only collected only days 6, 10, and 12. Thus, the “Missing” reflected the acidic variant percent data that was not collected on day 4. (E) Fit of the calculated rate of acidic increase (y-axis) based on experiment data against the model predicted rate of acidic increase (x-axis). The red line showed the orthogonal fit ratio, and the green ellipse encompassed the 95% confidence limits. (F) Proposed schematic for the mechanism that the studied factors affect the acidic species. The studied factors, temperature and feed media (FM), may lead to cellular oxidative stress, which in turn affects cell culture performance (growth, viability and titer) and increases the supernatant peroxide concentration. The supernatant peroxide then interacts with the protein product and produces the modifications (glycation, oxidation, and deamidation) that increase acidic charge variants. Cellular antioxidant defense response may reduce oxidative stress through altering intracellular levels of glutathione (GSH) or catalase. Cell culture media additives such as iron or antioxidant rosmarinic acid (RA) decrease acidic charge variants by reducing the intracellular oxidative stress and the supernatant peroxide concentration.
![Figure 5. Root cause analysis for charge variants formation. (A) Partial least square (PLS) model decomposed the collected data into two major principal components, t[1] and t[2] with day 12 Glycation as the response factor in this example. Blue signified low levels of glycation, green signified medium levels, and red signified high levels. (B) Significance (weight) of the supernatant peroxide concentration for affecting glycation was shown across different days in culture. Error bars denoted confidence intervals. (C) Supernatant peroxide concentrations were plotted against the changes in glycation levels on day 12. Blue denoted low levels of acidic peak, green denoted medium levels, and red denoted high levels. Green dotted lines signified the mean supernatant peroxide response, with the red dotted lines as the confidence intervals, set at 3 standard deviations from the mean. Data points are plotted based on day 12 glycation levels, the only time point with measured glycation values. (D) Supernatant peroxide concentrations were plotted against the acidic peak levels on days 6, 10, and 12. Blue denoted low levels of acidic peak, green denoted medium levels, and red denoted high levels. Green dotted lines signified the mean supernatant peroxide levels, with the red dotted lines as the confidence intervals, set at 3 standard deviations from the mean. While supernatant peroxide data was collected on days 4, 6, 10, and 12, charge variant data was only collected only days 6, 10, and 12. Thus, the “Missing” reflected the acidic variant percent data that was not collected on day 4. (E) Fit of the calculated rate of acidic increase (y-axis) based on experiment data against the model predicted rate of acidic increase (x-axis). The red line showed the orthogonal fit ratio, and the green ellipse encompassed the 95% confidence limits. (F) Proposed schematic for the mechanism that the studied factors affect the acidic species. The studied factors, temperature and feed media (FM), may lead to cellular oxidative stress, which in turn affects cell culture performance (growth, viability and titer) and increases the supernatant peroxide concentration. The supernatant peroxide then interacts with the protein product and produces the modifications (glycation, oxidation, and deamidation) that increase acidic charge variants. Cellular antioxidant defense response may reduce oxidative stress through altering intracellular levels of glutathione (GSH) or catalase. Cell culture media additives such as iron or antioxidant rosmarinic acid (RA) decrease acidic charge variants by reducing the intracellular oxidative stress and the supernatant peroxide concentration.](/cms/asset/0700c7d6-731d-4fe6-9ec8-ab74f9dbf7e0/kmab_a_1537533_f0005_oc.jpg)
This method identified the significant factors and their potential magnitude of impacts on the levels of glycation, oxidation, deamidation, or acidic species (). As expected, supernatant peroxide concentration and glycation percent were among the most significant factors that positively correlated to acidic species levels. In agreement with a literature report,Citation28 viability had an inverse relationship with the acidic peak ( and Figure S4). Similarly, temperature positively correlated with glycation levels and strongly correlated with deamidation levels. FM age strongly corresponded with increased acidic peak, glycation, and oxidation levels. Supernatant peroxide concentration strongly (weight> 0.1) influenced glycation and deamidation levels, but not oxidation levels. RA correlated strongly with reduced supernatant peroxide concentration and acidic species levels and increased oxidation. Iron was inversely correlated to supernatant peroxide concentration, glycation, and deamidation levels. In addition, catalase showed negative correlation with the acidic peak and the glycation levels, and GSH showed negative correlation with glycation and deamidation levels.
The strong correlation between the acidic peak and the glycation levels suggested that the reduction of acidic species in this study was primarily caused by changes in the glycation levels, which was tightly linked to the supernatant peroxide concentrations. Factors that affected the supernatant peroxide levels also modulated the glycation and the acidic species levels. Based on these findings, Equation 2 was proposed for modeling the charge variant formation; the 2-L bioreactor experiment data () were then employed to validate this model. The Aged FM (6 weeks shelf-life), the Control (FM with 3 weeks shelf-life), or the Control with the RA and iron addition were then tested in the 2-L bioreactor culture model, as these conditions produced the highest, medium, and the lowest acidic variants percentage in the shake flask study. The resulting model generated good agreement between the predicted and the actual results ( and , R2 = 0.773 either with Orthogonal Fit or Bivariate Normal Ellipse Fit with P = 0.95). Notably, the value of j, the exponent for supernatant peroxide concentration, was almost an order of magnitude higher than the value of k, the exponent for glucose concentration, suggesting that glucose concentration (1–8 g/L observed in the studies, Figures S1-) exerted much less impact on the increase in glycation levels compared to the supernatant peroxide. The exponent for protein concentration m presented similar value to the parameter j, showing that improved productivity and higher protein titer may possibly lead to increased acidic species if cellular oxidative stress for the improved condition is maintained at a similar level. The results align with literature reportCitation33 and our observations with multiple pipeline molecules that acidic species content increased by 15 ~ 20% when protein titers were improved by 100 ~ 200%.
Table 3. Parameter estimates from modelling.
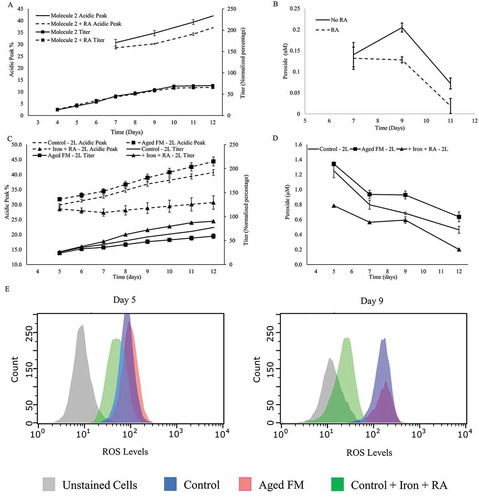
Figure 6. Evaluation of the impact of RA, Iron or aged FM on charge variants with a different clone or culture system. Acidic Peak (on the left y-axis) and Titer (on the right y-axis, normalized to day 12 titer of control sample) were depicted: (A) impact of rosmarinic acid (RA) to a clone expressing an IgG1 Molecule 2; and (B) supernatant peroxide levels of the cell line expressing Molecule 2 with or without RA. Validation of the results from the Control, Aged FM, and + Iron + RA conditions was conducted through a scale-up study in a 2-L fed-batch bioreactor system with the following characterization data: (C) Acidic Species (on the left y-axis) and the Titer (on the right y-axis); (D) supernatant peroxide; and (E) flow cytometry depicting the intracellular ROS.
Discussion
All of the factors that increased the acidic peak in this study correlated with increased supernatant hydrogen peroxide concentration or intracellular ROS activity. This increase in oxidative stress appeared to trigger changes in endogenous antioxidant activity, as shown by the altered catalase and GSH levels (), and was negatively correlated to the glycation levels. Similarly, catalase activity exhibited an inverse correlation to the acidic peak (), suggesting that decreasing cellular oxidative stress reduced the acidic peak formation. Nutrient deprivation was shown to increase metabolic stress and ROS production,Citation34 and may be one of the primary drivers of charge heterogeneity shown here. Additionally, industrial FM are generally highly concentrated, raising stability concerns for specific components.Citation33,Citation35,Citation36 Amino acid analysis showed that the cysteine, arginine, histidine, and lysine concentrations were reduced by 30 ~ 75% for the aged FM after 7 weeks’ storage (Table S1). On the other hand, the addition of hydrogen peroxide to fresh FM did not significantly change the concentration of these amino acids compared to the fresh FM (Table S1) nor dramatically affect the cell culture supernatant peroxide concentrations, the glycation, or the acidic peak levels (, and ). Collectively, this suggested that the increase in acidic variants for the Aged FM condition may have resulted from the increased cell culture supernatant peroxide levels () caused by nutrient starvation and not solely by the peroxide produced in the Aged FM due to extended storage. Indeed, the cell culture supernatant peroxide concentration was much higher for the Aged FM condition compared to the + Peroxide condition (0.79–1.13 μM for Aged FM vs 0.40–0.87 μM for +Peroxide on day 6 to 12 of culture; and ) even though both conditions had the same starting hydrogen peroxide concentration in the FM. Cells trigger antioxidant defense mechanisms by altering the intracellular levels of antioxidants, e.g., GSH or catalase, in the presence of oxidative stress. The GSH and catalase levels for the +Peroxide condition were comparable to the Control condition on culture day 6 and 10, but much higher than that of the Aged FM condition (). Cells in the +Peroxide condition may have cleared the peroxide in the FM through the increased levels of endogenous antioxidants, resulting in comparable supernatant peroxide levels to the Control condition. The Aged FM condition, however, may have experienced greater oxidative stress due to nutrient depletion, leading to higher peroxide levels in the cell culture supernatant. The supernatant peroxide then catalyzed the protein modifications that increased acidic species. Regardless of the exact mechanism, there is a clear and direct association between high levels of oxidative stress or supernatant peroxide and high levels of acidic species (Aged FM) and vice versa (e.g., +Peroxide condition, +RA conditions). Notably, the increased oxidative stress for the Aged FM condition also impaired cell growth () and productivity (), as reported elsewhere.Citation37
The dominant form of protein modification was glycation, which correlated strongly with the supernatant peroxide concentration (). Interestingly, glucose concentration had a minimal impact on glycation in this study as increased glucose concentration did not noticeably increase the acidic peak, as previous authors have shown.Citation29 All tested conditions had the same glucose action limits, and internal studies utilizing higher glucose levels (5–11 g/L vs 1–8 g/L in this study) showed negligible impact (~1%) to the acidic variants content (data not shown). Additionally, galactose and fructose levels in the cell culture supernatant were likely negligible compared to the glucose concentration, as neither galactose nor fructose was present in the media formulations. Thus, changes in the glycation were less likely to be caused by levels of glucose or other sugars, but rather by supernatant peroxide levels. The mathematical modelling also confirmed this observation and showed that the glycation levels correlated more strongly with the supernatant peroxide concentration than with the glucose concentration. Studies investigating nonglycemic glycationCitation38-Citation40 have reported a positive correlation between glycation and malondialdehyde (MDA). MDA is a reactive lipid peroxide species that may increase glycation by anchoring the glucose and the protein target.Citation41 Hydrogen peroxide may lead to the formation of MDA and subsequently catalyze glycation.Citation42 The results shown here are consistent with the literature findings.
Iron is a critical medium component due to its role in energy production via the respiratory chain.Citation43,Citation44 Higher iron concentration has been reported to dramatically improve cell culture performance for cell growth and productivity, especially when cells are adapted from serum- or hydrolysate-containing media to chemically defined media.Citation45–Citation47 A recent study showed that iron supplementation may also delay cell aging by functioning similarly to catalase to decompose ROS.Citation48 These reports indicate that iron may modulate oxidative stress and promote cellular functions, similar to results shown here where addition of iron to the Aged FM condition dramatically boosted productivity and reduced acidic species (). This was likely achieved by reduced oxidative stress as shown by the significantly lower supernatant peroxide levels in the presence of iron (). Iron addition to the Control condition with fresh FM did not noticeably affect the acidic peak percentage or the supernatant peroxide levels (data not shown), suggesting there was sufficient iron in the cell culture media and that additional iron may not further improve cellular functions when cells are not under severe stress. However, the combination of iron and RA added to the Control condition further reduced both the acidic charged species and the supernatant peroxide levels more than the addition of iron alone, showing a synergistic effect of the combination towards modulating oxidative stress and acidic species ( and ).
RA reduced the acidic species, primarily through the reduction of supernatant peroxide concentration, leading to the reduction in glycation. RA may directly scavenge ROSCitation49 or also potentially generate ROS species through the interaction with transition metals, such as iron or copper.Citation50,Citation51 In addition, RA supplementation may trigger global changes in gene expression and metabolism, specifically catalase activity, to reduce cell culture oxidative stress and improve cell culture performance (data not shown). Consistent with previous observations, catalase and GSH activity were elevated on days 6 when supplemented with RA (), suggesting that RA may alter cellular antioxidant metabolism to reduce supernatant peroxide levels. All conditions with RA showed slightly increased levels of protein oxidation (), which are primarily catalyzed by protein peroxides and not hydrogen peroxide.Citation52,Citation53 The assay kit used in this study only detected hydrogen peroxide and peroxynitrite in cell free systems;Citation54 the RA may have increased the concentration of certain protein peroxides through the interaction with transition metals, leading to slightly higher total protein oxidation levels. Nevertheless, the supernatant hydrogen peroxide levels appeared to decrease in the presence of RA, which was also inversely correlated with glycation levels and acidic variants content (–). This was especially notable for Aged FM, as Aged FM +RA showed similar amino acid composition as the Aged FM but still partially restored titer and acidic charge profile () via reduced supernatant peroxide concentration (), intracellular ROS (), and glycation levels ().
Findings from this study were tested across other systems. RA addition decreased the acidic species by 5% in a shake flask model with a Chinese hamster ovary (CHO) cell clone expressing a different IgG1 molecule (Molecule 2; ) and the supernatant peroxide levels (). Additionally, the Aged FM (6 week shelf-life), the Control (FM with 3 weeks shelf-life), or the Control with the RA and iron addition were carried out in a 2-L bioreactor culture, with the resulting acidic content trending similarly to that observed with the shake flask culture model (). Here, the Aged FM condition had the highest acidic levels and the +Iron +RA condition had the lowest (). The difference between the Control and the Aged FM was not as significant as that observed for the shake flask culture model (), possibly due to the difference in the FM age (6 weeks shelf-life for 2-L bioreactor culture vs. 10 weeks for the shake flask culture). Measured supernatant peroxide and intracellular ROS levels also trended similarly to that observed in the shake flask model ().
Combining all the results and analyses, highlights the proposed scheme by which the acidic modifications (glycation, deamidation, and oxidation) occur during production fed-batch culture. In brief, modulating the cell culture parameters such as culture temperature or cell culture media age may elevate cellular oxidative stress. Meanwhile, cells may trigger an antioxidant response that alleviates this stress by shifting the metabolism of GSH or the expression of catalase. Severe oxidative stress may overcome this cellular self-defense, impairing cell culture performance (e.g., growth profiles or protein titers) and producing excessive ROS, e.g., peroxides, that migrate into the cell culture supernatant. The supernatant peroxides then interact with the protein product and induce degradation modifications, specifically glycation or deamidation, resulting in formation of acidic charge variants. Antioxidant addition may reduce the supernatant peroxide by directly scavenging the supernatant peroxide and by reducing the intracellular oxidative stress that produces the supernatant peroxide. This study showed the importance of glycation in increasing acidic charged species. This is also the first reported case of glycation caused by glucose-independent factors in a bioreactor system. Additionally, the mathematical model developed here describes, for the first-time, a quantitative relationship between ROS and the change in glycation and acidic charge variants, and indicates future directions in modulating charged species by controlling oxidative stress during a fed-batch culture cycle. In summary, our study has, for the first time, established the link between supernatant peroxide concentrations to glycation levels in a bioprocess setting. Although this study was primarily performed on a single CHO cell line, preliminary studies on a separate CHO cell line showed similar trends in acidic peak and ROS reduction with the addition of RA (). This suggests that nonglycemic glycation, likely caused by oxidative stress, may be a common phenomenon that leads to increased acidic charge variants in mammalian bioprocessing.
Materials and methods
Cell culture
CHO cell lines expressing IgG1 monoclonal antibodies (mAbs) were cultured in shake flasks or 2-L bioreactors in fed-batch mode. These cell lines utilized the glutamine synthetase gene expression system and were fed with proprietary chemically defined basal media (BM) and FM. RA and ferrous sulfate-EDTA were used as supplements to the FM and BM, respectively. Cell viability was measured by Vi-Cell XR Cell Counters (Beckman Coulter). Cellular metabolites were measured by Cedex Bio HT Analyzers (Roche, Basel, Switzerland). Titer values were normalized to the manufacturing process titer.
Generating conditions for studying charge variants
Either 0.36 g/L RA or 80 µM ferrous sulfate was used for the study and was added to FM (fresh or aged) prior to use. In addition, aged FM was held at room temperature but protected from light for up to 10 weeks (7 weeks storage and 3 weeks for cell culture use).
Charge variant detection
Cell culture supernatant was filtered by 0.22 µm filters before Protein A chromatography, using the MabSelect Resin (GE Healthcare). The purified samples were then analyzed by icIEF with a fluorocarbon-coated capillary cartridge within the iCE3 Instrument with Alcott 720NV auto sampler (Protein Simple). Detection was achieved by whole column UV imaging (280 nm).
Glycation analysis
Glycation analysis by mass spectrometry
After Protein A purification, the samples were de-N-glycosylated by PNGase F and injected into a size-exclusion chromatography (SEC)/MS system for mass analysis. SEC separation was conducted using a Waters Aquity UPLC system with a BEH200 SEC column (1.7 μm, 4.6 × 150 mm) under isocratic conditions, at 200 μL/min and ambient temperature, with 5 mM ammonia formate and 0.5% acetic acid in 80% water/20% acetonitrile as the stationary phase. The SEC eluant was directed onto a Xevo-G2 XS quadrupole time-of-flight mass spectrometer (Waters Corporation) at 3.0 kV capillary voltage, with source and desolvation temperature at 150°C and 500°C, respectively. The instrument was scanned from m/z 500 to 4000 Da. Deconvolution of multiply-charged ions was performed using MaxEnt 1 program in the MassLynx software package (Waters Corporation). Relative quantification of the glycated mAb was based on the peak heights of the non-glycated and glycated species.
Glycation analysis by affinity chromatography
Affinity chromatography was used to quantify glycation level. The UV diode-array detector was set at 280 nm. A TSKgel boronate-5PW affinity column (7.5 mm x 75 mm, Tosoh Bioscience) was equilibrated with buffer A containing 100 mM HEPES, 70mM Tris, 200 mM NaCl, pH 8.6. The mAb samples were injected onto the column and eluted with buffer B (0.5 M sorbitol in buffer A) gradient over 5 min. The glycation level was determined by calculating the percentage of retained peak area versus total peak area.
Peptide mapping for deamidation and oxidation analysis
The Protein A purified samples were denatured by guanidine hydrochloride, reduced by dithiothreitol, alkylated by iodoacetamide and digested with trypsin. The tryptic digest was chromatographically separated using a Waters ACQUITY UPLC system (Milford, MA U.S.A.) before being analyzed by ThermoScientific Orbitrap Q-EXACTIVE™ PLUS mass spectrometer (Bremen, Germany). A Waters Acquity BEH C18 column (1.7 µm, 2.1 × 150 mm) was used for separation (at 45°C). A linear gradient of 1% to 80% mobile phase B over 105 mins was used to elute the peptides (mobile phase A: 0.1% formic acid in water; mobile phase B: 0.1% formic acid in acetonitrile) at a flow rate of 0.2 mL/min.
The Q Exactive Plus mass spectrometer was operating in data-dependent mode to switch between MS and MS/MS acquisition. Ions were generated using a sheath gas flow rate of 40, an auxiliary gas flow rate of 10, a spray voltage of 3 kV, a capillary temperature of 275°C, and an S-Lens RF level of 60. Resolution was set at 70,000 (AGC target 3eCitation6) and 17,500 (AGC target 1eCitation5) for survey scans and MS/MS events, respectively. The dynamic exclusion duration of 10 s was used with a single repeat count.
Relative quantitation of oxidation and deamidation levels was achieved by dividing the peak areas of modified peptides by the sum of native peptides and modified peptides in selected ion chromatograms.
Assessing the oxidative state
Cell culture medium was withdrawn and centrifuged to obtain the cell-free supernatant. The supernatant was then measured, without dilution, for peroxide concentration by the Amplex Red (Cat# A22188, Thermo Fisher) kit, according to the manufacturer’s instructions, using the SpectraMax M3 (Molecular Devices). For intracellular ROS measurements, cells were incubated at 36.5°C for 10 minutes with the CellRox dye (Cat# C10444, ThermoFisher) before analysis with the Guava easyCyte 8HT (EMD Millipore) flow cytometer. The cells were lysed before measurement with the catalase (Cat# A22180, Thermo Fisher) and glutathione (Cat# ab138881, Abcam) kits. Manufacturers for each of these kits provided sample dilution buffers, and samples were diluted 4000 fold for the catalase assay and 100 fold for the glutathione assay before measurement with the SpectraMax M3.
Statistical analysis
MVA was conducted using SIMCA (CAMO Software, Oslo, Norway) software to assess the significance of the studied factors. First, the three-way series data were unfolded to a two-way table where each column represented a parameter at a specific time point. A batch level model (BLM) was constructed with Principal Component Analysis (PCA) or PLS. Score plot and loading plot were used as MVA outputs. The weight was calculated which represents the magnitude of the contribution of a specific factor within the major component at each time point.
Mathematical modelling
Based on the observation that glycation was the primary cause of the acidic species content, glycation was modeled as functions of unmodified protein species, supernatant peroxide, and glucose concentrations, resulting in a reaction scheme (Equation 1) for acidic species formation and its subsequent rate equation (Equation 2).
Pu = protein species that were not acidic (main species plus the basic species); Gluc = glucose; Pa = acidic protein species; m, k, and j = stoichiometric reaction coefficients; t = culture time. Units used were μM for ROS, hour for t, and g/L for glucose, Pa, and Pu.
Between days 5 and 12, the acidic species percent, ROS, glucose concentrations, and protein titers were either measured or extrapolated, assuming a linear correlation with time between the two closest measured values. The values used for Equation 2 were calculated with Equations 3–6.
n = current time point; n-1 = previous time point; Y = protein titer; A = acidic species; V = culture volume; FV = feed volume; [Gluc]F = FM glucose concentration; Vgluc = volume of glucose stock (300 g/L)
Abbreviations
| BLM | = | batch level model |
| CHO | = | Chinese Hamster Ovary |
| DOE | = | design-of-experiment |
| FM | = | feed media |
| GSH | = | Glutathione |
| icIEF | = | imaged capillary isoelectric focusing |
| IgG | = | immunoglobulin G |
| LC | = | liquid chromatography |
| mAbs | = | monoclonal antibodies |
| MDA | = | malondialdehyde |
| MS | = | Mass Spectroscopy |
| MVA | = | multi-variate analysis |
| PCA | = | Principal Component Analysis |
| PDA | = | Process Development Analytics |
| PLS | = | partial least squares |
| PQA | = | product quality attribute |
| RA | = | rosmarinic acid |
| ROS | = | reactive oxygen species |
| SEC | = | size-exclusion chromatography |
| SIMCA | = | soft independent modeling of class analogy |
| TS | = | temperature shift |
Supplemental Material
Download Zip (4.2 MB)Acknowledgments
The authors would like to thank many Bristol-Myers Squibb (BMS) team members for their valuable assistance, specifically Mengxiao Lu and the Process Development Analytics (PDA) team for conducting the iCE analysis and Jennifer Sheng and Wenren Cheng for their assistance with the statistical analyses. All financial support was provided by BMS: J.T., Z.T., J.C., N.Z., Y.H., E.V., J.L., M.B., and Z.L. are employees of BMS, and S.C. was supported by BMS during the preparation of this publication. The authors have no conflicts of interest to declare.
Disclosure statement
No potential conflict of interest was reported by the authors.
Supplemental Material
Supplemental data for this article can be accessed on the publisher’s website.
Related Research Data
References
- Aitken M, Kleinrock M. Medicines use and spending in the U.S. A review of 2016 and outlook to 2021. Parsippany (NY): Quintiles IMS Institute; 2017.
- Mullard A. 2017. 2016 FDA drug approvals. Nat Rev Drug Discov. 16:73–76. doi:10.1038/nrd.2017.14.
- Gramer MJ. Product quality considerations for mammalian cell culture process development and manufacturing. In: Zhou W, Kantardjieff A, editors. Mammalian cell cultures for biologics manufacturing. Berlin: Springer; 2013. p. 123-166. doi:10.1007/10_2013_214.
- Kelley B. 2009. Industrialization of mAb production technology: the bioprocessing industry at a crossroads. MAbs. 1:443–452. doi:10.4161/mabs.1.5.9448.
- Du Y, Walsh A, Ehrick R, Xu W, May K, Liu H. 2012. Chromatographic analysis of the acidic and basic species of recombinant monoclonal antibodies. MAbs. 4:578–585. doi:10.4161/mabs.21328.
- Zhao -Y-Y, Wang N, Liu W-H, Tao W-J, Liu -L-L, Shen Z-D. 2016. Charge variants of an avastin biosimilar isolation, characterization, In Vitro properties and pharmacokinetics in rat. PLoS One. 11:e0151874. doi:10.1371/journal.pone.0151874.
- Khawli LA, Goswami S, Hutchinson R, Kwong ZW, Yang J, Wang X, Yao Z, Sreedhara A, Cano T, Tesar D, et al. Charge variants in IgG1: isolation, characterization, in vitro binding properties and pharmacokinetics in rats. MAbs. 2010;2:613–624. doi:10.4161/mabs.2.5.13089.
- Boswell CA, Tesar DB, Mukhyala K, Theil FP, Fielder PJ, Khawli LA. 2010. Effects of charge on antibody tissue distribution and pharmacokinetics. Bioconjug Chem. 21:2153–2163. doi:10.1021/bc100261d.
- Hintersteiner B, Lingg N, Janzek E, Mutschlechner O, Loibner H, Jungbauer A. 2016. Microheterogeneity of therapeutic monoclonal antibodies is governed by changes in the surface charge of the protein. Biotechnol J. 11:1617–1627. doi:10.1002/biot.201600409.
- Huang L, Lu J, Wroblewski VJ, Beals JM, Riggin RM. 2005. In vivo deamidation characterization of monoclonal antibody by LC/MS/MS. Anal Chem. 77:1432–1439. doi:10.1021/ac0494174.
- Alt N, Zhang TY, Motchnik P, Taticek R, Quarmby V, Schlothauer T, Beck H, Emrich T, Harris RJ. 2016. Determination of critical quality attributes for monoclonal antibodies using quality by design principles. Biologicals. 44:291–305. doi:10.1016/j.biologicals.2016.02.005.
- Liu H, Ponniah G, Zhang H-M, Nowak C, Neill A, Gonzalez-Lopez N, Patel R, Cheng G, Kita AZ, Andrien B. 2014. In vitro and in vivo modifications of recombinant and human IgG antibodies. MAbs. 6:1145–1154. doi:10.4161/mabs.29883.
- Haberger M, Bomans K, Diepold K, Hook M, Gassner J, Schlothauer T, Zwick A, Spick C, Kepert JF, Hienz B, et al. Assessment of chemical modifications of sites in the CDRs of recombinant antibodies. MAbs. 2014;6:327–339. doi:10.4161/mabs.27876.
- Chung S, Tian J, Tan Z, Chen J, Lee J, Borys M, Li ZJ. 2018. Industrial bioprocessing perspectives on managing therapeutic protein charge variant profiles. Biotechnol Bioeng. 115:1646–1665. doi:10.1002/bit.v115.7.
- Mallaney M, Wang SH, Sreedhara A. 2014. Effect of ambient light on monoclonal antibody product quality during small-scale mammalian cell culture process in clear glass bioreactors. Biotechnol Prog. 30:562–570. doi:10.1002/btpr.1920.
- Horvath B, Mun M, Laird MW. 2010. Characterization of a monoclonal antibody cell culture production process using a quality by design approach. Mol Biotechnol. 45:203–206. doi:10.1007/s12033-010-9267-4.
- Sf A-A, Yang L, Thompson P, Jiang C, Kandula S, Schilling B, Aa S. 2010. Defining process design space for monoclonal antibody cell culture. Biotechnol Bioeng. 106:894–905. doi:10.1002/bit.22659.
- Rouiller Y, Périlleux A, Vesin MN, Stettler M, Jordan M, Broly H. 2014. Modulation of mAb quality attributes using microliter scale fed-batch cultures. Biotechnol Prog. 30:571–583. doi:10.1002/btpr.1921.
- Brunner M, Fricke J, Kroll P, Herwig C. 2017. Investigation of the interactions of critical scale-up parameters (pH, pO2and pCO2) on CHO batch performance and critical quality attributes. Bioprocess Biosyst Eng. 40:251–263. doi:10.1007/s00449-016-1672-z.
- Xie P, Niu H, Chen X, Zhang X, Miao S, Deng X, Liu X, Tan WS, Zhou Y, Fan L. 2016. Elucidating the effects of pH shift on IgG1 monoclonal antibody acidic charge variant levels in Chinese hamster ovary cell cultures. Appl Microbiol Biotechnol. 100:10343–10353. doi:10.1007/s00253-016-7749-4.
- Yang WC, Minkler DF, Kshirsagar R, Ryll T, Huang YM. 2016. Concentrated fed-batch cell culture increases manufacturing capacity without additional volumetric capacity. J Biotechnol. 217:1–11. doi:10.1016/j.jbiotec.2015.10.009.
- Yuk IH, Russell S, Tang Y, Hsu WT, Mauger JB, Aulakh RPS, Luo J, Gawlitzek M, Joly JC. 2015. Effects of copper on CHO cells: cellular requirements and product quality considerations. Biotechnol Prog. 31:226–238. doi:10.1002/btpr.2139.
- Vijayasankaran N, Varma S, Yang Y, Mun M, Arevalo S, Gawlitzek M, Swartz T, Lim A, Li F, Zhang B, et al. Effect of cell culture medium components on color of formulated monoclonal antibody drug substance. Biotechnol Prog. 2013;29:1270–1277. doi:10.1002/btpr.1772.
- Trexler-Schmidt M, Sargis S, Chiu J, Sze-Khoo S, Mun M, Kao YH, Laird MW. 2010. Identification and prevention of antibody disulfide bond reduction during cell culture manufacturing. Biotechnol Bioeng. 106:452–461. doi:10.1002/bit.22659.
- Hazeltine LB, Knueven KM, Zhang Y, Lian Z, Olson DJ, Ouyang A. 2016. Chemically defined media modifications to lower tryptophan oxidation of biopharmaceuticals. Biotechnol Prog. 32:178–188. doi:10.1002/btpr.2196.
- Luo J, Zhang J, Ren D, Tsai WL, Li F, Amanullah A, Hudson T. 2012. Probing of C-terminal lysine variation in a recombinant monoclonal antibody production using Chinese hamster ovary cells with chemically defined media. Biotechnol Bioeng. 109:2306–2315. doi:10.1002/bit.24510.
- Chaderjian WB, Chin ET, Harris RJ, Etcheverry TM. 2008. Effect of copper sulfate on performance of a serum-free CHO cell culture process and the level of free thiol in the recombinant antibody expressed. Biotechnol Prog. 21:550–553. doi:10.1021/bp0497029.
- Hossler P, Wang M, Mcdermott S, Racicot C, Chemfe K, Zhang Y, Chumsae C, Manuilov A. 2015. Cell culture media supplementation of bioflavonoids for the targeted reduction of acidic species charge variants on recombinant therapeutic proteins. Biotechnol Prog. 31:1039–1052. doi:10.1002/btpr.2139.
- Yuk IH, Zhang B, Yang Y, Dutina G, Leach KD, Vijayasankaran N, Shen AY, Andersen DC, Snedecor BR, Joly JC. 2011. Controlling glycation of recombinant antibody in fed-batch cell cultures. Biotechnol Bioeng. 108:2600–2610. doi:10.1002/bit.v108.11.
- Ponniah G, Kita A, Nowak C, Neill A, Kori Y, Rajendran S, Liu H. 2015. Characterization of the acidic species of a monoclonal antibody using weak cation exchange chromatography and LC-MS. Anal Chem. 87:9084–9092. doi:10.1021/acs.analchem.5b02385.
- Miao S, Xie P, Zou M, Fan L, Liu X, Zhou Y, Zhao L, Ding D, Wang H, Ws T. 2017. Identification of multiple sources of the acidic charge variants in an IgG1 monoclonal antibody. Appl Microbiol Biotechnol. 101:5627–5638. doi:10.1007/s00253-017-8301-x.
- Ponniah G, Nowak C, Neill A, Liu H. 2017. Characterization of charge variants of a monoclonal antibody using weak anion exchange chromatography at subunit levels. Anal Biochem. 520:49–57. doi:10.1016/j.ab.2016.12.017.
- Zigler JS, Lepe-Zuniga JL, Vistica B, Gery I. 1985. Analysis of the cytotoxic effects of light-exposed hepes-containing culture medium. Vitr Cell Dev Biol. 21:282–287. doi:10.1007/BF02620943.
- Wellen KE, Thompson CB. 2010. Cellular metabolic stress: considering how cells respond to nutrient excess. Mol Cell. 40:323–332. doi:10.1016/j.molcel.2010.10.004.
- Hossler P, Mcdermott S, Racicot C, Fann JCH. 2013. Improvement of mammalian cell culture performance through surfactant enabled concentrated feed media. Biotechnol Prog. 29:1023–1033. doi:10.1002/btpr.1739.
- Mccoy RE, Costa NA, Morris AE. 2015. Factors that determine stability of highly concentrated chemically defined production media. Biotechnol Prog. 31:493–502. doi:10.1002/btpr.2139.
- Handlogten MW, Zhu M, Ahuja S. 2018. Intracellular response of CHO cells to oxidative stress and its influence on metabolism and antibody production. Biochem Eng J. 133:12–20. doi:10.1016/j.bej.2018.01.031.
- Sathiyapriya V, Selvaraj N, Nandeesha H, Bobby Z, Agrawal A, Pavithran P. 2007. Enhanced glycation of hemoglobin and plasma proteins is associated with increased lipid peroxide levels in non-diabetic hypertensive subjects. Arch Med Res. 38:822–826. doi:10.1016/j.arcmed.2007.05.008.
- Selvaraj N, Bobby Z, Sridhar MG. 2008. Oxidative stress: does it play a role in the genesis of early glycated proteins? Med Hypotheses. 70:265–268. doi:10.1016/j.mehy.2007.04.049.
- Selvaraj N, Bobby Z, Sathiyapriya V. 2006. Effect of lipid peroxides and antioxidants on glycation of hemoglobin: an in vitro study on human erythrocytes. Clin Chim Acta. 366:190–195. doi:10.1016/j.cca.2005.10.002.
- Lj P, Lu L, Xw X, Ry Z, Zhang Q, Js Z, Hu J, Zk Y, Fh D, Qj C, et al. Value of serum glycated albumin and high-sensitivity C-reactive protein levels in the prediction of presence of coronary artery disease in patients with type 2 diabetes. Cardiovasc Diabetol. 2006;5:1–7. doi:10.1186/1475-2840-5-1.
- Siddique YH, Ara G, Afzal M. 2012. Estimation of lipid peroxidation induced by hydrogen peroxide in cultured human lymphocytes. Dose-Response. 10:1–10. doi:10.2203/dose-response.10-002.Siddique.
- Bresgen N, Eckl PM. 2015. Oxidative stress and the homeodynamics of iron metabolism. Biomolecules. 5:808–847. doi:10.3390/biom5020808.
- Xu W, Barrientos T, Andrews NC. 2013. Iron and Copper in Mitochondrial Diseases. Cell Metab. 17:319–328. doi:10.1016/j.cmet.2013.02.004.
- Bai Y, Wu C, Zhao J, Liu Y-H, Ding W, Ling WLW. 2010. Role of iron and sodium citrate in animal protein-free CHO cell culture medium on cell growth and monoclonal antibody production. Biotechnol Prog. 27:209–219. doi:10.1002/btpr.513.
- Xu J, Rehmann MS, Xu X, Huang C, Tian J, Qian N-X, Li ZJ. Improving titer while maintaining quality of final formulated drug substance via optimization of CHO cell culture conditions in low-iron chemically defined media. In: mAbs. Taylor & Francis; 2018. doi:10.1080/19420862.2018.1433978.
- Xu J, Jin M, Song H, Huang C, Xu X, Tian J, Qian NX, Steger K, Lewen NS, Tao L, et al. Brown drug substance color investigation in cell culture manufacturing using chemically defined media: A case study. Process Biochem. 2014;49:130–139. doi:10.1016/j.procbio.2013.10.015.
- Zhang Y, Wang Z, Li X, Wang L, Yin M, Wang L, Chen N, Fan C, Song H. 2016. Dietary Iron oxide nanoparticles delay aging and ameliorate neurodegeneration in drosophila. Adv Mater. 28:1387–1393. doi:10.1002/adma.v28.7.
- Erkan N, Ayranci G, Ayranci E. 2008. Antioxidant activities of rosemary (Rosmarinus Officinalis L.) extract, blackseed (Nigella sativa L.) essential oil, carnosic acid, rosmarinic acid and sesamol. Food Chem. 110:76–82. doi:10.1016/j.foodchem.2008.01.058.
- Long LH, Hoi A, Halliwell B. 2010. Instability of, and generation of hydrogen peroxide by, phenolic compounds in cell culture media. Arch Biochem Biophys. 501:162–169. doi:10.1016/j.abb.2010.06.012.
- Kim H-S, Quon MJ, Kim J. 2014. New insights into the mechanisms of polyphenols beyond antioxidant properties; lessons from the green tea polyphenol, epigallocatechin 3-gallate. Redox Biol. 2:187–195. doi:10.1016/j.redox.2013.12.022.
- Davies MJ. 2016. Protein oxidation and peroxidation. Biochem J. 473:805–825. doi:10.1042/BJ20151227.
- Gebicki S, Gebicki JM. 1993. Formation of peroxides in amino-acids and proteins exposed to oxygen free-radicals. Biochem J. 289:743–749. doi:10.1042/bj2890743.
- Debski D, Smulik R, Zielonka J, Michałowski B, Jakubowska M, Debowska K, Adamus J, Marcinek A, Kalyanaraman B, Sikora A. 2016. Mechanism of oxidative conversion of Amplex® Red to resorufin: pulse radiolysis and enzymatic studies. Free Radic Biol Med. 95:323–332. doi:10.1016/j.freeradbiomed.2016.03.027.