
 ?Mathematical formulae have been encoded as MathML and are displayed in this HTML version using MathJax in order to improve their display. Uncheck the box to turn MathJax off. This feature requires Javascript. Click on a formula to zoom.
ABSTRACT
The increased interest in using monoclonal antibodies (mAbs) as a platform for biopharmaceuticals has led to the need for new analytical techniques that can precisely assess physicochemical properties of these large and very complex drugs for the purpose of correctly identifying quality attributes (QA). One QA, higher order structure (HOS), is unique to biopharmaceuticals and essential for establishing consistency in biopharmaceutical manufacturing, detecting process-related variations from manufacturing changes and establishing comparability between biologic products. To address this measurement challenge, two-dimensional nuclear magnetic resonance spectroscopy (2D-NMR) methods were introduced that allow for the precise atomic-level comparison of the HOS between two proteins, including mAbs. Here, an inter-laboratory comparison involving 26 industrial, government and academic laboratories worldwide was performed as a benchmark using the NISTmAb, from the National Institute of Standards and Technology (NIST), to facilitate the translation of the 2D-NMR method into routine use for biopharmaceutical product development. Two-dimensional 1H,15N and 1H,13C NMR spectra were acquired with harmonized experimental protocols on the unlabeled Fab domain and a uniformly enriched-15N, 20%-13C-enriched system suitability sample derived from the NISTmAb. Chemometric analyses from over 400 spectral maps acquired on 39 different NMR spectrometers ranging from 500 MHz to 900 MHz demonstrate spectral fingerprints that are fit-for-purpose for the assessment of HOS. The 2D-NMR method is shown to provide the measurement reliability needed to move the technique from an emerging technology to a harmonized, routine measurement that can be generally applied with great confidence to high precision assessments of the HOS of mAb-based biotherapeutics.
Introduction
Prescription drug revenue from biotechnology products accounted for approximately US$153 billion in 2017 for the top ten drug companies.Citation1 Of the top 10 biologic drugs in 2017, 6 were from the monoclonal antibody therapeutic class.Citation2 Indeed, mAb-based molecules are currently the dominant biotherapeutic platform, including over 50 that are in late-stage clinical studies.Citation3 The development and adoption of new technologies have been encouraged by regulatory agencies,Citation4 and have become indispensable for the characterization of the quality attributes (QA) that may affect the safety and efficacy of these large and complex drugs. One attribute that is unique to biologics, including mAbs, is known as higher order structure (HOS), which is composed of the secondary, tertiary, and quaternary structure.Citation5 The HOS of a protein is a QA that is directly linked to the function of the molecule, and is therefore a key determinant in assessing structural similarity between different manufactured drug lots and between a biosimilar and an originator molecule in biosimilarity evaluations. The measurement of the HOS of a protein therapeutic represents a substantial analytical challenge. Unlike small molecule drugs that are chemically derived and for which structure can be determined absolutely, the HOS of protein therapeutics precludes absolute characterization due to the large molecular weight, protein dynamics, and product heterogeneity arising from subtle differences in the manufacturing process.Citation5–Citation8
To date, the evaluation of HOS for protein therapeutic quality control purposes in the pharmaceutical industry has generally been carried out using methods with low-to-moderate structural resolution such as circular dichroism (CD), Raman, or Fourier transform infrared (FT-IR) spectroscopies, as well as indirect techniques that measure structure as it relates to thermal stability or biological function.Citation9 Recently, the application of two-dimensional (2D) heteronuclear 1H,15N- or 1H,13C-correlated NMR spectra to characterize the HOS of protein therapeutics has garnered great interest in the biopharmaceutical community because a single 2D-NMR experiment can yield a spectral map that offers a comprehensive, atomic-level fingerprint of the primary, secondary, tertiary and quaternary structure(s) of a protein therapeutic.Citation8,Citation10–Citation12 Indeed, a correctly folded protein molecule typically affords a defined pattern of cross-peaks resulting from individual 1H,15N amide or 1H,13C methyl resonance correlations, referred to as the “2D spectral fingerprint.” These signals are observed at specific frequency positions that relate to the unique chemical and structural environments of those individual atoms in the three-dimensional protein structure,Citation13,Citation14 assuming experimental sample conditions, such as temperature, pH, and ionic strength, are properly controlled. Deviations in the sample conditions of a protein may affect the electronic environment of the nuclei, and therefore may perturb the chemical shift positions. Such effects can be utilized with great benefit to judge the spectral response for any given sample, and to extract detailed protein structural information, such as the mapping of several perturbed signals to loop regions from a temperature deviationCitation15 or the elucidation of excipient interactions to specific residues with the target protein.Citation16,Citation17 However, for the purpose of structural assessment of therapeutic proteins by NMR under controlled sample conditions, the precise matching of two 2D-NMR spectral fingerprints of a protein from two products provides a high level of assurance that the predominant structure(s) of the proteins is highly similar between those two product samples. Such a determination of “high similarity” could aid in the designation of analytical similarity between the two products in combination with other relevant QAs.Citation18
Originally applied to relatively small recombinant protein therapeutics (< 25 kDa) at natural isotopic abundance,Citation10 the capability of the 2D-NMR approach to provide high resolution HOS data has more recently been demonstrated for the mAb therapeutic class (~ 150 kDa).Citation11,Citation19–Citation21 For example, as applied to mAbs, measurement of a 1H,13C methyl fingerprint was found to afford advantages over the 1H,15N amide-based NMR fingerprint, owing to the greater natural abundance of 13C relative to 15N (1.1% versus 0.37%) and the more advantageous relaxation behavior of the freely rotating methyl moieties compared to amide groups.Citation19 Indeed, acquisition of 1H,13C NMR spectra on an intact mAb using an ultra-high field NMR spectrometer was shown to be practical. In these studies, the intact mAb was also cleaved with papain into component parts, and the 2D-NMR method was applied to the resulting antigen-binding fragment (Fab) and the crystallizable fragment (Fc), confirming that higher order structural information of the fragments was retained when compared to the intact mAb molecule.
Here, we report a comprehensive inter-laboratory study that establishes benchmarks for the adoption of the 2D-NMR methods for robust precision measurement of mAb HOS. The study, conducted by 26 laboratories with roughly equal representation from industry, academia and government, recorded a total of 451 2D-NMR spectra using the unlabeled NIST-Fab, derived from the NISTmAb Primary Sample (PS) #8670, and a uniformly enriched (U)-15N, 20% enriched-13C NIST-Fab expressed in P. pastoris that served as the system suitability sample (SSS). The NISTmAb is a publicly available reference material intended for evaluating analytical techniques applied to mAb therapeutics,Citation22–Citation24 and the Fab domain from the NISTmAb was chosen as the target of this study to ensure that the measurements would be amenable to the moderate field NMR spectrometers employed by some laboratories in this report (e.g., 500 MHz to 700 MHz). Using weighted peak lists from both 1H,15N amide, and 1H,13C methyl spectra, chemometric methods demonstrate that reliable spectral fingerprints can be generated using NMR spectrometers with magnetic fields ranging from 500 MHz to 900 MHz, of different vintages of vendor instrumentation and equipped with conventional or high sensitivity NMR probes. The results provide confidence that the 2D-NMR method is reliable for routine application in biopharmaceutical development and suitable for regulatory purposes.
Results
Visual inspection of 2D 1H,15N and 1H,13C spectral fingerprints
The NIST-Fab, derived from papain digestion of the NISTmAb PS #8670, was chosen as the test material for this study, since this domain should be a representative of the IgG1κ mAb therapeutic class. While the HOS of intact mAbs can be characterized using 2D-NMR at natural isotopic abundance,Citation25 previous work has also established that the 2D-NMR spectral map of an Fc or Fab retains much of the HOS information relevant to the intact mAb.Citation19 This work showed that all but a few methyl resonances were unchanged in the fragments relative to the intact mAb. Since there are several methyl-bearing residues around the hinge region, the small number of chemical shift perturbations from papain cleavage points to a local change in the electronic environment and supports the conclusion that the overall global structure of the fragments is maintained. Taken together with the fact that an isotopically enriched SSS of the NIST-Fab could be generated using a P. pastoris expression system, the NIST-Fab provided a good model system for benchmarking the 2D-NMR method for application to mAbs. Both the SSS and the NIST-Fab were distributed to all laboratories from the same sample batches. Various 2D-NMR methods, summarized in , were then applied to both samples. Each method type was given an experimental code (e.g., D1A, E1B, etc.). All partnering laboratories were asked to perform the D-type experiments and additionally had the option of collecting spectra with different parameters or pulse sequences (E-type experiments). Data from each institution were anonymized by a third party (see Materials and Methods), and each laboratory was assigned a 4-digit institutional identifier followed by a 3-digit experiment number, yielding a complete experimental code of 10 characters (e.g., D2A-1247–001). The total breakdown of collected spectra per institution and experimental type is given in Table S1.
Table 1. Summary of required and optional 2D-NMR experiments. See Tables S5 – S9 for detailed experimental parameters.
The SSS used in the study was uniformly enriched in 15N and 20%-enriched in 13C (U-15N, 20%-13C NIST-Fab). The signal peptide on the SSS was not fully cleaved during expression, affording a molecule with eight extra amino acids, four each on the N-termini of the light and heavy chains, relative to the NIST-Fab. This sequence difference was fortuitous, however, as the SSS and the NIST-Fab provided a sample set of two structurally similar but not identical molecules that could be used to test the performance of different chemometric methods. From a visual inspection of the NIST-Fab and SSS 2D 1H,15N amide and 1H,13C methyl spectra, these 2D spectral fingerprints suggest that the molecules are structurally similar, with almost all cross peaks overlapping due to the high sequence and structural identity between the two molecules ( and ). A few shifted cross peaks were observed, as would be expected due to the structural differences arising from the extended amino acid sequence at the N-termini of both the heavy and light chains of the SSS relative to the NIST-Fab.
Figure 1. Representative 500 MHz and 900 MHz 1H, 15N spectral fingerprints of the SSS and the NIST-Fab. (a) 1H, 15N gHSQC D1A-3897-009 spectrum of the SSS recorded with uniform sampling at 500 MHz; (b) 1H,15N SOFAST-HMQC E2C-8822-030 spectrum of the NIST-Fab using 50% NUS at 900 MHz; (c) 1H,15N gHSQC E2N-8822-071 spectrum of the SSS using 50% NUS at 900 MHz; (d) Spectral overlay of the NIST-Fab, in red, of E2C-8822-030 with the SSS, in black, of E2N-8822-071 at 900 MHz. A 1H,15N spectral fingerprint was not measured for the NIST-Fab at 500 MHz because the 1H,15N gHSQC was too insensitive to measure the spectral map for the NIST-Fab at 15N natural isotopic abundance. All representative spectra were collected at 37 °C and are plotted just above the noise threshold. The extra peaks at 500 MHz between δH 11 ppm – 12 ppm are field dependent resonances whose intensity slowly decreases due to dynamics on the NMR time scale as the magnetic field increases from 500 MHz to 900 MHz; the frequencies of these field dependent resonances are the same regardless of the magnetic field. In spectrum E2C-8822-030, the observed vertical artifacts around 7 ppm arose from high amplitude noise that is intrinsic to the SOFAST-HMQC experiment. For a summary of experimental codes, see .
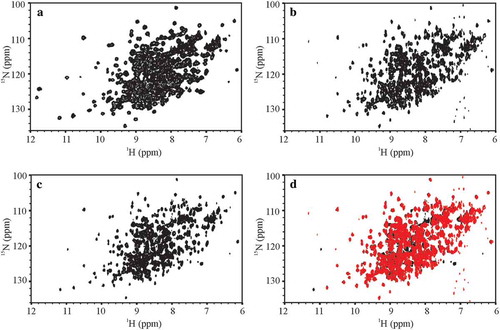
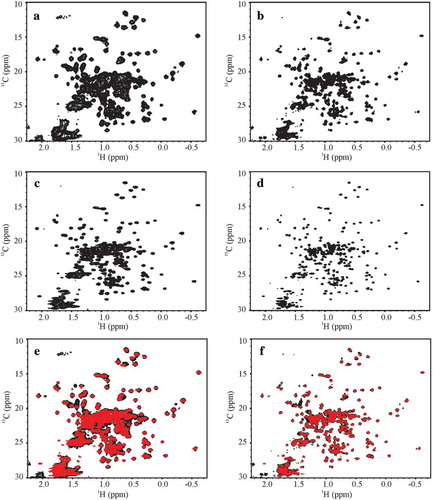
Figure 2. Representative Citation1H, Citation13C gHSQC spectral fingerprints of the SSS and the NIST-Fab. (a) D2C-3897–012 spectrum of SSS at 500 MHz and (b) D2C-7425–012 spectrum of SSS at 900 MHz; (c) D3A-3897–015 spectrum of the NIST-Fab at 500 MHz and (d) D3A-7425–015 spectrum of the NIST-Fab at 900 MHz; and overlay of SSS, in black, and the NIST-Fab, in red, at (e) 500 MHz and (f) 900 MHz. All representative spectra were collected at 37 °C. For a summary of experimental codes, see .
The ‘gold standard’ for the evaluation of a protein’s folded state by NMR is the 2D 1H,15N NMR spectral map that provides a single-bond correlation for every NMR-observable non-proline backbone amide and a number of amino acid side chains (e.g., asparagine, arginine, and glutamine) (). For the SSS, these spectra were acquired with moderate (500 MHz) to very high (900 MHz) quality, spectral resolution and sensitivity, allowing this study to be benchmarked against previous work.Citation15 However, the collection of the 1H,15N spectral map at natural isotopic abundance for the unlabeled NIST-Fab at lower fields (500 MHz – 700 MHz) was considered impractical for the benchmarking exercise due to insufficient sensitivity of these experiments at the lower magnetic fields, and was therefore not attempted. At 900 MHz, a high quality spectrum was recorded to allow visual comparison of this standard spectral map between the NIST-Fab and SSS (, c and d). This experiment required a total acquisition time of 69 h, even with the use of acquisition techniques designed to shorten overall experimental times, i.e., selective optimized flip angle short transient (SOFAST) pulsingCitation26 and 50% non-uniform sampling (NUS).Citation27 As a result of the limitations in acquiring 1H,15N spectral data for the NIST-Fab, the peak list for assessing inter-laboratory variability was generated using only spectra collected on the SSS at 37 °C (Figure S1). The lowest resolution spectrum, generated at 500 MHz, was used as the reference to generate the limiting peak list, which gave 34% of the total expected peaks due to the high degree of spectral overlap. This reference peak list was then copied to all other 1H,15N spectra recorded at 37 °C.
In contrast to the 1H,15N 2D-NMR spectra, the Citation1H, 13C spectral map of the methyl region provided at least a 10-fold faster approach for 2D-NMR spectral comparison of the HOS of the SSS and the NIST-Fab due the higher natural abundance of 13C compared to 15N and intrinsically more favorable relaxation of methyl groups due to free rotation of the methyl protons about the carbon-carbon bond axis (). Indeed, high quality spectra for the NIST-Fab could be measured at the lowest field used in this study (i.e., 500 MHz) in as little as 7 h with the application of 50% NUS. Using the lowest resolution spectra, which were recorded at 500 MHz as the threshold spectra for peak picking for the full spectral dataset, a peak list with approximately 41% of the expected cross peaks could be defined due to the high degree of spectral overlap (Figures S2 and S3). This peak list was subsequently overlaid on all other 1H,13C spectra acquired in the study to allow further in-depth comparative analysis of the spectra.
Combined chemical shift deviation as a metric for spectral comparability and determination of inter-laboratory precision
Combined chemical shift deviation (CCSD)Citation28 was used to demonstrate the high precision of the 2D-NMR measurement for spectra recorded at 37 °C. A previous study reported a precision of better than 8 ppb for 1H,15N CCSD for filgrastim samples.Citation15 From the CCSD analysis of 41 uniformly sampled 1H,15N spectral maps in the current study recorded for the SSS at 37 °C, a very high precision (3.3 ± 1.8 ppb) was determined (). Since this use of CCSD evaluates the precision of the mean deviation of a given chemical shift, the 95% confidence intervals are reported as standard error of the mean (SEM).
Figure 3. Average Combined Chemical Shift Deviation (CCSD) precision plots of required experiments at 37 °C. (a) CCSD of 1H,15N D1A/E2, E2B, and E2C spectra; (b) CCSD of D2A/D2C and D2B/D2D/D2E 1H,13C spectra. All 1H,15N spectra and 1H,13C D2A/D2C spectra were acquired with uniform sampling, while 1H,13C D2B/D2D/D2E spectra were 50% non-uniformly sampled. The number above each bar represents the total number of spectra included in the analysis for each respective experimental type. For 1H,15N CCSD plot, E2 experiments were included since the only parameter change from D1A was a smaller 15N spectral width. Errors bars represent 95% confidence intervals of SEM. For detailed breakdown of experimental codes, see Table S10.
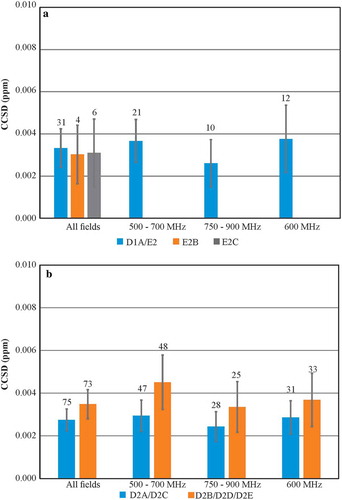
The availability of the much larger set of 1H,13C spectra collected in this study further allowed for a greater in-depth CCSD precision analysis than available from the previous work.Citation15 As expected, the precision was slightly higher for this data relative to the 1H,15N spectra, with an average CCSD of 2.8 ± 0.5 ppb, for the benchmark D2A and D2C 1H,13C spectra ( and Figure S4). Indeed, the precision remained high, and the 95% confidence intervals were tight for all variations of data acquisition. The higher S/N ratio also afforded slightly greater precision for D2E class experiments (2.3 ± 0.8 ppb), which were recorded with double the number of scans per 13C increment compared to all other D2-type spectra (). Only spectra acquired with custom NUS schedules and the SOFAST-HMQC (heteronuclear multiple quantum coherence) pulse sequence had slightly less precision of 5.3 ± 2.7 ppb and 5.3 ± 2.8 ppb, respectively. Overall, the exquisite reproducibility of frequency positions of the spectral cross peaks observed in the 2D-NMR experiments is quantitatively demonstrated by these average CCSD values.
Principal component analysis of 1H,13C spectra
Principal component analysis (PCA) of 1H,13C weighted peak lists from all spectra afforded distinct groups that could be manually clustered according to sample type and reported temperature of the sample during spectral acquisition (). The PCA confirms that the spectral map is highly reproducible regardless of the acquisition method used across the 26 laboratories, with the few outliers readily explained by experimental set-up, including choice of NUS schedule (Figures S5 and S6) and sample temperature deviation (Figures S7 and S8, Table S2). When PCA was re-applied to only spectra measured at 37 °C, for which the largest sample size is available (n = 307, Figure S9), then the known systematic pulse program error in the acquisition of a subset of spectra from older hardware became apparent (Figure S10). However, as illustrated by the analyses of the few outliers, proper experimental set-up and proper sample controls (e.g., temperature, pH, ionic strength, and concentration) are crucial for optimal spectral reproducibility.
Figure 4. Clustered PCA scatter plots of all peak lists from 354 1H,13C spectra. (a) Manually clustered plot according to reported sample-type and temperature. The centroid of each manual cluster was then determined. (b) Clustering output for k = 8 for both the Unweighted Pair Group Method with Arithmetic Mean (UPGMA) and mix-max group pair algorithms. The inner and outer ellipses represent 95% and 99% confidence regions, respectively, based upon chi-square probabilities. In panel b, both algorithms afforded the same spectral clusters, so only one plot is shown. See Figures S12 and S13 for different data clustering (k = 7 and 9) for the mix-max group pair and UPGMA algorithms, including a discussion of the chemometric classification of the outliers. For additional details on the outliers, see the main text and Figures S5 – S10.
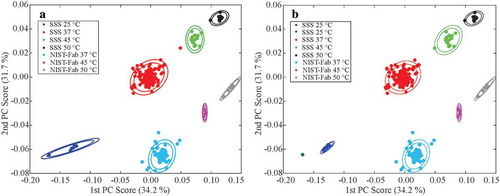
Several chemometric clustering algorithms were also applied to the PCA plot of peak tables for all 1H,13C spectra, including k-means (analysis not shown), k-medoids (Figure S11), min-max group pair algorithm (Figure S12), and unweighted pair group method with arithmetic mean (UPGMA, and Figure S13). The k-means and k-medoids algorithms performed particularly poorly; this was likely due, in part, to the fewer number of spectra collected at different temperatures (see , experimental type: E1B). The min-max group pair clustering method performed better, although this approach classified the SSS 45 °C and SSS 50 °C spectra as one group when seven clusters were specified (Figure S12). However, both the min-max group pair and the UPGMA algorithms correctly identified clusters when eight clusters were specified, including the assignment of the temperature outlier D2E-8822–065 to the 45 °C SSS cluster (, S7 and S8).
Discussion
HOS assessment is critical in determining the comparability of the drug substance over the course of manufacturing changes that may occur through the lifecycle of a protein therapeutic.Citation29 This assessment is also a key piece of information in biosimilarity evaluations that use comparative analysis of the physico-chemical properties of a biosimilar to its reference product. Assurances that the primary, secondary, and higher order structures of two proteins are highly similar is generally considered to be a strong indication of similar function. Therefore, the ability to precisely and accurately compare structural attributes of two proteins (e.g., a biosimilar and its reference product) with the atomic resolution afforded by NMR can provide key information on the degree of structural similarity, thereby contributing to the totality of the evidence and supporting a more targeted and selected approach to clinical studies for the confirmation of the safety and efficacy of the proposed biosimilar.Citation4,Citation18,Citation30
Of all the HOS techniques, 2D-NMR is the only analytical method that can simultaneously yield precise and accurate information about the primary, secondary, tertiary, and quaternary (i.e., HOS) structure of a biopharmaceutical in solution with atomic level resolution. Analysis of NMR spectral peak positions has many beneficial attributes for assessing HOS. Even in the absence of sequence specific resonance assignments, each cross peak represents a reporter of the local structural environment at atomic resolution that is exquisitely sensitive to its magnetic (e.g., chemical and structural) environment. Since the chemical shift is a fundamental property of each NMR-active nucleus in a molecule, the position (in ppm) relative to a standard reference compound is a truly robust HOS parameter, since it can be measured with high accuracy and precision regardless of spectrometer magnetic field, choice of pulse sequence, or acquisition sampling strategy, provided that experimental sample conditions (e.g., temperature, ionic strength, concentration, and pH) are properly controlled. Indeed, any degradation or post-translation modifications will lead to spectral shifts that could be directly attributable to a perturbation in HOS. The extent to which a change in HOS results in chemical shift perturbations in the spectral fingerprint of a biopharmaceutical will depend on the nature of the structural change and will likely be product specific. In one example, 2D-NMR has been shown to detect even the most subtle effects on HOS resulting from engineered NISTmAb glycoform populations via PCA.Citation25 To aid in the identification of HOS perturbations, further cross peak parameters (e.g., peak volumes or line widths) could additionally be included to parse the structural and dynamic properties of the molecule of interest. Indeed, the inclusion of line widths, which are roughly proportional to molecular weight, could allow the detection of soluble aggregates and the concomitant loss of a monomer population, which is an important metric that could adversely affect the pharmacological activity of a therapeutic.
In terms of data sampling, the generation of a NUS schedule with a well-established algorithm such as Poisson-gapCitation31 assures comparable high chemical shift precision to uniform sampling. In fact, most apparent outliers in the PCA plots (, Figures S5 and S9), with the exception of E1A-5479–103 that was collected with an alternative NUS schedule (Figure S6), still had very precise peak positions as shown by CCSD, highlighting the reproducibility of the 2D-NMR method to define the spectral fingerprint. Moreover, this benchmarking study confirmed that this approach provides quality spectral discrimination of Fab domains even at 500 MHz, the lowest field represented in this study. Further, the chemometric approach using PCA with peak tables provides a means to appropriately and sufficiently cluster mAb product samples by HOS with only approximately 41% of the expected methyl cross peaks from the common peak list of the SSS and the NIST-Fab (see Results section). Nonetheless, for the highest stringency for comparability purposes, the use of the highest available magnetic field is recommended. In fact, using an arbitrary peak list developed only for the NIST-Fab from D3A spectra at 37 °C, up to 91% spectral coverage can be achieved using an ultra-high field magnet, affording even greater assurance that any potentially important spectral changes will be observable (Table S3).
Overall, this multi-national inter-laboratory comparison from industry, academia, and government has established a community standard for the measurement of the HOS QA by the 2D-NMR method at atomic resolution. Since the NIST-Fab is representative of the IgG1 therapeutic class, the dominant mAb platform, we fully expect the conclusions of this study to apply to all other members in this important class, and a recent report applying the 2D-NMR method to six therapeutic mAb-based products suggests that this is indeed the case.Citation21 This benchmarking exercise therefore provides confidence for the industrial and regulatory agencies that 2D-NMR HOS characterization is a practical method that can be performed both with high repeatability and reproducibility on large protein drugs. The results of the study further demonstrate the rigorous capability of the 2D-NMR method, when combined with chemometric analysis tools, to determine whether the HOS of comparators (e.g., multiple lot numbers, different formulations,Citation16,Citation17 or a biosimilar to a reference product) is highly similar. Indeed, we propose that the generated data may serve as a reference database for mAb NMR studies in development, quality control, and post-licensure supervision of the products. Since the NISTmAb has been developed by NIST into a reference material (RM #8671), any laboratory may obtain this molecule, follow the standardized protocol described in this report to record 2D-NMR spectra, and assure system suitability in similarity studies on other prospective products. In addition, based on the method robustness, accuracy, and precision observed in this large study, the potential exists that individual mAb manufacturers may measure the NMR fingerprint on an original clinically tested safe and efficacious product, store these data in a reference library and compare data from future batches by chemometric approaches to the original across the therapeutic lifecycle of the drug. Such high information content comparisons of key attributes like HOS increase the confidence in the drug’s quality across manufacturing changes or manufacturing sites. As such, the study moves the 2D-NMR method from an emerging technology to a harmonized, routine measurement that can be generally applied with great confidence to high precision assessments of the HOS of a wide-array of protein therapeutics.
Material and methods
Study design
The overall design was to benchmark and to harmonize the 2D-NMR spectral method for the assessment of HOS of large protein biologics and/or domains from these proteins. As a representative molecule of the mAb therapeutic class, the NISTmAb PS #8670 was chosen due to the wealth of publicly available knowledge on the moleculeCitation32 and its development into a reference material (RM # 8671) for the biopharmaceutical industry.Citation23,Citation24 To make the measurements more practical for moderate field NMR spectrometers, e.g., 500 MHz to 700 MHz, the Fab domain was generated from the NISTmAb PS #8670.Citation19 To serve as a highly sensitive standard sample to test multiple measurement parameters, an isotopically enriched U-15N, 20%-13C SSS was produced.
Production of the system suitability sample
The U-15N, 20%-13C NIST-Fab, referred to as the SSS, was produced by expression in Pichia pastoris. The heavy and light chains, corresponding to the sequence of the Fab domain obtained after papain cleavage of the NISTmAb, were produced using a bicistronic expression vector using the Invitrogen Pichia Pastoris Expression kit (Life Technologies, Carlsbad, CA) that secretes the folded protein product into the growth media. Isotope labeling was carried out using Citation15N-ammonium sulfate (Sigma Aldrich Corp., St. Louis, MO) as the sole nitrogen source and 13C-methanol (Cambridge Isotope Laboratories, Tewksbury, MA) as the labeled carbon source. The product was purified using an IgG-CH1 affinity column (ThermoFisher Scientific, Waltham, MA). Subsequent mass spectral analysis confirmed that the yeast signal peptide was not fully cleaved, leaving an extra tetrapeptide of Glu-Ala-Glu-Ala on the N-termini of both the heavy and light chains. The purified U-15N, 20%-13C NIST-Fab was buffer exchanged into 25 mM bis-tris-d19 (Cambridge Isotope Laboratories, Tewksbury, MA) pH 6.0 in 5% D2O and adjusted with the same buffer to the final concentration of 53 µM. All quality control checks were performed on the final, pooled sample. These included polyacrylamide gel electrophoresis (PAGE) and 2D 1H,15N and 1H,13C gradient-selected heteronuclear single quantum coherence spectroscopy (gHSQC) experiments. The PAGE (4% – 12% acrylamide, 200 V, ThermoFisher Scientific, Waltham, MA) was performed with the NuPAGE MES-SDS running buffer (ThermoFisher Scientific, Waltham, MA), which included 2.5 mM 2-(N-morpholino)ethanesulfonic acid, 2.5 mM tris base, 0.05 mM ethylenediaminetetraacetic acid (EDTA), 0.005% sodium dodecyl sulfate (SDS), pH 7.3. For the NMR quality control checks, the 2D spectra were acquired on a 900 MHz Bruker Avance III spectrometer (Billerica, MA) equipped with a triple resonance cryogenically-cooled TCI probe with a z-axis gradient system. The acquisition parameters were the same as the D1A and D2A experiments, which are described below. The SSS was sent to NIST-IBBR in Rockville, MD, USA for distribution to all partners.
Production of the unlabeled NIST-Fab
The test protein for the NMR inter-laboratory study was the Fab domain that was produced enzymatically from the NISTmAb PS #8670, which was formulated at 100 mg/mL in 25 mM l-histidine, pH 6.0.Citation33 To generate a sufficient quantity of the unlabeled NIST-Fab protein for the study, the NISTmAb at 8 mg/mL was digested using immobilized papain cross-linked on agarose beaded support (ThermoFisher Scientific, Waltham, MA). Following the cleavage of the NISTmAb into the Fab and Fc domains, the NIST-Fab was purified with a HiTrap rProtein A FF affinity column (GE Healthcare Life Sciences, Pittsburgh, PA). It was subsequently passed through a 100 kDa MWCO Amicon filter (EMD Millipore Corporation, Billerica, MA) to remove high molecular weight impurities, followed by a 30 kDa MWCO Amicon filter (EMD Millipore Corporation, Billerica, MA) to remove low molecular weight contaminants. During the final filtration step, the NIST-Fab was buffer exchanged into 25 mM bis-tris-d19, pH 6.0, in 95% H2O and 5% D2O. The final concentration of the NIST-Fab was adjusted with buffer to 429 µM, which was measured on a NanoDrop 2000 spectrophometer (ThermoFisher Scientific, Waltham, MA) using a theoretical extinction coefficient of 69.95 mM−1cm−1.
Distribution of samples
All 5 mm NMR microtubes matched to the NMR spectrometer vendor type (i.e., Agilent or Bruker BioSpin) found in each of the partnering laboratories were purchased from Shigemi, Inc (Allison Park, PA). The NMR tubes were pre-loaded with the SSS or the NIST-Fab samples (275 µL each) at NIST with an air bubble to allow for water expansion in the event that the samples froze during shipment. All samples were shipped cold. Upon receipt, each laboratory was instructed to store the sample at 4 °C until NMR time could be scheduled. The air bubble between the plunger and sample was removed by each collaborating laboratory before any measurements were performed.
Instrumentation
A total of 39 magnet systems were employed in the inter-laboratory study. Field strengths ranged from 500 MHz to 900 MHz magnets manufactured by Bruker BioSpin (Billerica, MA) or Varian/Agilent (Santa Clara, CA) equipped with cold or standard room temperature probes ( and Table S4). To reduce the likelihood of traceability of data to a collaborating laboratory, the full hardware list was provided to NIST by a third party contractor, National Association of Proficiency Testing (NAPT, Edina, MN), in a randomized fashion.
Table 2. Summary of 39 NMR spectrometers.
Blinding of data
All data was submitted directly to NAPT for data anonymization by each laboratory. NAPT converted all vendor-specific raw data into NMRPipeCitation34 format using version (V)8.9 and assigned an anonymous code. The code consisted of a 4-digit institutional identifier followed by a 3-digit experiment number (e.g., 1247–001). When coupled with experimental type (see Summary of experiments section, below), each experiment received a final 10-digit code (e.g., D2A-1247–001). All anonymized spectra were then submitted to NIST. Institutions who submitted more than one data package received multiple institutional identifiers.
Temperature calibration
The temperature of each magnet was calibrated using perdeuterated methanol in a 5 mm NMR sealed tube (Sigma Aldrich, Inc., St. Louis, MO). A total of three 1D Citation1H experiments were recorded at 310 K. The normalized temperature was calculated using the following equation:
where Δδ is the chemical shift difference in ppm between the methyl and hydroxyl resonances, and T is the absolute temperature of the sample in Kelvin. The temperature of the probe was adjusted so that it was 310 K ± 0.1 K, corresponding to a chemical shift difference of 1.428 ppm. The calibration was additionally performed by each institution that collected spectra at 288 K, 298 K, 318 K, and 323 K, corresponding respectively to chemical shift differences of 1.640 ppm, 1.545 ppm, 1.347 ppm, and 1.295 ppm. All temperatures are given in degrees Celsius elsewhere in this report.
Summary of experiments
Each partnering laboratory conducted a series of required 1H,15N and 1H,13C gHSQC experimentsCitation35 at 37 °C with uniform and non-uniform sampling and could additionally perform optional experiments to further explore methodological space. All experiments are summarized in , and detailed acquisition parameters are given in Tables S5 to S9. The choice of all unspecified experimental parameters (e.g., field strength of pulses, details of decoupling, recycling delay) were left to the operators of the partnering laboratories. For a more detailed list of performed experiments, see Table S1. In general, the required experimental protocol probed uniform sampling and non-uniform sampling in both a field independent (experiments D2A and D2B) and field dependent (experiments D1A, D2C, D2D, D2E, D3A, and D3B) manner. Optional experiments explored different pulse sequences such as the SOFAST-HMQC (sfHMQC, experiments E1C and E2C)Citation26 and phase sensitive HSQC (pHSQC, experiment E2B).Citation36 Other optional measurements included the collection of spectra at 15 °C, 25 °C, 45 °C, and 50 °C (experiments E1B and E2A). Many laboratories also generated custom NUS schedules (experiments E1A and E2N).
Generation of NUS schedules
The NIST-supplied NUS schedules were generated using the Poisson-gap algorithmCitation31 by Prof. Gerhard Wagner’s research group at the Harvard Medical School in Boston, MA. These NUS schedules were then sent to NIST. Custom schedules on Bruker magnet systems were generated with the default schedule in the TopSpin 3 software, which uses a multi-dimensional probability density function. Laboratory 1894 used the Kupče option of the vNMRJ 3.2 software, which used an algorithm for random sampling with no T2 weighting. Laboratory 4233 also used the SineBurst and SineGap algorithmsCitation37 to generate custom NUS schedules.
Spectral processing
All spectra were processed with NMRPipe V8.9Citation34 using a 54° (1H) and 90° (13C and 15N) shifted sine squared window function and zero-filled to quadruple the points in both dimensions before Fourier transform (FT). For uniformly sampled spectra in the indirect dimension, forward-backwards linear prediction to double the number of points was applied prior to zero-filling and FT. For NUS spectra, data were reconstructed using iterative soft thresholding within NMRPipe.Citation38 All spectra were visualized in NMRFAM-Sparky V1.4.Citation39 To calibrate the spectra, separate SSS and NIST-Fab samples were prepared with the standard chemical shift reference molecule, 4,4-dimethyl-4-silapentane-1-sulfonic acid (DSS).Citation40 Three sequential experiments, 1D 1H, 2D 13C or 15N, and 1D 1H, were collected on these doped samples. The Citation1H methyl signal of DSS was set to 0.000 ppm and the 13C and 15N chemical shift references set based on conversion factors determined from their gyromagnetic ratios. Alignment of spectra was performed on an arbitrarily numbered isolated cross peak that had negligible shifting due to temperature. For 1H, 15N data, the cross peak located at δH 7.546 ppm and δN 118.978 ppm (cross peak #68, Figure S1) was used for spectral alignment; for 1H, 13C spectra, the cross peak located at δH 0.513 ppm and δC 17.494 ppm was used (cross peak #29, Figure S2). Arbitrarily numbered peaks lists were created by using the peak-picking feature within NMRFAM-Sparky on a representative 500 MHz spectrum. This peak list was then copied to all other spectra for both the SSS and the NIST-Fab at all temperatures, and each peak was centered using the peak-centering command. For defined peaks that were doublets in the 13C dimension likely due to higher incorporation of two 13C nuclei at adjacent positions in the SSS, the center of the peak was determined using a 1D trace and taking the chemical shift difference between each peak of the doublet and dividing by two. This multiplet spectral signature is an artifact of fractionally enriching the SSS with 20% 13C41 and will not be an issue for spectra of unlabeled biopharmaceuticals collected at natural isotopic abundance. A total of 187 and 95 cross peaks were chosen for 1H,15N and 1H,13C spectra, respectively, for in-depth analysis of peak position. Poor average signal-to-noise (S/N < 10:1) or otherwise poor resolution precluded the ability to create peak lists for a number of spectra (Table S10, Figures S14 and S15). Of the 375 1H,13C HSQCs, 354 were included in the spectral analysis in this report. For 1H,15N HSQCs, only spectra of the SSS (41 of 76) were included in this report due to the difficulty of reliably tracking peak movement at different temperatures, so only spectra recorded at 37 °C were included in the CCSD analyses.
Statistical analysis
All peak lists generated from the spectra were analyzed using CCSD or with PCA. True outliers in this study are those spectra that were excluded from the analyses in this report (Table S10). In general, these outliers were the result of hardware problems or failure to achieve the suggested average S/N of 10:1 (see the Spectral processing sub-section for more details).
Combined chemical shift deviation
CCSDs were computed for 1H,15N and 1H,13C spectra, separately in Microsoft Excel (Redmond, WA), according to the following equation:
where δH and δX are the 1H and 15N or 13C chemical shifts, respectively, of a given cross peak; δH,ref and δX,ref are the 1H and 15N or 13C reference chemical shifts, respectively for the same cross peak; and the frequency weighting factor, α, is equal to 0.1 or 0.251 for 15N and 13C, respectively.Citation15,Citation28 Reference average peak lists were generated from D1A 1H,15N spectra and D2A and D2C 1H,13C spectra, respectively (Tables S11 and S12). An average CCSD value was then computed for each acquired spectrum. Error bars were determined using the standard error of the mean (SEM) with 95% confidence intervals according to the equation:
where µ is the average CCSD, σ is the sample standard deviation, and n is the number of spectra.
Principal component analysis
Principal component analysis (PCA) was applied using the single value decomposition algorithm from the Statistics and Machine Learning ToolboxTM in MATLAB (Mathworks, Inc, Natick, MA). To prepare the peak lists for PCA, unreferenced 1H,13C chemical shifts were weighted in a manner similar to CCSD.
To mean-center the weighted chemical shift values for each peak, the D2A and D2C spectra were chosen as the ‘benchmark’ spectra because they were acquired with the conventional uniformly sampled gHSQC experiment. The weighted chemical shifts for all D2A and D2C peak lists were averaged together for each peak to generate an average weighted peak list. These values were then subtracted from the weighted peak list of each individual spectrum. All spectra were then combined into a matrix of 354 spectra by 95 mean-centered peak positions for input into the PCA algorithm. Appropriate grouping of PCA results, where applicable (see main text), was determined manually by sample type and temperature or by chemometric clustering methods, such as k-medoids, min-max group pair, or UPGMA.Citation42,Citation43 Confidence ellipsoids of 95% and 99% using chi-square probabilities were then plotted for each cluster.
Clustering algorithms
Three clustering algorithms were employed: the k-medoids algorithm, min-max group pair method, and UPGMA. For the k-medoids method, the algorithm seeks to partition spectra into k clusters of minimal intra-cluster distance. To find these clusters, a heuristic was employed wherein initial clusters were chosen by assigning each spectra to its closest cluster center. The initial cluster centers were taken to be the k elements that maximized the sum of pair-wise dissimilarities. Having chosen k initial clusters, a heuristic was applied to find the clustering assignment of minimal intra-cluster distance. This was done by iteratively swapping each point that was a cluster center with each point that was not a cluster center; if the resulting configuration decreased intra-cluster distance, then the configuration was updated to reflect the swap. If not, the swap was reversed. This swapping procedure was iteratively applied to all points until the clustering configuration no longer changed and is analogous to the SWAP step in the PAM heuristic.Citation44
While the k-medoids algorithm is a partitional algorithm, the min-max group pairing algorithm and UPGMA algorithms are hierarchical in nature. In hierarchical clustering algorithms, each element is initially in a singleton cluster. If there are n elements to be clustered, there are initially n clusters. Clusters are iteratively merged until all elements are in a single cluster. The UPGMA algorithm and the min-max group pair algorithm differ in the manner in which clusters are merged: the former merges the two closest clusters at each iteration, while the latter maximizes the ratio of inter-cluster distance to intra-cluster distance. It should be noted that the min-max group pair algorithm is a novel hierarchal clustering algorithm and has been employed for the first time in the present work.
Public data repository
All blinded raw data in NMRPipe format, including NUS schedules and processing scripts, are available at the following URL: www.ibbr.umd.edu/groups/nistmab-nmr
Disclaimers
Certain commercial equipment, instruments, and materials are identified here in order to specify the experimental procedure. Such identification does not imply recommendation or endorsement by the National Institute of Standards and Technology, nor does it imply that the material or equipment identified is necessarily the best available for the purpose. This article reflects the views of the author and should not be construed to represent the U.S. Food and Drug Administration’s views or policies.
Abbreviations
| 2D | = | two-dimensional |
| CCSD | = | combined chemical shift deviation |
| CD | = | circular dichroism |
| FT-IR | = | Fourier transform infrared spectroscopy |
| gHSQC | = | gradient-selected heteronuclear single quantum coherence spectroscopy |
| HOS | = | higher order structure |
| mAb | = | monoclonal antibody |
| NIST | = | National Institute of Standards and Technology |
| NMR | = | nuclear magnetic resonance |
| NUS | = | non-uniform sampling |
| pHSQC | = | phase sensitive heteronuclear single quantum coherence spectroscopy |
| PAGE | = | polyacrylamide gel electrophoresis |
| PCA | = | principal component analysis |
| PS | = | primary sample |
| QA | = | quality attribute |
| RM | = | reference material |
| SEM | = | standard error of the mean |
| SSS | = | system suitability sample |
| SOFAST-HMQC | = | selective optimized flip angle short transient heteronuclear multiple quantum coherence spectroscopy |
| UPGMA | = | Unweighted Pair Group Method with Arithmetic Mean |
Competing Financial Interests
None Declared.
Supplemental Material
Download MS Word (4.5 MB)Acknowledgments
Biogen gives special thanks to the NMR facility and Jean-Christophe Hus for supporting the Biomolecular NMR instrumentation and technical support. We acknowledge Gerhard Wagner, Sven Hyberts, and Haribabu Arthanari for discussions related to experimental design of the NUS component of this project. We also acknowledge their generation of the actual NUS schedules used in the study. Leibniz-Forschungsinstitut für Molekulare Pharmakologie (FMP) acknowledges Monika Beerbaum. NRC Canada thanks Lynne LeSauteur, Director of Downstream Processing and Analytics, for her interest and encouragement. Yung-Hsiang Kao, Associate Director of Protein Analytical Chemistry at Genentech is acknowledged.
Supplementary material
Supplementary material can be accessed here
Disclosure statement
No potential conflict of interest was reported by the authors.
Additional information
Funding
Related Research Data
References
- Statista: The Statistics Portal. Global top 10 companies based on biotech prescription drug revenue in 2017 and 2024. 2018 June [ accessed 2018 Oct 5]. https://www.statista.com/statistics/309460/biotechnology-prescription-drug-revenue-by-top-ten-companies-globally/.
- Stone K. Top 10 biologic drugs in the United States: these drugs are changing the way illnesses are treated. 2018 [ accessed 2018 Oct 5]. https://www.thebalance.com/top-biologic-drugs-2663233.
- Kaplon H, Reichert JM. Antibodies to watch in 2018. mAbs. 2018;10:183–203. doi:10.1080/19420862.2018.1415671.
- United States Food and Drug Administration. Scientific Considerations in Demonstrating Biosimilarity to a Reference Product: Guidance for Industry. Silver Spring (MD): United States Food and Drug Administration; 2015.
- Berkowitz SA, Engen JR, Mazzeo JR, Jones GB. Analytical tools for characterizing biopharmaceuticals and the implications for biosimilars. Nat Rev Drug Discov. 2012;11:527–540. doi:10.1038/nrd3746.
- Borisov OV, Schiel JE, Davis D. Trends and drivers for the development of next-generation biotherapeutic characterization tools. In: Schiel JE, Davis DL, Borisov OV, editors. State-of-the-art and emerging technologies for therapeutic monoclonal antibody characterization, vol 3: defining the next generation of analytical and biophysical techniques. Washington (DC): American Chemical Society; 2015. p. 1–16.
- Weiss WF, Gabrielson JP, Al-Azzam W, Chen G, Davis DL, Das TK, Hayes DB, Houde D, Singh SK. Technical decision making with higher order structure data: perspectives on higher order structure characterization from the biopharmaceutical industry. J Pharm Sci. 2016;105:3465–3470. doi:10.1016/j.xphs.2016.09.003.
- Fisher AC, Lee SL, Harris DP, Buhse L, Kozlowski S, Yu L, Kopcha M, Woodcock J. Advancing pharmaceutical quality: an overview of science and research in the U.S. FDA’s Office of Pharmaceutical Quality. Int J Pharm. 2016;515:390–402. doi:10.1016/j.ijpharm.2016.10.038.
- Gabrielson JP, Weiss WF. Technical decision-making with higher order structure data: starting a new dialogue. J Pharm Sci. 2015;104:1240–1245. doi:10.1002/jps.24393.
- Aubin Y, Gingras G, Sauve S. Assessment of the three-dimensional structure of recombinant protein therapeutics by NMR fingerprinting: demonstration on recombinant human granulocyte macrophage-colony stimulation factor. Anal Chem. 2008;80:2623–2627. doi:10.1021/ac7026222.
- Japelj B, Ilc G, Marusic J, Sencar J, Kuzman D, Plavec J. Biosimilar structural comparability assessment by NMR: from small proteins to monoclonal antibodies. Sci Rep. 2016;6:32201. doi:10.1038/srep32201.
- Kiss R, Fizil Á, Szántay C. What NMR can do in the biopharmaceutical industry. J Pharm Biomed Anal. 2018;147:367–377. doi:10.1016/j.jpba.2017.07.004.
- Aubin Y, Freedberg DI, Jones C. Using NMR spectroscopy to obtain the higher order structure of biopharmaceutical products: simple methods can characterize polysaccharide vaccines and recombinant cytokines at high resolution. Biopharm Int. 2010;S28+.
- Arbogast LW, Brinson RG, Marino JP. Application of natural isotopic abundance (1)H-(13)C- and (1)H-(15)N-correlated two-dimensional NMR for evaluation of the structure of protein therapeutics. Methods Enzymol. 2016;566:3–34. doi:10.1016/bs.mie.2015.09.037.
- Ghasriani H, Hodgson DJ, Brinson RG, McEwen I, Buhse LF, Kozlowski S, Marino JP, Aubin Y, Keire DA. Precision and robustness of 2D-NMR for structure assessment of filgrastim biosimilars. Nat Biotechnol. 2016;34:139–141. doi:10.1038/nbt.3474.
- Aubin Y, Hodgson DJ, Thach WB, Gingras G, Sauve S. Monitoring effects of excipients, formulation parameters and mutations on the high order structure of filgrastim by NMR. Pharma Res. 2015;32:3365–3375. doi:10.1007/s11095-015-1713-3.
- Singh SM, Bandi S, Jones DNM, Mallela KMG. Effect of polysorbate 20 and polysorbate 80 on the higher-order structure of a monoclonal antibody and its fab and fc fragments probed using 2d nuclear magnetic resonance spectroscopy. J Pharm Sci. 2017;106:3486–3498. doi:10.1016/j.xphs.2017.08.011.
- United States Food and Drug Administration. Clinical Pharmacology Data to Support Demonstration of Biosimilarity to a Reference Product: Guidance for Industry. United States Food and Drug Administration, Silver Spring (MD): 2016.
- Arbogast LW, Brinson RG, Marino JP. Mapping monoclonal antibody structure by 2D 13C NMR at natural abundance. Anal Chem. 2015;87:3556–3561. doi:10.1021/ac504804m.
- Arbogast LW, Brinson RG, Formolo T, Hoopes JT, Marino JP. 2D (1)H(N), (15)N correlated NMR methods at natural abundance for obtaining structural maps and statistical comparability of monoclonal antibodies. Pharm Res. 2016;33:462–475. doi:10.1007/s11095-015-1802-3.
- Hodgson DJ, Ghasriani H, Aubin Y. Assessment of the higher order structure of Humira(R), Remicade(R), Avastin(R), Rituxan(R), Herceptin(R), and Enbrel(R) by 2D-NMR fingerprinting. J Pharm Biomed Anal. 2019;163:144–152. doi:10.1016/j.jpba.2018.09.056.
- Schiel JE, Mire-Sluis, A, David D. Monoclonal Antibody Therapeutics: The Need for Biopharmaceutical Reference Materials. In: Schiel JE, Davis DL, Borisov OV, editors. State-of-the-Art and Emerging Technologies for Therapeutic Monoclonal Antibody Characterization Volume 1. Monoclonal Antibody Therapeutics: Structure, Function, and Regulatory Space. Washington (DC): American Chemical Society; 2014. p. 1-34.
- Schiel JE, Turner A. The NISTmAb Reference Material 8671 lifecycle management and quality plan. Anal Bioanal Chem. 2018;410:2067–2078. doi:10.1007/s00216-017-0844-2.
- Schiel JE, Turner A, Mouchahoir T, Yandrofski K, Telikepalli S, King J, DeRose P, Ripple D, Phinney K. The NISTmAb Reference Material 8671 value assignment, homogeneity, and stability. Anal Bioanal Chem. 2018;410:2127–2139. doi:10.1007/s00216-017-0800-1.
- Arbogast LW, Delaglio F, Schiel JE, Marino JP. Multivariate analysis of two-dimensional 1H, 13C methyl NMR spectra of monoclonal antibody therapeutics to facilitate assessment of higher order structure. Anal Chem. 2017;89:11839–11845. doi:10.1021/acs.analchem.7b03571.
- Schanda P, Kupce E, Brutscher B. SOFAST-HMQC experiments for recording two-dimensional heteronuclear correlation spectra of proteins within a few seconds. J Biomol NMR. 2005;33:199–211. doi:10.1007/s10858-005-4425-x.
- Mobli M, Hoch JC. Nonuniform sampling and non-Fourier signal processing methods in multidimensional NMR. Prog Nucl Magn Reson Spectrosc. 2014;83:21–41. doi:10.1016/j.pnmrs.2014.09.002.
- Williamson MP. Using chemical shift perturbation to characterise ligand binding. Prog Nucl Magn Reson Spectrosc. 2013;73:1–16. doi:10.1016/j.pnmrs.2013.02.001.
- European Medicines Agency. ICH Q5E Biotechnological/biological products subject to changes in their manufacturing process: comparability of biotechnological/biological products. London, UK: 2005, CPMP/ICH/5721/03, step 5.
- United States Food and Drug Administration. Considerations in Demonstrating Interchangeability With a Reference Product: Draft Guidance for Industry. Silver Spring (MD): United States Food and Drug Administration; 2017.
- Hyberts SG, Takeuchi K, Wagner G. Poisson-gap sampling and forward maximum entropy reconstruction for enhancing the resolution and sensitivity of protein NMR data. J Am Chem Soc. 2010;132:2145–2147. doi:10.1021/ja908004w.
- Schiel JE, Davis DL, Borisov, OV. State-of-the-art and emerging technologies for therapeutic monoclonal antibody characterization volume 2. biopharmaceutical characterization: the NISTmAb case study. Washington (DC): American Chemical Society; 2015;1201.
- Schiel JE, Davis DL, Borisov, OV. State-of-the-art and emerging technologies for therapeutic monoclonal antibody characterization volume 1. monoclonal antibody therapeutics: structure, function, and regulatory space. Washington (DC): American Chemical Society; 2014;1176.
- Delaglio F, Grzesiek S, Vuister GW, Zhu G, Pfeifer J, Bax A. NMRPipe: a multidimensional spectral processing system based on UNIX pipes. J Biomol NMR. 1995;6:277–293.
- Grzesiek S, Bax A. The importance of not saturating H2O in protein NMR. Application to sensitivity enhancement and NOE measurements. J Am Chem Soc. 1993;115:12593–12594. doi:10.1021/ja00079a052.
- Sklenár V, Piotto M, Leppik R, Saudek V. Gradient-tailored water suppression for 1H - 15N HSQC experiments optimized to retain full sensitivity. J Magn Reson A. 1993;102:241–245. doi:10.1006/jmra.1993.1098.
- Worley B, Powers R. Deterministic multidimensional nonuniform gap sampling. J Magn Reson. 2015;261:19–26. doi:10.1016/j.jmr.2015.09.016.
- Hyberts SG, Milbradt AG, Wagner AB, Arthanari H, Wagner G. Application of iterative soft thresholding for fast reconstruction of NMR data non-uniformly sampled with multidimensional Poisson Gap scheduling. J Biomol NMR. 2012;52:315–327. doi:10.1007/s10858-012-9611-z.
- Lee W, Tonelli M, Markley JL. NMRFAM-SPARKY: enhanced software for biomolecular NMR spectroscopy. Bioinformatics. 2015;31:1325–1327. doi:10.1093/bioinformatics/btu830.
- Markley JL, Bax A, Arata Y, Hilbers CW, Kaptein R, Sykes BD, Wright PE, Wüthrich K. Recommendations for the presentation of NMR structures of proteins and nucleic acids. IUPAC-IUBMB-IUPAB inter-union task group on the standardization of data bases of protein and nucleic acid structures determined by NMR spectroscopy. J Biomol NMR. 1998;12:1–23.
- Wenrich BR, Sonstrom RE, Gupta RA, Rovnyak D. Enhanced biosynthetically directed fractional carbon-13 enrichment of proteins for backbone NMR assignments. Protein Expr Purif. 2015;115:1–10. doi:10.1016/j.pep.2015.08.005.
- Kaufman L, Rousseeuw PJ. Clustering by means of medoidss. In: Diodge Y, editor. Statistical data analysis based on the L_1 Norm and Related Methods. North Holland (MI): University of Michigan; 1987. p. 464.
- Sokal RR. A statistical method for evaluating systematic relationship. Univ Kans Sci Bull. 1958;28:1409–1438.
- Kaufman L, Rousseeuw PJ. Finding groups in data: an introduction to cluster analysis. Hoboken (NJ): John Wiley & Sons, Inc; 2005.