
ABSTRACT
High concentration biotherapeutic formulations are often required to deliver large doses of drugs to achieve a desired degree of efficacy and less frequent dose. However, highly concentrated protein-containing solutions may exhibit undesirable therapeutic properties, such as increased viscosity, aggregation, and phase separation that can affect drug efficacy and raise safety issues. The characterization of high concentration protein formulations is a critical yet challenging analytical task for therapeutic development efforts, due to the lack of technologies capable of making accurate measurements under such conditions. To address this issue, we developed a novel dilution-free hydrogen/deuterium exchange (HDX) mass spectrometry (MS) method for the direct conformational analysis of high concentration biotherapeutics. Here, we particularly focused on studying phase separation phenomenon that can occur at high protein concentrations. First, two aliquots of monoclonal antibodies (mAbs) were dialyzed in either hydrogen- or deuterium-containing buffers at low salt and pH. Phases that separated were then discretely sampled and subjected to dilution-free HDX-MS analysis through mixing the non-deuterated and deuterated protein aliquots. Our HDX-MS results analyzed at a global protein level reveal less deuterium incorporation for the protein-enriched phase compared to the protein-depleted phase present in high concentration formulations. A peptide level analysis further confirmed these observed differences, and a detailed statistical analysis provided direct information surrounding the details of the conformational changes observed. Based on our HDX-MS results, we propose possible structures for the self-associated mAbs present at high concentrations. Our new method can potentially provide useful insights into the unusual behavior of therapeutic proteins in high concentration formulations, aiding their development.
Introduction
Over the past few decades, monoclonal antibodies (mAbs) have grown significantly as treatment strategies for cancers and chronic diseases.Citation1,Citation2 For certain clinical indications, frequent high therapeutic doses (>1 mg/kg) are often required to achieve a desired efficacy.Citation3 Conventionally, such protein therapeutics are delivered via intravenous (IV) administration in order to take advantage of the improved bioavailability and the greater control offered by the method during clinical development compared with other approaches to drug administration.Citation4 Despite the wide use of IV administration, large doses of biopharmaceuticals can take a long time to be delivered IV and often require frequent hospital visits, leading to substantial cost increases for patients and health-care providers. Subcutaneous (SC) injections can serve as an alternative drug administration strategy, allowing for patient self-administration and reducing overall costs, but very high therapeutic concentrations (>100 mg/mL) may be required to deliver high doses.Citation5
Despite the advantages associated with SC administration, development of mAbs formulated at such high concentrations presents many challenges in processing, manufacturing, storage, and delivery, mainly owing to the non-ideal behaviors of highly concentrated proteins, which are quite different from those observed for dilute solutions. Unusual protein behaviors at high concentrations often stem from protein self-association, leading to undesired solution properties, such as increased solution viscosity, opalescent solution appearance, and liquid-liquid phase separation.Citation3,Citation6-Citation9 These unwanted properties can affect drug efficacy and raise safety issues. Liquid–liquid phase separation (LLPS) poses an especially challenging array of problems in the context of biopharmaceutical development efforts.Citation9-Citation14 LLPS is a thermodynamically driven process, during which a homogeneous protein solution forms two distinct phases. The less dense phase typically exhibits a lower protein concentration, whereas the higher-density phase is protein-enriched. LLPS is usually induced by antibody self-association at low temperatures, resulting in protein concentrations for the two phases that are dependent on both temperatures and buffer conditions. LLPS represents a metastable state of the protein solution and can be reversed upon changes in temperature or formulation environment. Many studies have been carried out to investigate the manner in which LLPS phase diagrams are affected by buffer composition, pH, ionic strength, and various excipients.Citation10,Citation11 Characterization of the two protein phases has been performed using various analytical and biophysical techniques, such as size exclusion chromatography (SEC), ion exchange chromatography (IEX), analytical ultracentrifugation (AUC), dynamic light scattering (DLS), turbidity, and viscosity tests.Citation13 However, most of the abovementioned techniques can only be performed on diluted solutions, and thus fail to capture any concentration-dependent properties of the two phases. Therefore, analytical techniques that require minimal sample manipulation and dilution are needed to better understand the structural consequences of LLPS or highly concentrated proteins that are of relevance to biopharmaceutical development efforts.
Hydrogen/deuterium exchange-mass spectrometry (HDX-MS) is a versatile tool for the assessment of protein conformations, dynamics, and interactions and is now increasingly applied to mAb analysis.Citation15-Citation19 However, traditional HDX-MS workflows are typically initiated through the exchange of labile backbone amide hydrogens by diluting protein samples into a D2O-containing buffer.Citation19 Thus, the use of HDX-MS has been limited for analyzing protein samples at very high concentrations. Recently, HDX-MS workflows designed for the analysis of high concentration protein samples have been described.Citation20,Citation21 For example, a recently described HDX-MS methodology that relies upon reconstituting lyophilized mAb powders in a deuterated buffer was able to characterize mAb structures at 60 mg/mL.Citation20 This approach identified protein–protein interfaces associated with a concentration-dependent reversible self-association. While lyophilization combined with HDX-MS can provide protein structure information in a dilution-free mode, the workflow introduces a reconstitution step and is limited to those buffers amenable to the lyophilization process. To overcome these limitations, a dialysis-coupled HDX-MS strategy was recently reported for mAb analysis, in which passive dialysis microcassettes are used for HDX labeling.Citation21 While this approach successfully sampled high concentration (200 mg/mL) IgG4 formulations for comparison with low concentration (3 mg/mL) samples, the long timescales needed for dialysis likely render many known modes of protein motion inaccessible to the technology.
Here, we describe a novel HDX-MS strategy for assessing protein structures with no manipulation of sample concentration. We begin by preparing two mAb samples at the same concentration: one dialyzed to hydrogen-containing buffer and the other to deuterium-containing buffer under the same conditions. HDX reactions are then initiated by mixing the two protein fractions in a 1 to 1 ratio, followed by MS analysis of either intact protein or peptide level. Since both H2O and D2O fractions contain the same concentration of protein, no dilution occurs after mixing. Specifically, we applied this HDX-MS approach toward the comparative characterization of mAb samples in the case of LLPS. A humanized IgG4 monoclonal antibody (referred to as “Mab4”) was studied as a model system. Our global HDX-MS data revealed less deuterium uptake for Mab4 in the high-density phase compared to those in the low-density phase, suggesting the prevalence of less dynamic protein conformations within the former phase. A statistical analysis of our HDX-MS results acquired at the peptide level identified mAb regions exhibiting significant decreases in HDX for mAbs present in the high-density phase. We conclude by proposing a molecular mechanism that describes our phase-separated IgG4 samples.
Results
DSC and DLS measurements reveal concentration-dependent mAb structures
As reported in the literature and observed in our buffer screening experiments (see Supporting Information), LLPS is a reversible process for high concentration mAb samples. When the temperature is higher than the critical temperature (TC), the two phases merge and reform one homogeneous phase.Citation10 Similarly, if the highly concentrated solution is diluted to a concentration lower than the concentration of upper phase, then phase separation will not occur. Despite previous studies, many questions remain surrounding the structures of phase-separated mAbs. Specifically, these questions include those focused on whether proteins possess any specific structural characteristics that favor one phase over another, and if proteins can adapt their conformations upon phase separation. In addition, it is not clear if proteins are able to maintain structural properties acquired during phase separation at high concentration following sample dilution. In an effort to answer some of these questions, we assembled an array of biophysical tools to study Mab4 under LLPS conditions.
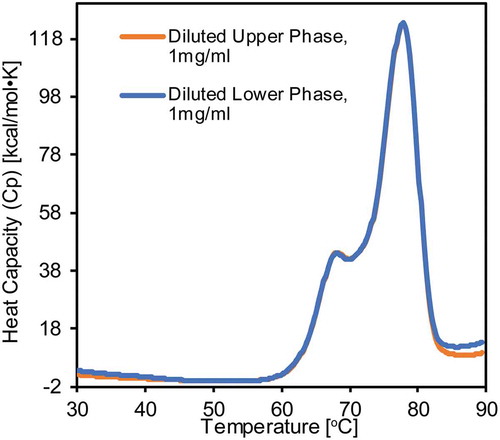
We performed differential scanning calorimetry (DSC) measurements to characterize the thermal stability of phase-separated Mab4. The Mab4 sample was prepared at a concentration of 50 mg/mL and separated into two clear phases while incubated at 5ºC. Samples from the two phases were taken and diluted to 1 mg/mL prior to DSC measurements. As shown in , the two samples exhibit highly similar melt temperature profiles, consisting of two major transitions taking place around 68.0ºC and 77.8ºC. The nearly identical DSC profiles recorded for the two Mab4 samples strongly indicate that the mAbs occupy similar structures regardless of the phases in which they are present during phase separation process or that any phase-dependent structural changes are not retained following the sample dilution step necessary for DSC. DLS measurements for diluted Mab4 samples produced results similar to our DSC experiments. A diffusion interaction parameter (kD) can be empirically determined by measuring the diffusion coefficient (D) for mAbs as a function of protein concentration based on DLS data. Within the concentration range from 0.5 mg/mL to 3 mg/mL, extracted kD values are −52.1 mL/g and −50.8 mL/g for Mab4 in the low- and high-density phases, respectively. Negative kD values represent attractive intermolecular interactions, suggesting a tendency for Mab4 to self-associate and aggregate independent of the protein concentration.
Figure 1. DSC thermograms of Mab4 from upper phase (orange) and lower phase (blue). Mab4 samples from the low- and high-density phases were diluted from 28 mg/mL and 150 mg/mL to 1 mg/mL, respectively. Protein denaturation was induced by ramping temperature to 90°C at 1°C/min rate.
An HDX-MS workflow for phase-separated mAb samples at high concentration
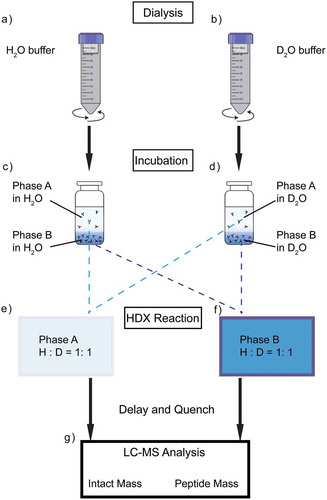
In order to assess protein structures directly at high concentration, we designed an HDX-MS workflow that can be performed in the absence of dilution. The experimental procedure in the case of LLPS is shown in , and this approach can be applied similarly to any studies that require direct conformational analysis of protein samples at high concentration. Generally, the sample preparation begins with overnight dialysis of protein into the target formulation. () Dialysis is performed using a 10 kDa molecular weight cut-off (MWCO) MINI dialysis device that can hold 2 mL maximum sample volume, placed in a 50 mL conical tube containing the dialysis buffer. The conical tube is gently shaken at ~200 rpm to avoid agitation-induced aggregation. Dialysis buffer is changed twice during dialysis to reach full equilibrium. Two dialysis buffers comprising the same chemical formulation are prepared, of which one was in H2O solvent and the other in D2O. Following the dialysis protocol described above, two fractions of the protein samples are buffer exchanged into the H2O buffer and the D2O buffer separately. Meanwhile, protein in the D2O buffer undergoes HDX. The samples are incubated for at least one week to ensure that the exchange reaches equilibrium. () Following sample preparation, HDX is initiated by mixing H2O-buffered sample with that in the D2O buffer using a 1:1 ratio. () Because the D2O buffer also contains protein, the overall protein concentration of the sample analyzed by MS can be maintained. Mixed samples are then subjected to MS analysis at the intact protein or peptide levels. ()
Figure 2. Schematic of dilution-free HDX-MS workflow, taking phase separation sample as an example. The experiment starts with sample dialysis into the target formulation in H2O (a) or D2O (b). Protein samples are then incubated at certain temperature allowing equilibration (c,d). Buffer exchanged protein samples are subjected to MS analysis as control. Then, HDX reaction is initiated through mixing H2O sample with D2O sample at 1:1 ratio (e,f) and quenched at certain time points, followed by MS analysis at intact protein or peptide level.
One of the advantages of this workflow over previous approaches is the ability to study the effect of LLPS and other solution phase properties on protein structure at high concentration. HDX-MS of Mab4 samples prepared at a concentration of 50 mg/mL were dialyzed into the 10 mM citrate buffer with 50 mM NaCl at pH 6. Once dialysis was complete, Mab4 solutions were stored at 5ºC to bring about phase separation. Following LLPS, protein concentration was measured to be 28 mg/mL for the lower-density phase and 150 mg/mL for the higher-density phase. Previous reports have demonstrated that the impact of increased solution viscosity on the rate of HDX is negligible.Citation22-Citation24 Thus, we assumed that a direct comparison of HDX profiles could be performed for Mab4 in the two liquid phases observed in our samples.
Comparative HDX-MS analysis of intact mAbs
Intact Mab4 masses were recorded for samples following HDX to provide an overall picture of antibody structural changes as a function of phase. For each mAb charge state, two resolved peaks were detected at the first reaction time point (100 s), with the lower mass species corresponding to mAbs that were incubated in hydrogen-containing buffer, with the higher mass species having fully exchanged in the presence of D2O. As HDX labeling time is increased, fully exchanged mAbs back-exchange with H2O, while unexchanged mAbs undergo the forward HDX reaction, resulting in the coalescence of the separated features recorded in initial mass spectra. Deconvoluted masses were used in our data analysis workflow to track the amount of HDX achieved experimentally.
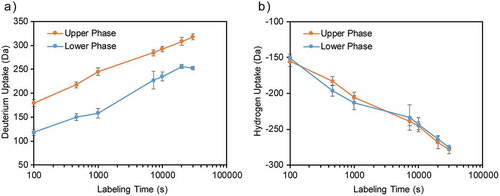
To capture our protein level HDX results, we plotted the deuterium uptake level against HDX labeling time to generate an “exchange-in” profile for Mab4 sampled from the lower- and higher-density phases prepared in the H2O buffer (). We observed that Mab4 sampled from the lower-density phase within our samples exhibits larger mass shifts compared to Mab4 taken from the higher-density phase across all labeling time points, indicating increased flexibility and surface accessibility for Mab4 molecules in the lower-density phase. We also monitored HDX back-exchange or the “exchange-out” profile for our data, focusing on samples prepared in the D2O buffer, and observed a different trend ( and S2 (b)). Critically, the observed hydrogen uptake level is almost identical for mAbs sampled from the two phases, suggesting similar protein conformations and dynamics regardless of protein concentration (). The observation indicates that substituting the readily exchangeable hydrogens with deuterons as a starting point for our experiments may induce structural changes in the antibody. Our current HDX-MS workflow, however, cannot unequivocally identify the underlying cause of such structural effect of deuteration. Thus, we focused primarily on when constructing our LLPS protein structure models below.
Figure 3. HDX exchange profiles measured by intact MS analysis. Error bars represent standard deviation from three individual experiments. (a) Mass increase is observed for the samples prepared in H2O buffer. Mab4 in the upper phase (28 mg/mL) exhibit higher deuterium incorporation level than lower phase (150 mg/mL). (b) Mass decrease is observed for the sample prepared in D2O buffer as the deuterated Mab4 exchange with H2O. The deuterated proteins from the two phases have almost identical deuterium/hydrogen exchange rate.
HDX-MS at the peptide level defines local conformational differences in phase-separated mAbs
We probed local conformational differences in phase-separated Mab4 samples using bottom-up HDX-MS. HDX labeling was carried out over five time points: 30 s, 100 s, 1000 s, 2000s, and 10000 s. In total, we detected more than 100 peptides reproducibly during our bottom-up HDX-MS analysis, producing a sequence coverage of 77.4% for the Mab4 heavy chain and 100% for the Mab4 light chain. Similar to our intact mass measurements, a bimodal distribution of isotopic peaks was typically observed for all peptides detected after the HDX reaction. However, not all deuterated species were well resolved, owing to the smaller mass differences and relatively wider isotopic distributions exhibited by small peptides upon deuteration in comparison to protein data, where average mass data is collected. Such bimodal distributions in m/z posed challenges in processing our HDX data, which were largely overcome by using Mass Spec StudioCitation25 to produce an integrative data processing workflow.
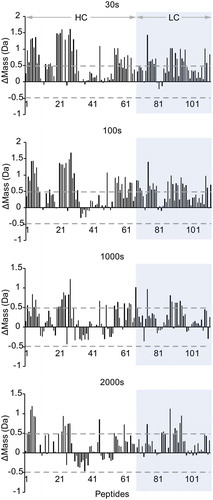
shows representative selection of 12 peptides, covering all Mab4 domains, where deuterium uptake is tracked as a function of labeling time. In general, most peptides detected from the higher-density phase show lower deuterium uptake levels compared to those extracted from the lower-density phase. For some of these peptides, deuteration differences observed between the two phases are consistent across all labeling time points, whereas some peptides display noticeable trends in their relative deuteration levels. To evaluate the significance of the observed differences, we used a statistical analysis module within Mass Spec Studio to further analyze our peptide HDX-MS results, outputting mass difference values across peptides and evaluating these changes against the mean variation in our samples to assess the statistical significance of the changes in deuterium incorporation detected. As shown in , a global view of our statistically processed data was achieved by plotting the mass differences of all peptides and projecting gray dashed lines that represent a two standard deviation threshold (±0.48 Da) identified by our analysis as a minimal difference value to assign significance to the detected change at the 95% confidence interval. At labeling times of 30 s and 100 s, almost all identified peptides exhibit decreased HDX in the high-density phase, of which about 40% represent significant changes. We also note an apparent decrease in differentiated exchange patterns at longer labeling time points, likely due to false negative peak identifications caused by increased mass overlap due to large absolute levels of HDX. As such, these longer time points are not considered in our detailed structural analysis below.
Figure 4. Deuterium uptake plots for 12 representative peptides in the upper phase (orange, 28 mg/mL) and lower phase (green, 150 mg/mL), covering all domains of Mab4. Error bars represent standard deviation values from three individual experiments.
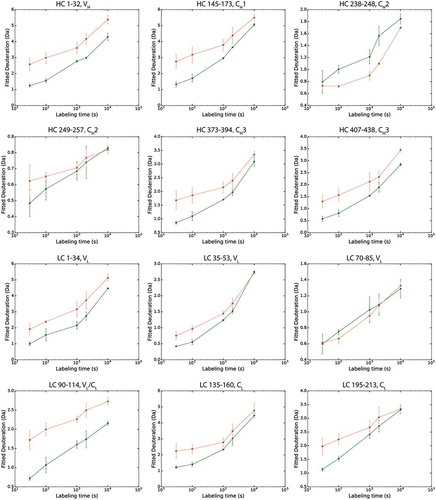
Figure 5. Relative mass differences in deuterium uptake at four time points for all peptides identified of Mab4 in the diluted phase versus in the concentrated phase. Dashed line represents the 2x standard deviation value as the cutoff limit for statistical significance.
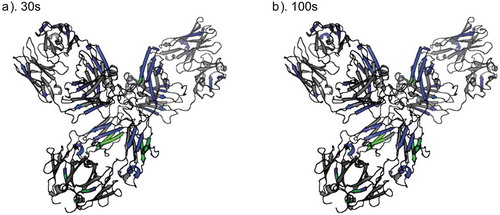
In order to begin building a molecular model of mAb conformational changes that occur during LLPS based on our data, we mapped the HDX-MS results onto a homology model of Mab4 built from an IgG4 crystal structure. shows significant HDX differences mapped on the homology model at time points 30 s and 100 s. Peptide segments within Mab4 where we observed significantly decreased deuterium uptake in the high-density phase are colored blue, gray-colored areas represent peptide segments showing no significant differences between the two phases, and green regions indicate those missing from our dataset. Though we did not achieve complete sequence coverage for Mab4, the peptides identified in HDX-MS experiments comprehensively cover all Mab4 domains, giving us a detailed view on LLPS-associated structural changes. In general, we observe peptides that exhibit significant changes in deuterium uptake across all regions of the antibody, with most of the detected shifts in protein flexibility and/or accessibility present in the antigen-binding fragment (Fab) and in the Fc region proximal to the site of N-linked glycosylation.
Figure 6. HDX-MS results mapped on a homology model, at (a) 30 s and (b) 100 s labeling time points. Regions where significant decreased deuterium uptake observed in the condensed phase are colored blue and regions showing no significant differences are colored gray. Green represents no HDX-MS data available for HC197-230 (CH1/hinge), HC272-302 (glycopeptides), and HC439-442 (C-terminus).
Discussion
Understanding the behavior of therapeutic proteins within high concentrations is of interest due to the growing demand for such high concentration formulations as treatment options. However, a lack of dilution-free analytical techniques poses many challenges in characterizing concentration-dependent protein properties. LLPS is of particular concern during the discovery and development of therapeutic proteins. Based on our initial LLPS screening experiments, phase separation was observed for an IgG4 prepared at specific ionic strength, pH and at low temperature, where a less dense phase containing lower concentration protein and a higher-density phase consisting of concentrated protein were formed. Biophysical profiles recorded at low concentration were highly similar for Mab4 samples taken from the two separated phases, suggesting that any differential structural properties in LLPS might not be preserved during sample dilution. In contrast, using our new HDX-MS workflow, we were able to carry out the deuterium labeling reaction directly at high protein concentration by mixing the protein sample with D2O buffer containing the identical protein.
We observed lower deuterium uptake level for Mab4 sampled from the high-density phase versus Mab4 from the low-density phase, at both the intact protein and peptide levels. The HDX results suggest that mAb structural changes occur during LLPS, involving multiple regions in the mAb as shown in the homology model. Although the HDX-MS experiments cannot unambiguously map sites on the protein associated with altered structure or protein–protein contacts, our results clearly indicate that mAb conformation and dynamics are perturbed at the local level by LLPS and associated shifts in protein concentration. One possible explanation for these observations is the formation of antibody clusters in the condensed, high-density phase involving specific points on the mAb surface. The overall decrease in the deuterium uptake for molecules in the higher-density phase may also be influenced by molecular crowding, which may act to rigidify the domain movements. Significant deuteration differences observed in the Fab region can be rationalized by a combination of crowding effects and the formation of mAb oligomers with protein–protein interfaces associated with the Fab and Fc regions of Mab4.
In summary, we developed a novel dilution-free HDX-MS strategy and demonstrated the application of this method for a comparative conformational analysis of mAbs in a phase-separated sample. In the HDX-MS monitored at the intact protein level, measured masses of deuterated Mab4 sampled from the high-density phase was constantly lower than Mab4 extracted from the low-density phase, suggesting mAb structural changes induced by phase separation. A more comprehensive HDX-MS analysis at the peptide level provided localized structural information. Our results were mapped on a homology model, highlighting the Fab and Fc regions that are likely involved in either local conformation changes or protein–protein association events at high concentrations. Although specific interaction sites were not explicitly mapped, this HDX-MS method can be used to directly measure the structural impact of high protein concentration. Ongoing efforts in experimental method development and data processing will continue to build and refine HDX-MS approaches into validated methods that can be combined with orthogonal biophysical tools to increase our understanding of protein structures over an ever-wider array of therapeutically relevant conditions.
Materials and methods
Materials
A humanized IgG4 monoclonal antibody (referred to as “Mab4”) was expressed, purified and formulated at Eli Lilly and Company. Deuterium oxide (99.9% atom D) was purchased from Sigma-Aldrich. Tris (2-carboxyethyl) phosphine hydrochloride (TCEP·HCl), 8 M guanidine-HCl Solution, formic acid (FA), trifluoroacetic acid (TFA) and Slide-A-Lyzer™ MINI dialysis device (10K MWCO, 2 mL) were purchased from ThermoFisher Scientific. All other chemicals were purchased from Fisher Scientific.
Buffer screening experiments
Ten millimolar citrate buffers at pH 5.5, 6, and 6.5 were prepared by dissolving citrate acid solid and monosodium citrate solid at specific ratios. Sodium chloride solid was weighed and dissolved in the citrate buffer to keep the ionic strengths. Buffer pH was measured and adjusted using a calibrated pH meter at room temperature. Mab4 was buffer exchanged through overnight dialysis using the 10K MWCO dialysis device. After protein dialysis, Mab4 samples were stored at 5ºC at least overnight to allow phase separation. After phase separation, the concentrations of Mab4 in the two phases were measured with UV-Vis at 280 nm. The results were discussed in the Supporting Information and were used to determine the buffer condition for the following phase separation study.
Phase separation sample preparation for HDX-MS
Ten millimolar citrate buffer with 50 mM NaCl at pH 6 was chosen for phase separation study. Two buffers were prepared for HDX-MS, using water or deuterium oxide as a solvent. The pH of the buffers were direct readouts from the pH meter without any correction for the isotope effect. Two fractions of Mab4 samples at the concentration of 50 mg/mL were prepared. One Mab4 fraction was dialyzed into the buffer prepared in water and another fraction was dialyzed into the buffer prepared in D2O. Mab4 samples were then incubated at 5ºC for one week, allowing phase separation. Longer incubation time also permits the hydrogen-deuterium exchange to reach equilibrium for Mab4 prepared in D2O buffer. The concentrations of the upper and lower phases were measured to be 28 mg/mL and 150 mg/mL, respectively, by UV-Vis at 280 nm.
Biophysical assays – differential scanning calorimetry and dynamic light scattering
Protein samples were taken from the two separated phases and diluted to 1 mg/mL using the same buffer. DSC measurements were performed on a MicroCal DSC instrument (Malvern Panalytical technologies). Temperature was ramped from 25ºC to 90ºC at 1ºC/min rate. The buffer-buffer baseline was measured before running the protein sample. The baseline subtracted thermograms were plotted. The onset temperature and max temperature for unfolding transition were obtained from the DSC data.
DLS measurements were performed on four protein concentrations: 0.5 mg/ml, 1 mg/ml, 2 mg/ml, and 3 mg/ml. Protein samples were taken from the two separated phases and diluted to the target concentrations. The interactions parameter (kD) value was then determined by a linear fit of the measured (mutual) diffusion coefficients (Dm) as a function of concentration.
Global hydrogen-deuterium mass spectrometry
For proteins in the upper phase with the concentration of 28 mg/mL, 10 µL of sample in water buffer was taken and mixed with 10 µL of sample in D2O buffer. The mixture was incubated in the LC autosampler at ~5ºC. LC-MS sequence was set up to inject the sample at 100 s, 460 s, 7300 s, 1000 s, 10000 s, 20080 s, and 29980 s. The HDX reaction was quenched once the protein sample was loaded into the LC sample loop and mixed with acidified mobile phase. The protein sample was desalted and eluted on a reverse phase column (Agilent PLRS 1 × 50 mm, 1000 Å, 5 µm), using mobile phase composed of 0.05% TFA in H2O and 0.04% TFA in acetonitrile. The LC column was kept in an ice bath to minimize back exchange. Following on-line LC separation, MS analysis was performed on a Water Synapt G2-Si Q-Tof mass spectrometer. For protein sample in the lower phase with the concentration of 150 mg/mL, global HDX-MS analysis was performed following the same protocol as above.
Bottom-up hydrogen-deuterium exchange mass spectrometry
A quench buffer containing 0.45 M TCEP, 3.6 M GdnHCl and 0.18 M phosphate at pH 2.3 was prepared and equilibrated at ~0ºC. For analysis of Mab4 in the upper phase, 2 µL of protein sample in H2O buffer was mixed with 2 µL of the sample in D2O buffer and incubated at 5ºC for five labeling time points: 30 s, 100 s, 1000 s, 2000s, and 10000 s. At each time point, the exchange reaction was quenched by quickly adding 60 µL of quench buffer at 0ºC, followed by the dilution with 60 µL of 0.1% FA, pH 2.5. The total time for quench and dilution was carefully controlled at 1 min. The labeled and quenched sample was then subject to protease digestion by incubating with 8 µL of 10 mg/mL pepsin at 0ºC for 3.5 min. For analysis of proteins in the concentrated phase, the exchange reaction was carried out and quenched in the same fashion, except that 28 µL of 10 mg/mL pepsin were used to produce more effective digestion due to the higher protein concentration. Consequently, the volume of 0.1% formic acid added to the higher-density phase sample was lowered to 40 µL, in order to keep the sample dilution levels consistent with the sample from the low-density phase.
The digested sample was immediately analyzed by LC-MS. Peptides were separated on a C18 column (Waters ACQUITY UPLC CSH C18, 1.7 µm, 2.1 × 50 mm). To minimize back exchange, the LC column was kept in an ice bath. Mobile phase was comprised of H2O and acetonitrile, both containing 0.1% FA. An acetonitrile gradient from 10% to 50% was used to elute the peptides. The eluents were directly analyzed by a Thermo Scientific Orbitrap Fusion Lumos Tribrid™ Mass Spectrometer operating in positive mode.
HDX-MS data analysis
Masslynx (Waters Corp.) was used to process global HDX-MS data. The zero-charge mass spectrum was generated by performing the MaxEnt deconvolution. The global HDX-MS kinetic plot was created by plotting the measured intact mass of the deuterium-labeled mAb against the reaction time. For peptide level HDX-MS data, MS/MS data collected for the control sample was processed using Proteome Discoverer (Thermo Scientific) to generate a reference peptide list. The HDX-MS data were then analyzed using Mass Spec Studio.Citation25 Briefly, both a master peptide list and the raw MS data were input into the software to produce initial peptide identifications. Peptides identified based on both their monoisotopic mass and retention time were then manually validated. Though Mass Spec Studio cannot directly deconvolute the bimodal distributions detected for our deuterated peptide signals, it is capable of estimating the deuterium content by fitting a subset of isotopic peaks to an isotope expansion model. Statistical analysis was performed to calculate the averaged standard deviation of deuterium uptake across all peptide replicates. In addition to the 2x standard deviation criteria, a two-tailed Student’s t-test was performed using pooled standard deviation to calculate the p-values from the replicate data on a per-peptide basis. A homology model was built based on the crystal structure of IgG4 (PDB: 5DK3) using PyMod 2.0 within Pymol.Citation26,Citation27 Statistical analysis of the HDX-MS was performed using the statistical analysis module in Mass Spec Studio and the results were visualized using our homology model.
Abbreviations
| AUC | = | Analytical ultracentrifugation |
| DLS | = | Dynamic light scattering |
| Dm | = | Mutual diffusion coefficient |
| DSC | = | Differential scanning calorimetry |
| FA | = | Formic acid |
| Fab | = | Fragment antigen-binding |
| Fc | = | Fragment crystallizable |
| HDX-MS | = | Hydrogen/deuterium exchange mass spectrometry |
| IEX | = | Ion exchange chromatography |
| IV | = | Intravenous |
| kD | = | Diffusion interaction parameter |
| LC-MS | = | Liquid chromatography mass spectrometry |
| LLPS | = | Liquid-liquid phase separation |
| mAb | = | Monoclonal antibody |
| MWCO | = | Molecular weight cut-off |
| SC | = | Subcutaneous |
| SEC | = | Size exclusion chromatography |
| Tc | = | Critical temperature |
| TFA | = | Trifluoroacetic acid |
Disclosure of Potential Conflicts of Interest
No potential conflicts of interest were disclosed.
Supplemental Material
Download MS Word (241.3 KB)Acknowledgement
The authors would like to thank Matthew W. Hyatt for his help in DSC and DLS data collection.
Supplementary material
Supplemental data for this article can be accessed on the publisher’s website.
Additional information
Funding
References
- Walsh G. Biopharmaceutical benchmarks 2014. Nat Biotechnol. 2014;32:992–1000. doi:10.1038/nbt.3040.
- Ecker DM, Jones SD, Levine HL. The therapeutic monoclonal antibody market. MAbs. 2015;7:9–14. doi:10.4161/19420862.2015.989042.
- Shire SJ, Shahrokh Z, Liu J. Challenges in the development of high protein concentration formulations. J Pharm Sci. 2004;93:1390–402. doi:10.1002/JPS.20079.
- Lobo ED, Hansen RJ, Balthasar JP. Antibody pharmacokinetics and pharmacodynamics. J Pharm Sci. 2004;93:2645–68. doi:10.1002/JPS.20178.
- Turner MR, Balu-Iyer SV. Challenges and opportunities for the subcutaneous delivery of therapeutic proteins. J Pharm Sci. 2018;107:1247–60. doi:10.1016/j.xphs.2018.01.007.
- Yadav S, Laue TM, Kalonia DS, Singh SN, Shire SJ. The influence of charge distribution on self-association and viscosity behavior of monoclonal antibody solutions. Mol Pharm. 2012;9:791–802. doi:10.1021/mp200566k.
- Yadav S, Liu J, Shire SJ, Kalonia DS. Specific interactions in high concentration antibody solutions resulting in high viscosity. J Pharm Sci. 2010;99:1152–68. doi:10.1002/JPS.21898.
- Chi EY, Krishnan S, Randolph TW, Carpenter JF. Physical stability of proteins in aqueous solution: mechanism and driving forces in nonnative protein aggregation. Pharm Res. 2003;20:1325–36. doi:10.1023/A:1025771421906.
- Ahamed T, Esteban BNA, Ottens M, Gwk VD, Lam VDW, Bisschops MAT, Lee A, Pham C, Thömmes J. Phase behavior of an intact monoclonal antibody. Biophys J. 2007;93:610–19. doi:10.1529/BIOPHYSJ.106.098293.
- Mason BD, Zhang-van Enk J, Zhang L, Remmele RL, Zhang J. Liquid-liquid phase separation of a monoclonal antibody and nonmonotonic influence of hofmeister anions. Biophys J. 2010;99:3792–800. doi:10.1016/J.BPJ.2010.10.040.
- Nishi H, Miyajima M, Nakagami H, Noda M, Uchiyama S, Fukui K. Phase separation of an IgG1 antibody solution under a low ionic strength condition. Pharm Res. 2010;27:1348–60. doi:10.1007/s11095-010-0125-7.
- Lewus RA, Darcy PA, Lenhoff AM, Sandler SI. Interactions and phase behavior of a monoclonal antibody. Biotechnol Prog. 2011;27:280–89. doi:10.1002/btpr.536.
- Chow C-K, Allan BW, Chai Q, Atwell S, Lu J. Therapeutic antibody engineering to improve viscosity and phase separation guided by crystal structure. Mol Pharm. 2016;13:915–23. doi:10.1021/acs.molpharmaceut.5b00817.
- Reiche K, Hartl J, Blume A, Garidel P. Liquid-liquid phase separation of a monoclonal antibody at low ionic strength: influence of anion charge and concentration. Biophys Chem. 2017;220:7–19. doi:10.1016/J.BPC.2016.08.003.
- Konermann L, Pan J, Liu Y-H. Hydrogen exchange mass spectrometry for studying protein structure and dynamics. Chem Soc Rev. 2011;40:1224–34. doi:10.1039/C0CS00113A.
- Huang RY-C, Chen G. Higher order structure characterization of protein therapeutics by hydrogen/deuterium exchange mass spectrometry. Anal Bioanal Chem. 2014;406:6541–58. doi:10.1007/s00216-014-7924-3.
- Masson GR, Jenkins ML, Burke JE. An overview of hydrogen deuterium exchange mass spectrometry (HDX-MS) in drug discovery. Expert Opin Drug Discov. 2017;12:981–94. doi:10.1080/17460441.2017.1363734.
- Wei H, Mo J, Tao L, Russell RJ, Tymiak AA, Chen G, Iacob RE, Engen JR. Hydrogen/deuterium exchange mass spectrometry for probing higher order structure of protein therapeutics: methodology and applications. Drug Discov Today. 2014;19:95–102. doi:10.1016/j.drudis.2013.07.019.
- Houde D, Engen JR. Conformational analysis of recombinant monoclonal antibodies with hydrogen/deuterium exchange mass spectrometry. Methods Mol Biol. 2013;269–89. [Internet]. doi:10.1007/978-1-62703-327-5_17.
- Arora J, Hickey JM, Majumdar R, Esfandiary R, Bishop SM, Samra HS, Middaugh CR, Weis DD, Volkin DB. Hydrogen exchange mass spectrometry reveals protein interfaces and distant dynamic coupling effects during the reversible self-association of an IgG1 monoclonal antibody. MAbs. 2015;7:525–39. doi:10.1080/19420862.2015.1029217.
- Houde D, Nazari ZE, Bou-Assaf GM, Weiskopf AS, Rand KD. Conformational analysis of proteins in highly concentrated solutions by dialysis-coupled hydrogen/deuterium exchange mass spectrometry. J Am Soc Mass Spectrom. 2016;27:669–76. doi:10.1007/s13361-015-1331-7.
- Wang A, Robertson AD, Bolen DW. Effects of a naturally occurring compatible osmolyte on the internal dynamics of ribonuclease A. Biochemistry. 1995;34:15096–104. doi:10.1021/bi00046a016.
- Lim WK, Rösgen J, Englander SW. Urea, but not guanidinium, destabilizes proteins by forming hydrogen bonds to the peptide group. Proc Natl Acad Sci. 2009;106:2595–600. doi:10.1073/pnas.0812588106.
- Manikwar P, Majumdar R, Hickey JM, S V T, Samra HS, Sathish HA, Bishop SM, Middaugh CR, Weis DD, Volkin DB. Correlating excipient effects on conformational and storage stability of an IgG1 monoclonal antibody with local dynamics as measured by hydrogen/deuterium-exchange mass spectrometry. J Pharm Sci. 2013;102:2136–51. doi:10.1002/jps.23543.
- Rey M, Sarpe V, Burns KM, Buse J, Baker CAH, van Dijk M, Wordeman L, Bonvin AMJJ, Schriemer DC. Mass spec studio for integrative structural biology. Structure. 2014;22:1538–48. doi:10.1016/J.STR.2014.08.013.
- Bramucci E, Paiardini A, Bossa F, Pascarella S. PyMod: sequence similarity searches, multiple sequence-structure alignments, and homology modeling within PyMOL. BMC Bioinformatics. 2012;13:S2. doi:10.1186/1471-2105-13-S4-S2.
- Janson G, Zhang C, Prado MG, Paiardini A. PyMod2.0: improvements in protein sequence-structure analysis and homology modeling within PyMOL. Bioinformatics. 2016;33:444–46. doi:10.1093/bioinformatics/btw638.