
ABSTRACT
The Fc-fusion protein atacicept is currently under clinical investigation for its biotherapeutic application in autoimmune diseases owing to its ability to bind the two cytokines B-Lymphocyte Stimulator (BLyS) and A PRoliferation-Inducing Ligand (APRIL). Like typical recombinant IgG-based therapeutics, atacicept is a glycoprotein whose glycosylation-related heterogeneity arises from the glycosylation-site localization, site-specific occupation and structural diversity of the attached glycans. Here, we present a first comprehensive site-specific N- and O-glycosylation characterization of atacicept using mass spectrometry-based workflows. First, N- and O-glycosylation sites and their corresponding glycoforms were identified. Second, a relative quantitation of the N-glycosylation site microheterogeneity was achieved by glycopeptide analysis, which was further supported by analysis of the released N-glycans. We confirmed the presence of one N-glycosylation site, carrying 47 glycoforms covering 34 different compositions, next to two hinge region O-glycosylation sites with core 1-type glycans. The relative O-glycan distribution was analyzed based on the de-N-glycosylated intact protein species. Overall, N- and O-glycosylation were consistent between two individual production batches.
Introduction
The use of recombinant antibodies and their derivatives in therapeutic treatments has been extremely successful. This may be explained by the selectivity of antibodies for their respective antigen, which offers opportunities for development of innovative and targeted ways of treatment. In addition, their pharmacodynamic (PD) and pharmacokinetic (PK) characteristics are favorable for use as therapeutic agents. Recombinant antibody-based drugs entering clinical trial Phase 1 have demonstrated significantly higher final approval rates compared to other types of molecules, encouraging biopharmaceutical manufacturers to focus on this class of therapeutics.Citation1,Citation2
Antibody-based therapeutics currently include different formats, including full-length canonical monoclonal antibodies (mAbs), bispecific antibodies (bsAbs), antigen-binding fragments (Fab), antibody-drug conjugates (ADCs) and Fc-fusion proteins. Fc-fusion proteins are obtained by fusing a protein or a peptide with the crystallizable fragment (Fc) of an antibody. Atacicept is a therapeutic Fc-fusion protein composed of the extracellular ligand-binding portion of the transmembrane activator, calcium-modulator and cyclophilin-ligand-interactor (TACI) receptor linked to a modified Fc-domain of human IgG.Citation3 The TACI receptor domain of atacicept can act as an antagonist and bind the two cytokines B-Lymphocyte Stimulator (BLyS) and A PRoliferation-Inducing Ligand (APRIL), which play a regulatory role in B-cell maturation, function, and survival.Citation4 Atacicept is currently under investigation as a biotherapeutic in autoimmune diseases such as systemic lupus erythematosus (SLE).
The incorporation of an IgG Fc-domain in biopharmaceuticals endows several advantages. The predominant one lies in an increased serum half-life that results from the pH-dependent interaction with the neonatal Fc-receptor (FcRn), which limits the degradation of the Fc-fusion protein by exosomes.Citation5 Fusion with an Fc-domain also permits robust and efficient purification using protein-A affinity chromatographyCitation6 during both development and production. The complexity inherent to antibody-based proteins and their potential modifications drives the development of innovative analytical methods for a robust and detailed characterization.
Atacicept and most recombinant immunoglobulin G (IgG)-based therapeutics are complex glycoproteins. Glycosylation is the most complex post-translational modification, influencing PK/PD,Citation7 solubility,Citation8 higher-order structure, and stability,Citation5,Citation9,Citation10 as well as immunogenicity and effector functionsCitation11 of the protein. For these reasons, protein glycosylation is considered by regulatory agencies as a critical quality attribute (CQA), and it is essential to measure and control antibody glycosylation accurately and reliably. Manufacturers need to document detailed characterization for approval and lot release.Citation12,Citation13 Moreover, changes to the manufacturing process, be it over the course of clinical development or throughout the lifecycle of a therapeutic protein product, may affect the glycosylation profile or other quality attributes. Therefore, a comprehensive comparability is required in order to demonstrate equal or better quality of the post-change product.Citation14,Citation15
The glycosylation-related heterogeneity of proteins arises from the localization and occupancy of the glycosylation site(s) (macroheterogeneity), as well as the diversity of the glycan structures expressed on a specific site (microheterogeneity). In order to address both levels, glycopeptide-centered analysis currently represents the most straightforward methodology. This includes the characterization of N- or O-glycopeptides after proteolytic treatment and their analysis using liquid chromatography (LC)-mass spectrometry (MS) under different fragmentation regimes for unambiguous glycopeptide assignment.Citation16 Glycopeptide-centered approaches may be combined with released glycan analysis, in order to obtain more detailed glycan structural information.Citation17,Citation18 The analysis of intact glycoproteins provides complementary information on overall glycoform distributions and relative abundances of the corresponding proteoforms for comprehensive characterization.Citation19,Citation20 A comparison of glycan-, glycopeptide- and glycoprotein-based MS approaches has been recently shown for the analysis of IgG Fc-glycosylation.Citation21
Here, we present a detailed N- and O-glycosylation site characterization of two individual production batches of atacicept using a set of MS-based workflows, which may be also applied to a variety of other glycosylated biopharmaceutical products. In a first discovery approach, C18-porous graphitized carbon (PGC)-LC-electrospray ionization (ESI)-MS/MS of pronase-treated glycopeptides was applied using stepping-energy collision-induced dissociation (CID) and electron-transfer dissociation (ETD) for N- and O-glycopeptide identification. Second, a relative quantitation of the N-glycosylation site microheterogeneity was achieved by C18-LC-ESI-MS analysis of tryptic glycopeptides, as well as matrix-assisted laser desorption ionization (MALDI)-time of flight (TOF)-MS analysis of the released N-glycans after linkage-specific sialic acid derivatization. Relative quantitation of the O-glycan distribution was performed by analyzing the de-N-glycosylated protein species using capillary electrophoresis electrospray ionization (CESI)-MS.
Results
N- and O-glycosylation site identification of atacicept using C18-PGC-LC-ESI-MS/MS
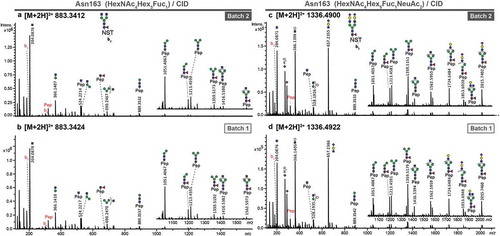
First, an exploratory site-specific approach was followed to obtain an overview of the glycosylation sites and the corresponding N- and O-glycoforms of atacicept. Samples from two different production batches were subjected to in-gel pronase treatment, resulting in glycopeptides with short peptide sequences. These glycopeptides were then analyzed by C18-PGC-LC-ESI-MS/MS operated in stepping-energy CID mode.Citation22,Citation23 This approach has been shown to be very useful for a variety of glycoproteins, in particular for O-glycosylation site identification.Citation18 Depending on the experimental conditions, most of the protein is trimmed, resulting in small peptides around the glycosylation site, which also allows detection of sites within regions that only have a few or no cleavage sites for standard proteases. A wide range of glycopeptides were detected using this approach (Supplementary Figure 1). All glycopeptides in the first part of the chromatogram (before 28 min) eluted from the C18 column, and accordingly glycopeptides present in the second part (after 28 min) eluted from the PGC column, combined in one data acquisition. The mass spectrometer was operated in stepping-energy CID mode to generate diagnostic glycan-derived B- and Y-ions, as well as peptide backbone b- and y-ions for unambiguous identification of glycan moiety and peptide sequence, respectively (). In most cases, glycopeptides were elucidated based on their MS/MS spectra. However, in case of particularly low intensities, compounds were identified on the MS level according to their exact mass (mass deviation <10 ppm), retention time and close relation in the N-glycan biosynthetic pathway (Supplementary Table S1 and S2).
Figure 1. Stepping-energy CID spectra of pronase-treated N-glycopeptides (covering glycosylation site Asn163) of atacicept with the peptide sequence 163NST165. Compounds with the same mass and retention time of two different production batches were compared featuring the same fragmentation pattern and thus, could be identified as the same structure. (a + b) Spectra of the glycopeptide carrying a diantennary core-fucosylated structure. (c + d) Spectra of the glycopeptide carrying a diantennary and disialylated core-fucosylated structure.
This analysis resulted in glycopeptides from the N-glycosylation site Asn163 and the two O-glycosylation sites Thr91 and Ser86 (Supplementary Table S1 and S2). The comparison of the glycopeptides from Batch1 and Batch2 shows almost identical retention times and masses, as well as similar intensities of the extracted ion chromatograms (Supplementary Table S1/S2 and Figure S2).
Characterization of N-glycosylation site Asn163
N-glycopeptides resulting from pronase treatment were detected with the peptide sequence 163NST165, 163NST165 with N-terminal acetylation and as a single asparagine. Acetylation most likely is an artifact of the sample preparation procedure, as reported before.Citation24 Since the glycoprotein contains only one N-glycosylation site, the single asparagine peptide portions can be assigned to glycosylation site Asn163. Both batches of atacicept were characterized to carry the very same repertoire of 47 N-glycan structures (, Supplementary Table S1 and S2). The three most intense N-glycopeptides after C18-PGC-LC-ESI-MS/MS analysis contained the peptide sequence 163NST165 with core-fucosylated di-antennary N-glycans (HexNAc4Hex3Fuc1, HexNAc4Hex4Fuc1, HexNAc4Hex5Fuc1) (Supplementary Figure 1A). In addition to masses and retention times of the glycopeptides, manual annotation of the MS/MS spectra revealed structural features and allowed us to confirm the identity of species between batches (, Supplementary Figure S3/S4). This was also confirmed for less abundant glycopeptides, such as 163NST165 with the glycan composition HexNAc4Hex5Fuc1NeuAc2 ().
Table 1. N-glycan compositions and proposed structures with retention times (RT) identified on N-glycosylation site Asn163 of atacicept. Samples were treated with pronase and glycopeptides were analyzed by C18-PGC-LC-ESI-MS/MS. Hex = white circle = hexose, HexNAc = N-acetylhexosamine, Fuc = red triangle = fucoses, NeuAc = purple diamond = N-acetylneuraminic acid, yellow circle = galactose, blue square = N-acetylglucosamine, green circle = mannose.
In total, this site carried 34 core fucosylated complex and hybrid species with different degrees of sialylation (non, mono- and desialylation). Two of these structures also carried an N-glycolylneuraminic acid. In addition, six non-core-fucosylated complex/hybrid-type glycans were present, next to seven oligomannose-type N-glycans.
In both batches, a set of glycopeptides eluting from PGC were detected at several retention times, indicating the presence of structural isomers (Supplementary Figure S5/6). However, MS/MS acquisition of the isomers was not achieved because their intensity was too low to be selected by auto MS/MS. Thus, their identification was based on accurate mass (, Supplementary Table S1/2). The oligomannose-type glycans HexNAc2Hex6 and HexNAc2Hex7 were both detected as two isomers with an ~2 min elution time difference in PGC-LC. The same could be observed for four tri-antennary glycopeptides HexNAc5Hex(3–6)Fuc1 that each elute from PGC as two isomers with a 1-min retention time difference. Additionally, four N-glycans with the composition HexNAc3Hex(3–6)Fuc1 could be separated in up to three peaks, pointing towards the presence of hybrid and monoantennary N-glycans (, Supplementary Table S1/2). Notably, a comparison of the intensities of the isomers relative to each other on the basis of the extracted ion chromatograms showed similarity between the two sample batches, except for HexNAc3Hex6Fuc1 (Supplementary Figure S5). While in Batch1 the earlier eluting peak of HexNAc3Hex6Fuc1 was lower than the second, in Batch2 it was contrariwise (Supplementary Figure S5).
All glycan compositions of N-glycosylation site Asn163, identified by the exploratory approach, were used for relative quantitation of the N-glycans in a site-specific manner. The samples of both batches were subjected to in-gel trypsin treatment and were then analyzed in triplicates using C18-RP-LC-ESI-MS. Trypsin treatment was used to generate homogeneous peptide backbones in order to minimize a potential bias in glycopeptide ionization efficiencies.Citation25 Since C18-RP-LC does not allow isomer separation for these glycopeptides, only glycan compositions were taken into account. Theoretical glycopeptides masses were calculated based on the glycoforms identified using C18-PGC-LC-ESI-MS/MS, attached to the tryptic peptide (160EEQYNSTYR167) and the missed-cleaved species (156TKPREEQYNSTYR167). The intensities of the tryptic glycopeptides were extracted in an automated fashion and used for relative quantitation based on the total peak intensity of the sample (, Supplementary Table S3). In total, 26 N-glycopeptides could be quantified in a relative manner for both batches. The remaining not quantified glycopeptides featured low signal intensities and did not match the quality criteria, including S/N ratio, for relative quantitation. Considering the relative intensities, both batches of the atacicept showed very similar profiles and the observed differences can be attributed to typical batch-to-batch variability. Approximately 77.2% for Batch1 and 72.6% for Batch2 are represented by three glycoforms (HexNAc4Hex3Fuc1, HexNAc4Hex4Fuc1, HexNAc4Hex5Fuc1). Another 13.6% in Batch1 and 10.8% in Batch2 are mono- or di-sialylated glycan structures, with small amounts of N-glycolylneuraminic acid (0.4% Batch1; 0.3% Batch2). Both batches are characterized by a high degree of fucosylation (95.5% Batch1, 90.6% Batch2), and smaller amounts of oligomannose-type glycans (3.4% Batch1 and 7.5% Batch2). The data are in line with the first results obtained using C18-PGC-LC-ESI-MS/MS.
Figure 2. Relative quantitation of N-glycoforms of atacicept. (a) Released N-glycans were analyzed by MALDI-TOF-MS after linkage-specific sialic acid derivatization. Peak intensities were normalized based on the total intensities of all N-glycans in a sample. Sialic acids (purple diamond) pointing to the right indicate α2,3-linkage. (b) Tryptic N-glycopeptides were analyzed by C18-RP-LC-MS, and peak intensities were normalized on the total peak intensity of all N-glycopeptides in a sample. Standard deviations are shown.
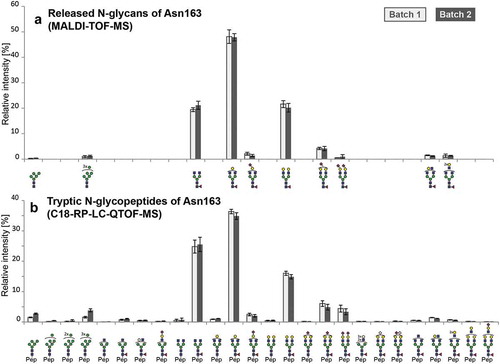
To also analyze the sample set with an orthogonal approach, N-glycans were released in-gel with PNGase F, followed by linkage-specific sialic acid derivatization using ethyl esterification of α2,6- and lactonization of α2,3-linked sialic acids.Citation26 The peak intensities of the glycan species were extracted in an automated mannerCitation27 and used for relative quantitation based on the total intensity of all glycan peaks in the sample (, Supplementary Table S3). In total, 10 N-glycans could be observed by MALDI-TOF-MS/MS. Linkage-specific sialic acid derivatization revealed the presence of α2,3-linked sialic acid. In accordance with the analysis on a tryptic glycopeptide level, the relative intensities of the released glycans are very similar for Batch1 and Batch2. The glycosylation pattern as obtained by both approaches is highly similar except for the not detected small intensity peaks below 1% relative abundance. However, a bias in the ratio of HexNAc4Hex3Fuc1 and HexNAc4Hex5Fuc1 is different in both analyses. While MALDI-TOF-MS resulted in almost equal amounts of HexNAc4Hex3Fuc1 and HexNAc4Hex5Fuc1 of approximately 20%, LC-MS analysis revealed almost 1.5 times as much HexNAc4Hex3Fuc1 as HexNAc4Hex5Fuc1.
Characterization of O-glycosylation sites Ser86 and Thr91
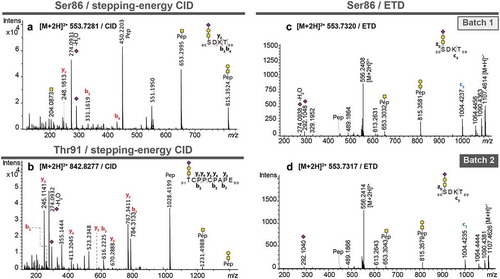
Two O-glycosylation sites were identified using the C18-PGC-LC-ESI-MS/MS approach. The peptide 86SDKT89 was found to carry a mono-sialylated trisaccharide (HexNAc1Hex1NeuAc1), indicating a core 1 structure in both sample batches, eluting at approximately 41 min from the PGC column (, Supplementary Table S1). Diagnostic glycan-derived B- and Y-ions, as well as b- and y-ions of the peptide backbone, allowed the glycopeptide structural assignment (). Since the peptide contains two potential O-glycosylation sites at Ser86 and Thr89, ETD was used as an orthogonal approach to support the unequivocal attribution of the glycosylation site (). The spectra of Batch1 and Batch2 contained a peak at m/z 1004.4235, corresponding to the c3-ion + HexNAc1Hex1NeuAc1 (). This provided evidence for glycosylation of Ser86. Also, ETD spectra showed an almost identical pattern for the two analyzed samples, further supporting that O-glycosylation site Ser86 is conserved in both batches. In addition, another O-glycosylation site was observed at Thr91, as shown for a monosialylated O-glycan (HexNAc1Hex1NeuAc1) attached to the peptide backbone 91TCPPCPAPE99 (). A disialylated glycopeptide (91TCPPCPAPE99+ HexNAc1Hex1NeuAc2) of the same glycosylation site was also observed for both Batch1 and Batch2. Both O-glycosylation sites were located in close proximity within the region of 86S*DKTHT*CPPCPAPE99 (* indicates O-glycosylation site).
Figure 3. MS/MS spectra of pronase-treated O-glycopeptides of atacicept. (a) Stepping-energy CID spectra of the O-glycopeptide 86SDKT89 covering glycosylation site Ser86 with a monosialylated core 1-type glycan. (b) Stepping-energy CID spectra of the O-glycopeptide 91TCPPCPAPE99 covering the glycosylation site Thr91 with a monosialylated core 1-type glycan. (c + d) ETD spectra of the O-glycopeptide 86SDKT89 covering glycosylation site Ser86 carrying a monosialylated core 1-type glycan from two different production batches. Compounds with the same mass and retention time from two different production batches were compared featuring the same fragmentation pattern and thus, could be identified as the same glycopeptides.
For relative quantitation of the site-specific O-glycan distribution, tryptic glycopeptides were analyzed, resulting in identification of the un- and glycosylated (HexNAc1Hex1NeuAc1) peptide containing Ser86 (85SSDK88), as well as the unglycosylated peptides comprising Thr91 (89THTCPPCPAPEAEGAPSVFFLFPPKPK115). The missed-cleaved peptide species containing both O-glycosylation sites (Ser85-Lys115) was detected as unglycosylated and singly glycosylated peptide carrying a HexNAc1Hex1NeuAc1 O-glycan. However, treating the protein with the protease AspN, which leads to cleavage at Asp between Ser86 and Thr91, resulted in detection of the Thr91-containing peptide (87DKTHTCPPCPAPEAEGAPSVFFLFPPKPK115) with two different glycoforms attached (HexNac1Hex1NeuAc1, HexNac1Hex1NeuAc2) and of Ser86-containing peptide only as unglycosylated peptide species (55DCISCASICGQHPKQCAYFCENKLRSEPKSS86). These observations suggest that the close vicinity of the two O-glycosylation sites may lead to partial masking of the proteolytic cleavage site between them, depending on the occupation of the glycosylation sites. Thus, relative quantitation on a glycopeptide level was not successful for atacicept.
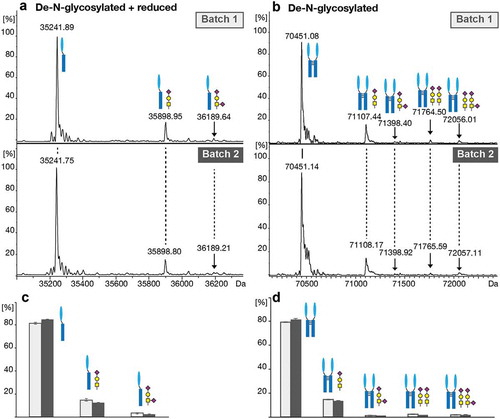
To overcome this proteolytic bias, the de-N-glycosylated intact proteoforms of atacicept were analyzed by CESI-MS (). The de-N-glycosylated and reduced monomeric protein () was detected as non-glycosylated form as well as with O-glycans of composition HexNAc1Hex1NeuAc1 (Batch1, 14.9% relative abundance; Batch2, 12.5%) and HexNAc1Hex1NeuAc2 (Batch1, 3.3%; Batch2, 2.4%). In addition, the de-N-glycosylated dimeric protein species was analyzed (). While most of the protein dimers were found to be not O-glycosylated, ~15% (16.1% for Batch1 and 14.7% for Batch2) carried one and ~4% (4.4% for Batch1 and 3.5% for Batch2) were found to carry two core 1 O-glycans with one or two sialic acids.
Figure 4. O-glycosylation analysis of the de-N-glycosylated intact protein using CESI-MS. (a) Deconvoluted spectra of the monomeric reduced de-N-glycosylated protein species. (b) Deconvoluted spectra of the dimeric de-N-glycosylated protein species. (c) Relative quantitation of the unglycosylated and O-glycosylated monomeric and (d) dimeric protein based on triplicate analysis. Standard deviations are shown.
Discussion
Here, we describe a comprehensive N- and O-glycosylation site characterization of the Fc-fusion protein atacicept using a panel of mass spectrometric approaches. The single putative N-glycosylation site was confirmed as carrying 47 glycoforms from 34 different compositions, with relative abundance as low as 1%. In addition, two O-glycosylation sites with core 1-type glycans were identified and characterized.
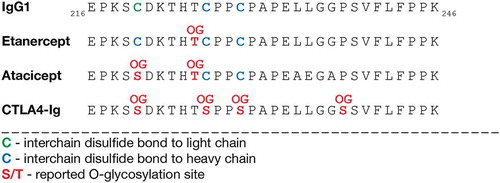
Most Fc-fusion proteins are fused to the Fc part of IgG1, comprising a hinge region, CH2- and CH3-domain. While hinge region O-glycosylation has not been reported for IgG1, we identified it for atacicept, and it has further been reported for the IgG1 Fc-fusion proteins etanerceptCitation28,Citation29 and CTLA4-Ig.Citation30 Considering the protein sequences of the hinge region and the N-terminal part of the CH2-domain, there are differences in a few amino acids and in disulfide bond formation, which might influence O-glycosylation (). The amino acid numbering by Edelman et al.Citation31 was used for the following comparison. Cys220 in IgG1 forms a disulfide bond with the light chain and both Cys226 and Cys229 form interchain disulfide bonds with the heavy chain. Etanercept has the same sequence in this region, but the first cysteine forms an interchain disulfide bond with the heavy chain instead of light chain. Consequently, the threonine corresponding to Thr225 in IgG1 has been shown to be O-glycosylated ().Citation28,Citation29 This indicates that the interchain connection with the light chain and the resulting three-dimensional structure of IgG1 might hinder GalNAc-transferases (GalNAc-Ts) from acting on Thr225. In atacicept, the first cysteine in this region was changed to a serine (corresponding to Ser86 in our study), which was found to be O-glycosylated next to Thr225 (corresponding to Thr91 in our study). Lastly, in CTLA4-Ig, all three cysteines in this region, next to a proline corresponding to Pro238 in IgG1 were changed to serines, and they all have been reported to be O-glycosylated ().Citation30 However, the threonine corresponding to Thr225 in IgG1 remained unglycosylated, suggesting that the two neighboring serines are preferred substrates for GalNAc-Ts. In line with our findings also, etanercept and CTLA4-Ig carry mono- and disialylated core 1 O-glycans.
Figure 5. Hinge region O-glycosylation of IgG1 Fc-fusion proteins. A part of the hinge region and CH2-domain sequences of IgG1 and the Fc-fusion proteins etanercept, atacicept and CTLA4-Ig are shown. Disulfide bonds and reported O-glycosylation sites for etanercept,Citation28,Citation29 CTLA4-IgCitation30 and atacicept are highlighted. Amino acid numbering by Edelman et al.Citation31 OG, O-glycan.
C18-PGC-LC-ESI-MS/MS of pronase-treated glycopeptides was shown to be particularly useful for O-glycopeptide analysis,Citation22 as recently demonstrated for the in-depth characterization of the heavily O-glycosylated human C1-Inhibitor.Citation18 Here, the combined LC setup enabled their detection, with O-glycopeptides of the glycosylation site Ser86 being only retained by PGC-LC and O-glycopeptides featuring Thr91 by C18-RP-LC. The incorporated PGC-LC also resulted in several elution peaks for some N-glycopeptides, suggesting the presence of glycan isomers. This is not surprising considering that PGC as a stationary phase is well known to separate structural and linkage isomers of glycans.Citation32–Citation35 The chromatographic separation allowed individual detection and estimation of the relative abundance of each isomer for a comparison of both batches. In that way, the analysis of Batch1 and Batch2 showed largely similar distribution of the isomeric compounds.
MALDI-TOF-MS was used as an alternative method for N-glycan relative quantitation. Glycoforms with a lower abundance, e.g., less than 1% relative intensity of the glycopeptides, could not be reliably detected. However, it was used as an orthogonal approach for sample profiling with potential application in high-throughput mode.Citation26 We observed a shift in relative abundance of HexNAc4Hex3Fuc1 to HexNAc4Hex4Fuc1 to HexNAc4Hex5Fuc1 in MALDI-TOF-MS compared to LC-ESI-MS. One of the possible explanations we propose for this shift relates to the additional hydrophilic interaction liquid chromatography (HILIC) clean-up step we performed of the released N-glycans prior MALDI-TOF-MS analysis.
Linkage-specific sialic acid derivatization of the released N-glycans revealed only α2,3-linked NeuAc present on N-glycopeptides. This is in line with the fact that atacicept is produced in Chinese hamster ovary (CHO) cells, which are known to produce only α2,3-linked NeuAc.Citation36 Also, small amounts of N-glycans (less than 0.5%) appeared to carry N-glycolylneuraminic acid, which is a byproduct of the recombinant expression in CHO cells. However, due to low abundance of these species, the glycan composition could not be confirmed by tandem mass spectrometry, and assignment is largely based on accurate mass.
As part of quality control, regulatory agencies require documentation and characterization of the glycosylation profile for approval as well as lot release of biopharmaceuticals.Citation12,Citation13 Here, two different production batches were analyzed to investigate to what extend their glycosylation profile match. MS/MS spectra comparison of compounds with the same mass and retention time revealed identical N- and O-glycan structures attached to the peptide. Spectral matching is frequently used in metabolomicsCitation37 and proteomicsCitation38 investigations and could be of particular interest in batch comparison referring to a library containing N- and O-glycopeptide spectra of the reference batch.Citation39 The comparison of the relative glycoforms distribution by LC-ESI-MS and MALDI-TOF-MS also resulted in highly similar results for both batches within the chosen analytical method. Overall, based on the results of the two batches in terms of glycan species present and in terms of relative abundance, the batches are highly similar and can be considered comparable. The slight differences observed in relative abundance can be attributed to typical batch-to-batch variability.
Methods and materials
Materials
The Fc-fusion protein atacicept was provided by Merck Serono (Rome, Italy). Pronase (Streptomyces griseus) was purchased from Sigma-Aldrich (St. Louis, MO), porcine trypsin in sequencing grade from Promega (Madison, WI) and PNGase F (Flavobacterium meningosepticum, recombinant from E. coli) from Roche Diagnostics (Mannheim, Germany). HPLC supraGradient Acetonitrile (ACN) was obtained from Biosolve (Valkenwaard, The Netherlands). All other chemicals were obtained in high-grade quality from Sigma-Aldrich. NuPAGE® Novex® 4–12% Bis-Tris gels, NuPAGE® MES SDS Running Buffer (20X) and SimplyBlue™ SafeStain were from Life Technologies (Carlsbad, CA).
Methods
In-gel protease treatment for glycopeptide analysis
Ten micrograms of fusion protein, dissolved in water, were mixed 3:1 with 4x Laemmli sample buffer (8% (w/v) SDS, 0.25 M Tris-HCl pH 6.8, 40% (w/v) glycerol, 5% 2-mercaptoethanol, bromophenol blue in water (stored at −20°C)Citation40) and incubated for 10 min at 70°C. The sample was subjected to SDS-PAGE, followed by in-gel reduction, alkylation and protease treatment as described recently.Citation22 For protease treatment 30 µl digestion buffer, containing either pronase in a ratio of 1:3 (enzyme:protein), or 5 ng/µl trypsin in 25 mM ammonium bicarbonate, were added to the dry gel pieces and incubated on ice for 45 min to swell the gel pieces, before incubation at 37°C overnight. Next, the supernatant was removed and another 30 µl of 25 mM ammonium bicarbonate were added and incubated for 1 h on a shaker. After removing and combining the supernatants the sample was stored at −20°C.
LC-MS analysis of glycopeptides
LC-MS/MS analysis was performed using an Ultimate 3000 × 2 dual analytical nanoUPLC system (Thermo Scientific, Breda, The Netherlands) coupled online to a maXis HD QTOF mass spectrometer via a captiveSpray ion source and nanoBooster (both Bruker, Bremen, Germany). The LC-MS setup was controlled using Hystar 3.2 (Bruker).
C18-PGC-LC-ESI-MS/MS analysis of glycopeptides
Three µl sample (~40 ng) after pronase treatment were subjected to C18-PGC-LC-ESI-MS/MS analysis. The sequential LC setup and gradient conditions were as described recently.Citation22 Modified from the protocol, the loading buffer consisted of 0.1% formic acid (FA) in water. Briefly, the two valve nanoUPLC system was equipped for valve 1 with a C18 precolumn (C18 pepMap 100, 300 µm ID x 5 mm, 5 µm, 100 Å, Thermo Scientific, Breda, The Netherlands) and an analytical column (Acclaim Pepmap RSLC, 75 µm ID × 150 mm, 2 µm, 100 Å, Thermo Scientific) and for valve 2 with PGC precolumn (in-house made, 100 µm ID × 15 mm, 3 µm Hypercarb material, Thermo Scientific) and analytical nanoflow column (in-house made, 50 µm ID × 150 mm, 3 µm, Hypercarb material, Thermo Scientific). The column oven temperature was held at 36°C. During sample loading, both precolumns were connected; therefore, samples were loaded with 6 µl/min for 6 min onto the C18 precolumn and the flow-through transferred directly to the PGC precolumn. Compounds retained on the different precolumns were eluted to the respective analytical column. A nano valve was used to sequentially direct the flow from each analytical column to the MS outlet (C18 outlet flow from 0 to 28 min and PGC outlet flow from 28 to 70 min). Mobile phases used were the same for both separation columns: solvent A (water containing 0.1% FA (v/v)) and B (80% ACN/20% water containing 0.1% FA (v/v)). The compounds were eluted from the C18 columns with 500 nl/min using a linear gradient from 1% to 55% solvent B from 5 to 35 min and elution from the PGC columns was achieved with a linear gradient from 1% to 40% solvent B from 22 to 55 min at a flow rate of 400 nl/min. The mass spectrometer was operated in stepping-energy CID mode, after optimization of the collision energies.Citation23 MS and MS/MS parameters were set as follows:Citation41 The CaptiveSpray with a capillary voltage of 1350 V was operated with a nanoBooster and ACN-enriched gas (0.2 bar) at 3 l/min at a dry gas temperature of 150°C. MS spectra were acquired within a mass range of m/z 50–2800 at a spectra rate of 1 Hz. The collision RF was set to 500 and 1300 Vpp in basic stepping mode (each 50% of the time). For MS/MS basic stepping mode was applied with 100–50% collision energy each 80% and 20% of the time, respectively. Absolute collision energies were set as a linear curve in an m/z-dependent manner ranging from 55 eV at m/z 700 to 124 eV at m/z 1800, for all charge states. MS/MS spectra were generated from the three most abundant precursors with an isolation width of 8–10 Da depending on m/z-values and a spectra rate of 0.5 to 2 Hz dependent upon precursor intensity.
For ETD experiments, the MS parameters were set as described above for stepping-energy CID, except of the collision RF, which was set to 500 and 800 Vpp in basic stepping mode (each 50% of the time). 3,4-hexanedione was used to form reagent radical ions. The acquisition of ETD spectra was performed in a targeted manner using an inclusion list for auto MS/MS. The parameters were set as followed: The ICC target was set to 2,000,000 for an accumulation time of max 350 ms. The reagent injection was 120 ms and the reaction time 40 ms.
C18-RP-LC-ESI-MS analysis of (glyco)peptides
Approximately 40 ng of trypsin-treated sample were used for C18-RP-LC-ESI-MS analysis. The samples were loaded onto a C18 μ-precolumn (C18 PepMap 100, 300 μm ID x 5 mm, 5 μm, 100 Å, Thermo Scientific) with loading solvent (water containing 0.1% FA (v/v)) at a flow rate of 10 μl/min for 4 min. Separation was achieved on a C18 analytical column (Acclaim PepMap RSLC, 75 μm ID × 15 cm, 2 μm, 100 Å, Thermo Scientific) at 45°C column oven temperature and a solvent system containing solvent A (water containing 0.1% FA (v/v)) and solvent B (80% ACN/20% water containing 0.1% FA (v/v)). Tryptic (glyco)peptides were eluted using a linear gradient of 1%–53.5% solvent B in 31.5 min at a flow rate of 500 nl/min followed by column washing and reconditioning.
The mass spectrometer was operated as described above for stepping-energy CID, and, for relative quantitation, no tandem MS spectra were acquired.
Data analysis of glycopeptides
Manual identification of glycopeptides based on their accurate mass and MS/MS fragmentation spectra were performed as described recently.Citation22 For relative quantitation signal intensities of all tryptic (EEQYNSTYR) and missed-cleaved glycopeptides (TKPREEQYNSTYR) were extracted in an automated manner using LaCy tools (Version 1.0).Citation42 The analyte list was curated based on manual data analysis. LaCy tools settings were as followed: sum spectrum resolution = 100; mass window 0.07 Th; time window 18 s; minimum portion of the total theoretical isotopic distribution extracted = 95%, background window = 10 Th. For relative quantitation analytes were included according to the following criteria: signal-to-noise of at least 9; average mass error of between ±20 ppm, average isotopic pattern quality score ≤ 0.25. The samples were analyzed in triplicates. The data were normalized based on the total intensity of all compounds and the standard deviation was calculated.
In-gel PNgase F N-glycan release for linkage-specific sialic acid derivatization
In-gel treatment with PNGase F was performed in triplicates similar to the in-gel protease treatment with some modifications. Twenty-five mM ammonium bicarbonate was replaced during the whole procedure by 25 mM sodium bicarbonate. For PNGase F treatment, 30 µl digestion buffer, containing 2U PNGase F in 2% NP-40/1 x PBS, were added to the dry gel pieces and incubated on ice for 45 min to swell the gel pieces, before incubation at 37°C overnight. Next, the supernatant was removed and another 20 µl of water was added and incubated for 30 min in a sonication bath. The supernatant was again removed, combined with the first one and stored at −20°C before use.
Linkage-specific sialic acid derivatization and HILIC purification of the released N-glycans
Five µl of the released glycans were derivatized by ethyl esterification, resulting in linkage-specific sialic acid detection with ethyl esterification of α2,6-linked and lactonization of α2,3-linked species.Citation26 After derivatization, glycans were purified with an adjusted version of HILIC purification:Citation43 five µl of the derivatized glycan sample (67.6% ACN, 27% ethanol) were loaded by pipetting 20 times up and down onto cotton HILIC tips. The cotton tips were then washed by pipetting three times 20 µL 85% ACN/1% trifluoroacetic acid and three times 20 μL 85% ACN, followed by elution of the glycans with 10 µL water.
MALDI-TOF-MS analysis of released N-glycans after linkage-specific sialic acid derivatization
Three µl of the samples were then spotted on an MTPAnchorChip 800/384 TF MALDI plate together with 1 μl super-DHB (5 mg/ml; Sigma-Aldrich) in 50% ACN containing 1 mM NaOH. The released, derivatized and purified N-glycans were analyzed in reflectron positive mode on an UltrafleXtreme MALDI-TOF-MS with a Smartbeam-II laser (Bruker Daltonics), controlled by flexControl 3.4 (Build 135; Bruker Daltonics).Citation26 For each sample, 10000 shots were acquired with 1000 Hz within a window of m/z 1000 to 5000.
Data analysis of released N-glycans after linkage-specific sialic acid derivatization
The raw spectra were exported from flexAnalysis 3.4 (Build 76; Bruker Daltonics) as text file (x,y). Data extraction was performed in an automated manner using MassyTools (version 0.1.8.0), as described recently.Citation27 Intensities of the sodiated glycan peaks [M+ Na]+ were extracted, and relative quantitation was performed on the areas and normalized to the sum of all areas within a sample.
Sample preparation and CESI-MS analysis of de-N-glycosylated and reduced/de-N-glycosylated protein
The samples were de-N-glycosylated by adding 100 μl 50 mM TRIS-HCl pH 8.0 buffer and 5 μl PNGase F to 100 μl of sample, followed by 18 h incubation at 37°C. Sixty μl of the sample were kept for CESI-MS analysis whereas the other 40 μl of deglycosylated sample were reduced by adding 10 μl of DTT (final concentration 200 mM) and 30 min incubation 60°C. Both samples were buffer exchanged to 100 mM ammonium acetate pH 3.0 using 10KDa spin filters (Vivaspin, GE Healthcare) prior analysis.
Sheathless integrated CESI was carried out on a CESI 8000 instrument (Sciex, Brea, CA) coupled to an Impact qTOF mass spectrometer (Bruker Daltonics) equipped with a nano-electrospray source. CESI-MS of atacicept samples was performed using polyethylenimine-coated capillaries. The coating procedure was performed according to the supplier specifications.Citation44 Ten percent acetic acid was employed as background electrolyte and separation was performed at 20°C by applying −20 kV. The mass spectrometer was operated in positive ionization mode using the following parameters: capillary voltage 1200 V, drying gas temperature 120°C, drying gas flow rate 2 L/min. Mass spectra were collected in profile mode using a mass range of m/z 500 to m/z 5000. MS control and data acquisition and analysis were performed using QTOF control and data analysis software (Bruker Daltonics).
Data analysis of de-N-glycosylated and reduced/de-N-glycosylated protein
Molecular mass determinations were performed using the ‘Maximum Entropy’ algorithm of the DataAnalysis software. Relative quantification was performed over the averaged deconvoluted mass spectra of the full peak using the relative signal intensities of the different species. The samples were analyzed in triplicates.
Competing financial interests
AP, FG, WP, and HB are employed by Merck. We are not aware of any further conflicts of interest.
Supplemental Material
Download Zip (2.7 MB)Acknowledgments
This project was supported by the European Union (Seventh Framework Programme HighGlycan project, grant number: 278535)
Supplementary Material
Supplemental data for this article can be accessed on the publisher’s website.
Related Research Data
References
- Kaplon H, Reichert JM. Antibodies to watch in 2019. MAbs. 2019;11:219–38. doi:10.1080/19420862.2018.1556465.
- Hay M, Thomas DW, Craighead JL, Economides C, Rosenthal J. Clinical development success rates for investigational drugs. Nat Biotechnol. 2014;32:40–51. doi:10.1038/nbt.2786.
- Gross JA, Johnston J, Mudri S, Enselman R, Dillon SR, Madden K, Xu W, Parrish-Novak J, Foster D, Lofton-Day C, et al. TACI and BCMA are receptors for a TNF homologue implicated in B-cell autoimmune disease. Nature. 2000;404:995–99. doi:10.1038/35010115.
- Hartung H-P, Kieseier BC. Atacicept: targeting B cells in multiple sclerosis. Ther Adv Neurol Disord. 2010;3:205–16. doi:10.1177/1756285610371146.
- Suzuki T, Ishii-Watabe A, Tada M, Kobayashi T, Kanayasu-Toyoda T, Kawanishi T, Yamaguchi T. Importance of neonatal FcR in regulating the serum half-life of therapeutic proteins containing the Fc domain of human IgG1: a comparative study of the affinity of monoclonal antibodies and Fc-fusion proteins to human neonatal FcR. J Immunol. 2010;184:1968–76. doi:10.4049/jimmunol.0903296.
- Shukla AA, Hubbard B, Tressel T, Guhan S, Low D. Downstream processing of monoclonal antibodies-Application of platform approaches. J Chromatogr B Anal Technol Biomed Life Sci. 2007;848:28–39. doi:10.1016/j.jchromb.2006.09.026.
- Liu L. Antibody glycosylation and its impact on the pharmacokinetics and pharmacodynamics of monoclonal antibodies and Fc-fusion proteins. J Pharm Sci. 2015;104:1866–84. doi:10.1002/jps.24444.
- Carter PJ. Introduction to current and future protein therapeutics: A protein engineering perspective. Exp Cell Res. 2011;317:1261–69. doi:10.1016/j.yexcr.2011.02.013.
- Zheng K, Bantog C, Bayer R. The impact of glycosylation on monoclonal antibody conformation and stability. MAbs. 2011;3:37–41. doi:10.4161/mabs.3.6.17922.
- Arnold JN, Wormald MR, Sim RB, Rudd PM, Dwek RA. The impact of glycosylation on the biological function and structure of human immunoglobulins. Annu Rev Immunol. 2007;25:21–50. doi:10.1146/annurev.immunol.25.022106.141702.
- Raju TS. Terminal sugars of Fc glycans influence antibody effector functions of IgGs. Curr Opin Immunol. 2008;20:471–78. doi:10.1016/j.coi.2008.06.007.
- Hossler P, Khattak SF, Li ZJ. Optimal and consistent protein glycosylation in mammalian cell culture. Glycobiology. 2009;19:936–49. doi:10.1093/glycob/cwp079.
- WHO. Guidelines on the quality, safety and efficacy of biotherapeutic protein products prepared by recombinant DNA technology. No 987, Annex 4; Switzerland: WHO Press; 2013.
- Zhang L, Luo S, Zhang B. Glycan analysis of therapeutic glycoproteins. MAbs. 2016;8:205–15. doi:10.1080/19420862.2015.1117719.
- Higgins E. Carbohydrate analysis throughout the development of a protein therapeutic. Glycoconj J. 2010;27:211–25. doi:10.1007/s10719-009-9261-x.
- Thaysen-Andersen M, Packer NH. Advances in LC-MS/MS-based glycoproteomics: getting closer to system-wide site-specific mapping of the N- and O-glycoproteomes. Biochim Biophys Acta. 2014;1844:1437–52. doi:10.1016/j.bbapap.2014.05.002.
- Parker BL, Thaysen-Andersen M, Solis N, Scott NE, Larsen MR, Graham ME, Packer NH, Cordwell SJ. Site-specific glycan-peptide analysis for determination of N-glycoproteome heterogeneity. J Proteome Res. 2013;12:5791–800. doi:10.1021/pr400783j.
- Stavenhagen K, Kayili HM, Holst S, Koeleman C, Engel R, Wouters D, Zeerleder S, Salih B, Wuhrer M. N- and O-glycosylation analysis of human C1-inhibitor reveals extensive mucin-type O-glycosylation. Mol Cell Proteomics. 2017;17:1225–38. doi:10.1074/mcp.RA117.000240.
- Čaval T, Tian W, Yang Z, Clausen H, Heck AJR. Direct quality control of glycoengineered erythropoietin variants. Nat Commun. 2018. doi:10.1038/s41467-018-05536-3.
- Wohlschlager T, Scheffler K, Forstenlehner IC, Skala W, Senn S, Damoc E, Holzmann J, Huber CG. Native mass spectrometry combined with enzymatic dissection unravels glycoform heterogeneity of biopharmaceuticals. Nat Commun. 2018;9:1–9. doi:10.1038/s41467-018-04061-7.
- Reusch D, Haberger M, Falck D, Peter B, Maier B, Gassner J, Hook M, Wagner K, Bonnington L, Bulau P, et al. Comparison of methods for the analysis of therapeutic immunoglobulin G Fc-glycosylation profiles-part 2: mass spectrometric methods. MAbs. 2015;7:732–42. doi:10.1080/19420862.2015.1045173.
- Stavenhagen K, Plomp R, Wuhrer M. Site-specific protein N- and O-glycosylation analysis by a C18-porous graphitized carbon-liquid chromatography-electrospray ionization mass spectrometry approach using Pronase treated glycopeptides. Anal Chem. 2015;87:11691–99. doi:10.1021/acs.analchem.5b02366.
- Hinneburg H, Stavenhagen K, Schweiger-Hufnagel U, Pengelley S, Jabs W, Seeberger PH, Silva DV, Wuhrer M, Kolarich D. The art of destruction: optimizing collision energies in quadrupole-time of flight (Q-TOF) Instruments for glycopeptide-based glycoproteomics. J Am Soc Mass Spectrom. 2016;27:507–19. doi:10.1007/s13361-015-1308-6.
- Plomp R, Dekkers G, Rombouts Y, Visser R, Koeleman CAM, Kammeijer GSM, Jansen BC, Rispens T, Hensbergen PJ, Vidarsson G, et al. Hinge-region O-glycosylation of human immunoglobulin G3 (IgG3). Mol Cell Proteomics. 2015;14:1373–84. doi:10.1074/mcp.M114.047381.
- Stavenhagen K, Hinneburg H, Thaysen-Andersen M, Hartmann L, Silva DV, Fuchser J, Kaspar S, Rapp E, Seeberger PH, Kolarich D. Quantitative mapping of glycoprotein micro-heterogeneity and macro-heterogeneity: an evaluation of mass spectrometry signal strengths using synthetic peptides and glycopeptides. J Mass Spectrom. 2013;48:627–39. doi:10.1002/jms.3210.
- Reiding KR, Blank D, Kuijper DM, Deelder AM, Wuhrer M. High-throughput profiling of protein N-glycosylation by MALDI-TOF-MS employing linkage-specific sialic acid esterification. Anal Chem. 2014;86:5784–93. doi:10.1021/ac500335t.
- Jansen BC, Reiding KR, Bondt A, Hipgrave Ederveen AL, Palmblad M, Falck D, Wuhrer M. MassyTools: a high-throughput targeted data processing tool for relative quantitation and quality control developed for glycomic and glycoproteomic MALDI-MS. J Proteome Res. 2015;14:5088–98. doi:10.1021/acs.jproteome.5b00658.
- Houel S, Hilliard M, Yu YQ, McLoughlin N, Martin SM, Rudd PM, Williams JP, Chen W. N- and O-glycosylation analysis of etanercept using liquid chromatography and quadrupole time-of-flight mass spectrometry equipped with electron-transfer dissociation functionality. Anal Chem. 2014;86:576–84. doi:10.1021/ac402726h.
- Montacir O, Montacir H, Springer A, Hinderlich S, Mahboudi F, Saadati A, Parr MK. Physicochemical characterization, glycosylation pattern and biosimilarity assessment of the fusion protein etanercept. Protein J. 2018;37:164–79. doi:10.1007/s10930-018-9757-y.
- Zhu L, Guo Q, Guo H, Liu T, Zheng Y, Gu P, Chen X, Wang H, Hou S, Guo Y. Versatile characterization of glycosylation modification in CTLA4-Ig fusion proteins by liquid chromatography-mass spectrometry. MAbs. 2014;6:1474–85. doi:10.4161/mabs.36313.
- Edelman GM, Cunningham BA, Gall WE, Gottlieb PD, Rutishauser U, Waxdal MJ. The covalent structure of an entire gammaG immunoglobulin molecule. Proc Natl Acad Sci U S A. 1969;63:78–85. doi:10.1073/pnas.63.1.78.
- Kolarich D, Windwarder M, Alagesan K, Altmann F. Isomer-specific analysis of released n-glycans by lc-esi ms/ms with porous graphitized carbon. In: Castilho A, editor. Methods Mol. Biol. New York, NY: Springer Science+Business Media; 2015. p. 427–35.
- Pabst M, Bondili JS, Stadlmann J, Mach L, Altmann F. Mass + retention time = structure: a strategy for the analysis of N-glycans by carbon LC-ESI-MS and its application to fibrin N-glycans. Anal Chem. 2007;79:5051–57. doi:10.1021/ac070363i.
- Everest-Dass AV, Jin D, Thaysen-Andersen M, Nevalainen H, Kolarich D, Packer N. Comparative structural analysis of the glycosylation of salivary and buccal cell proteins: innate protection against infection by Candida albicans. Glycobiology. 2012;22:1465–79. doi:10.1093/glycob/cws112.
- Issa SMA, Moran AP, Ustinov SN, Lin J-H-H, Ligtenberg AJ, Karlsson NG. O-linked oligosaccharides from salivary agglutinin: helicobacter pylori binding sialyl-Lewis x and Lewis b are terminating moieties on hyperfucosylated oligo-N-acetyllactosamine. Glycobiology. 2010;20:1046–57. doi:10.1093/glycob/cwq066.
- Takeuchisq M, Miyazakis H, Katos T, Hoshis S, Kochibel N. Comparative study of the asparagine-linked sugar chains of human erythropoietins purified from urine and the culture medium of recombinant Chinese hamster ovary cells. J Biol Chem. 1988;263:3657–63.
- Neumann S, Böcker S. Computational mass spectrometry for metabolomics: identification of metabolites and small molecules. Anal Bioanal Chem. 2010;398:2779–88. doi:10.1007/s00216-010-4142-5.
- Lam H, Aebersold R. Building and searching tandem mass (MS/MS) spectral libraries for peptide identification in proteomics. Methods. 2011;54:424–31. doi:10.1016/j.ymeth.2011.01.007.
- Liu Y, Chen J, Sethi A, Li QK, Chen L, Collins B, Gillet LC, Wollscheid B, Zhang H, Aebersold R. Glycoproteomic analysis of prostate cancer tissues by SWATH mass spectrometry discovers N-acylethanolamine acid amidase and protein tyrosine kinase 7 as signatures for tumor aggressiveness. Mol Cell Proteomics. 2014;13:1753–68. doi:10.1074/mcp.M114.038273.
- Laemmli UK. Cleavage of structural proteins during the assembly of the head of bacteriophage T4. Nature. 1970;227:680–85. doi:10.1038/227680a0.
- Stavenhagen K, Hinneburg H, Kolarich D, Wuhrer M. Site-specific N- and O-glycopeptide analysis using an integrated C18-PGC-LC-ESI-QTOF-MS-MS approach. In: Lauc G, Wuhrer M, editors. High-throughput glycomics glycoproteomics methods protoc. New York: Springer New York; 2017. p. 109–19.
- Jansen BC, Falck D, de Haan N, Hipgrave Ederveen AL, Razdorov G, Lauc G, Wuhrer M. LaCyTools – a targeted LC-MS data processing package for relative quantitation of glycopeptides. J Proteome Res. 2016;15:2198–210. doi:10.1021/acs.jproteome.6b00171.
- Selman MHJ, Hemayatkar M, Deelder AM, Wuhrer M. Cotton HILIC SPE microtips for microscale purification and enrichment of glycans and glycopeptides. Anal Chem. 2011;83:2492–99. doi:10.1021/ac1027116.
- Santos MR, Ratnayake CK, Fonslow B, Guttman A. A covalent, cationic polymer coating method for the CESI-MS analysis of intact proteins and polypeptides. Sciex - Bomarkers Omi. 2015; RUO-MKT-18-2325-A.