
ABSTRACT
vc-MMAE antibody–drug conjugates (ADCs) consist of a monoclonal antibody (mAb) covalently bound with a potent anti-mitotic toxin (MMAE) through a protease-labile valine-citrulline (vc) linker. The objective of this study was to characterize the pharmacokinetics (PK) and explore exposure–response relationships of eight vc-MMAE ADCs, against different targets and for diverse tumor indications, using data from eight first-in-human Phase 1 studies. PK parameters of the three analytes, namely antibody-conjugated MMAE (acMMAE), total antibody, and unconjugated MMAE, were estimated using non-compartmental approaches and compared across the eight vc-MMAE ADCs. Relationships between analytes were assessed by linear regression. Exposure–response relationships were explored with key efficacy (objective response rate) and safety (Grade 2+ peripheral neuropathy) endpoints. PK profiles of acMMAE, total antibody and unconjugated MMAE following the first dose of 2.4 mg/kg were comparable across the eight ADCs; the exposure differences between molecules were small relative to the inter-subject variability. acMMAE exposure was strongly correlated with total antibody exposure for all the eight ADCs, but such correlation was less evident between acMMAE and unconjugated MMAE exposure. For multiple ADCs evaluated, efficacy and safety endpoints appeared to correlate well with acMMAE exposure, but not with unconjugated MMAE over the doses tested. PK of vc-MMAE ADCs was well characterized and demonstrated remarkable similarity at 2.4 mg/kg across the eight ADCs. Results from analyte correlation and exposure–response relationship analyses suggest that measurement of acMMAE analyte alone might be adequate for vc-MMAE ADCs to support the clinical pharmacology strategy used during late-stage clinical development.
Introduction
Antibody–drug conjugates (ADCs) are a novel class of therapeutic agents consisting of a monoclonal antibody (mAb) covalently bound with a cytotoxic drug through a chemical linker. The mAb preferentially targets cell surface antigens overexpressed in tumor cells. Upon binding, the ADC is internalized by the tumor cell, where it undergoes lysosomal degradation, leading to the release of the cytotoxic drug. The use of targeted delivery of highly potent cytotoxic drugs is designed to enhance the antitumor activity while minimizing the toxicity in normal tissues. Additionally, this therapeutic approach takes advantage of the favorable pharmacokinetic (PK) properties of the antibody to provide a sustained delivery of the cytotoxic drug.
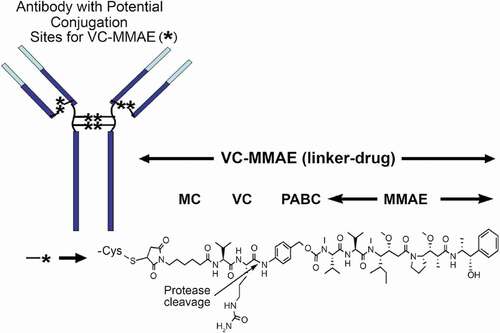
Many ADCs in clinical development use a protease-labile dipeptide linker (valine-citrulline [vc]), conjugated to monomethyl auristatin E (MMAE) via solvent-accessible thiols present in mAb cysteines (vc-MMAE ADC).Citation1 A representative structure of a vc-MMAE ADC is shown in .Citation2 Conjugation through reduced inter-chain disulfide cysteine residues results in a heterogeneous mixture of conjugated antibodies, with even-numbered drug-to-antibody ratio (DAR) species of 0, 2, 4, 6 or 8. The average DARs for most of vc-MMAE ADCs in clinical development are approximately 3–4. In 2011, the United States Food and Drug Administration approved a vc-MMAE ADC, brentuximab vedotin (ADCETRIS™) for the treatment of relapsed anaplastic large cell lymphoma and Hodgkin’s lymphoma.Citation3
Given the complex structure of ADCs, which contain both large and small molecule components, and the mixture of various DAR species in the dosing solution, the PK of ADCs are expected to be complex. ADCs are expected to be cleared through two major pathways: proteolytic degradation and deconjugation.Citation4,Citation5 Similar to mAbs, ADC clearance through proteolytic degradation is driven primarily by catabolism mediated by target-specific or nonspecific cellular uptake followed by lysosomal degradation. In contrast, deconjugation clearance is usually mediated by enzymatic or chemical cleavage (e.g., maleimide exchange) of the linker leading to the release of the cytotoxic drug from the ADC.Citation6 It is expected that ADC catabolism and deconjugation in vivo change the concentration and relative fractions of individual DAR species with time, by converting high DAR species to low DAR species, resulting in a gradual decrease in average DAR over time. This phenomenon was observed in a preclinical study as well.Citation7
Considering the heterogeneity and complex changes in ADC concentration and composition after ADC administration, multiple analytes have been measured in order to characterize the PK properties of an ADC.Citation8,Citation9 These measurements include: conjugate (evaluated as either conjugated-antibody or antibody-conjugated drug); total antibody (sum of conjugated, partially deconjugated, and fully deconjugated antibody); naked antibody (antibody without the conjugated drug); and the unconjugated drug.Citation8–Citation10 For the vc-MMAE ADCs clinically developed at Genentech, three analytes are routinely measured for PK assessment: antibody-conjugated MMAE (acMMAE), total antibody, and unconjugated MMAE.Citation9
Over the past decade, Genentech has developed eight vc-MMAE ADCs, against different targets and for diverse tumor indications, which provides a unique opportunity to characterize the clinical pharmacology for this class of ADCs. Here, we report and compare the PK characteristics of the eight vc-MMAE ADCs using data from eight first-in-human (FIH) Phase 1 studies in cancer patients. The correlation between analytes was assessed across the eight ADCs. Additionally, exposure–response relationship analysis was conducted to explore the key analyte that correlates with efficacy and safety endpoints.
Results
vc-MMAE ADCs and PK data
The drug targets, tumor indications, number of patients, and dosing for the eight vc-MMAE ADCs are summarized in . In addition to sharing the same linker-drug and conjugation chemistry, the average DARs for the eight vc-MMAE ADCs were approximately the same (i.e., ~3.5). Additionally, the mAb components of the eight ADCs all used humanized IgG1 isotype. Of the eight vc-MMAE ADCs, three molecules, namely DMOT4039A, DMUC5754A, and DFRF4539A, were able to bind circulating soluble antigens besides the corresponding member-bound antigens. Three of the eight molecules were developed for hematological tumors, while the remaining five were for solid tumors.
Table 1. ADCs, targets, and tumor indications of eight vc-MMAE ADCs included in the analysis
The PK analyses were based on data from FIH Phase 1 studies in cancer patients that included both a dose-escalation component and at least one expansion cohort at a dose identified for further clinical study. The dose-escalation schemes were slightly different across the eight ADCs, but the dose levels assessed were all within the range of 0.1 to 3.2 mg/kg when given every 3 weeks (q3w) (). Nevertheless, the same dose regimen of 2.4 mg/kg q3w for the expansion cohort(s) was selected for all eight ADCs based on the overall benefit and risk profiles for each molecule. All data available in the clinical database at the time of data extraction were included in the analysis. A total of 564 patients (ranging from 33 to 95 patients for each study) across eight FIH Phase 1 studies were included in the analysis. Around half of the patients (~53%) were given the 2.4 mg/kg q3w dose. For some ADCs, single-agent weekly dosing was also pursued, but the results are not included in this analysis because the data set is small.
PK characteristics of vc-MMAE ADCs
As shown in and Figure S1, the concentration–time profiles of acMMAE, total antibody and unconjugated MMAE following the first 2.4 mg/kg intravenous dose of vc-MMAE ADCs (the dose used in the expansion cohort) were largely comparable across the eight molecules. Both acMMAE and total antibody analytes reached their maximum-observed concentration (Cmax) right after the end of infusion. Cmax of acMMAE was approximately 3- to 4-fold higher than that of total antibody when the concentrations are presented in nM (mean Cmax: 1000–1300 nM and 250–375 nM for acMMAE and total antibody across eight ADCs, respectively). The difference of Cmax in nM between the two analytes (3–4-fold across eight ADCs) reflects the starting average DAR of 3–4 in the dosing solution. After reaching their Cmax, concentrations of the two analytes declined in a multi-exponential manner. Compared to the total antibody, acMMAE analyte showed more rapid decline in concentration (). As a result, acMMAE generally exhibited faster clearance and shorter terminal half-lives than the total antibody (). At 2.4 mg/kg, the mean clearance of acMMAE was numerically higher than that of total antibody analyte for all the eight molecules, with mean value of 16.6–30.2 mL/dy/kg and 8.24–23.6 mL/d/kg across the eight ADCs for acMMAE and total antibody, respectively (). The mean terminal half-lives (t1/2) for the eight ADCs ranged from 3.8 to 6.2 d for acMMAE, which was numerically shorter than that of total antibody (3.9–10.7 d) for the majority of the vc-MMAE ADCs except DEDN6526A. The mean terminal half-life of acMMAE for DEDN6526A was numerically longer than that of total antibody (4.62 vs 3.92 d), although the differences between the two analytes were within the assay variability of 20% (). The mean steady-state volume of distribution (Vdss) of acMMAE for the eight ADCs ranged from 60.1 to 103 L/kg, which was approximately the same as that of total antibody (61.5–128 L/kg) (). The inter-subject variability of the exposure for the two analytes was similar across the eight ADCs with %CV for area under the concentration–time curve from time zero to infinity (AUCinf) at Cycle 1 ranging from 20–36% and 25–46% for acMMAE and total antibody, respectively (). Consistent with concentration–time profiles, following the first dose of 2.4 mg/kg, the key PK parameters of acMMAE and total antibody (e.g., Cmax, AUCinf, clearance, Vdss and t1/2) were overlapping and largely comparable across the eight ADCs ( and ). The inter-molecule variability of mean exposure (e.g., Cmax and AUCinf at Cycle 1) across the eight ADCs ranged from 7–19% and 16–34% for acMMAE and total antibody, which was smaller than or at the lower range of inter-subject variabilities of the two analytes (). Modest accumulation of acMMAE and total antibody analytes were observed for the eight vc-MMAE ADCs upon repeated dosing of 2.4 mg/kg q3w, with trough concentration ratios of 1.1–1.7 and 1.0–2.1 between Cycle 3 and Cycle 1 for acMMAE and total antibody analytes, respectively.
Table 2. PK parameters (mean ± SD [%CV]) of acMMAE, total antibody and unconjugated MMAE post the first dose of vc-MMAE ADCs at 2.4 mg/kg (90 min IV infusion)
Plasma concentrations of unconjugated MMAE were low relative to those of acMMAE and total antibody following single dose of 2.4 mg/kg ( and Figure S1). Mean Cmax of unconjugated MMAE was 3.15–7.01 ng/mL across the eight vc-MMAE ADCs, which were more than 100-fold lower than that of acMMAE (). There was an apparent delay for unconjugated MMAE to reach its Cmax, with median time to Cmax (Tmax) of approximately 2–3 d post-infusion. The mean terminal half-lives of unconjugated MMAE were largely within a range similar to that of acMMAE and total antibody, although numerically shorter for some ADCs, with mean values ranging from 3.0 to 5.0 d across the eight ADCs. As shown in and , the PK profiles and exposure of unconjugated MMAE were largely comparable across the eight ADCs following the first dose of 2.4 mg/kg. The differences in exposure of unconjugated MMAE (i.e., Cmax and AUCinf at Cycle 1) at 2.4 mg/kg between molecules were relatively small as compared to the inter-subject variability (). The inter-subject variability of unconjugated MMAE was relatively large, with %CV for the eight ADCs ranging from 48–74% and 50%-77% for Cycle 1 Cmax and AUCinf, respectively ()), while the inter-molecule variability of unconjugated MMAE across the eight ADCs was 24% and 18% for mean Cmax and AUCinf at Cycle 1, respectively. There was no apparent accumulation of unconjugated MMAE upon repeated dosing of vc-MMAE ADCs at 2.4 mg/kg q3w with trough concentration ratios of 1.0–1.3 between Cycle 3 and Cycle 1.
The dose levels evaluated in Phase 1 dose–escalation studies for the q3w regimen ranged from 0.1 to 3.2 mg/kg across vc-MMAE ADCs. As shown in , PK linearity appeared to vary with different vc-MMAE ADCs. A trend of nonlinearity was observed for pinatuzumab vedotin (ADC1), DEDN6526A (ADC3) and DMUC5754A (ADC5). The clearance of acMMAE and total antibody for these three ADCs decreased with increasing doses; consistently, the corresponding inter-subject variability also decreased with the doses tested () and Figure S2). The PK for these three ADCs appeared to approach linearity at the expansion dose of 2.4 mg/kg. The remaining five ADCs exhibited apparent dose-independent clearance, indicating that PK was linear over the doses tested ()). Unconjugated MMAE appeared to exhibit dose-proportional PK for all the eight ADCs, as dose-normalized exposure was overlapping and comparable over the dose tested, although inter-subject variability was relatively large ()). The assessment of PK linearity is limited by small sample sizes per dose level in the q3w dose cohorts.
Analyte correlation analyses
As shown in ), acMMAE exposure (i.e., AUCinf at Cycle 1) was strongly correlated with that of total antibody for all eight vc-MMAE ADCs. Values of R2 ranged from 0.96 to 0.99 for the eight vc-MMAE ADCs. In contrast, the correlation between acMMAE and unconjugated MMAE exposure was less evident for the eight ADCs, with R2 value ranging from 0.63 to 0.78 ()).
Exposure–response relationship
The exposure–efficacy relationship was explored for the following four ADCs: pinatuzumab vedotin (ADC1), polatuzumab vedotin (ADC2), DEDN6526A (ADC3) and DNIB0600A (ADC6). These four ADCs were selected because they demonstrated efficacy in the Phase 1 studies with reasonable response events to enable the analysis. Given different tumor indications may have different exposure–efficacy relationships, only one tumor indication with adequate efficacy across tested doses was selected for each ADC if multiple tumor types were assessed in the study. Total antibody was not included in the analysis, given the strong correlation on the PK exposure between acMMAE and total antibody analytes. As shown in , for all four ADCs, patients with higher acMMAE exposure tended to have higher objective response rate (ORR). A significant exposure–response relationship was observed between acMMAE Cycle 1 AUCinf and ORR (p < .05, ) for three of the four ADCs, with DEDN6526A (ADC3) as the exception. For ADC3, a trend of positive exposure–response relationship was observed between acMMAE exposure and ORR, although it is not statistically significant (p= .067). In contrast, there was no significant positive relationship between unconjugated MMAE exposure and ORR (p> .05, Figure S3). The p values of exposure–efficacy relationship for acMMAE exposure were consistently lower as compared to the corresponding unconjugated MMAE exposure for all four ADCs ( and Figure S3), suggesting that the ORR correlation was stronger with acMMAE exposure compared with unconjugated MMAE exposure.
The exposure–safety relationship was also explored with the same four ADCs. Peripheral neuropathy (PN) was the adverse event of interest for vc-MMAE ADCs, as it is the most frequent adverse event resulting in dose reductions/discontinuations for vc-MMAE ADCs.Citation19 As shown in , patients with higher exposure of acMMAE appeared to have high probability to develop grade 2+ peripheral neuropathy. The relationship was statistically significant (p ≤ 0.05) for three of four ADCs, with DEDN6526A (ADC3) the exception. In contrast, no significant relationship was observed between unconjugated MMAE exposure and grade 2+ peripheral neuropathy for all four ADCs (p > .05, Figure S4). For DEDN6526A (ADC3), a trend toward a positive exposure–response relationship was observed with acMMAE exposure, although it is not statistically significant (p = .276, ); a flat exposure–response was observed for unconjugated MMAE (p = .855, Figure S4). Compared with unconjugated MMAE, acMMAE exposure appeared to exhibit stronger correlation with probability to develop grade 2+ peripheral neuropathy with p value of the exposure–safety relationship consistently lower for acMMAE than that for unconjugated MMAE across all four ADCs evaluated. It is worth noting that the exposure–response assessment for each Phase 1 study is limited by small patient and event numbers.
Discussion
vc-MMAE ADCs are one of the most commonly used drug-linker platforms in the clinical development of ADCs.Citation1 Structurally, vc-MMAE ADCs share the same vc linker, cytotoxic drug (MMAE) and conjugation chemistry, but they incorporate different mAbs against different targets and are used for different tumor indications (). For the eight vc-MMAE ADCs described here, the average DAR was approximately the same (3–4). Given that the patient numbers for each Phase 1 study were relatively small (ranging from 33 to 95) and the clinical data were rather limited (), leveraging the learning from other molecules with the same drug-linker can be valuable in better informing decision-making, such as identifying an optimal Phase 2 dose. Understanding the correlation between analytes and exploring the potential key analyte that correlates with efficacy and/or safety across ADC platform could also inform future clinical pharmacology strategy for ADCs in late-stage development. The objectives of this study were to conduct integrated analysis to characterize the PK and explore the exposure–response relationship of vc-MMAE ADCs to enable better decision-making and improved development strategy for vc-MMAE ADCs, and potentially for other ADCs, entering the clinical study.
Figure 1. Chemical structure of a vc-MMAE ADC
Three analytes, namely acMMAE, total antibody, unconjugated MMAE were measured in eight FIH Phase 1 studies to characterize the PK behavior of vc-MMAE ADCs. As shown in , each analyte exhibited a distinct PK behavior in vivo. Integrating the PK behavior of the three analytes is critical to understand the distribution, clearance pathway and elimination kinetics of a vc-MMAE ADC. As shown in , acMMAE concentrations declined more rapidly than total antibody concentrations. This is likely because two clearance pathways drive the decrease in acMMAE concentrations, namely proteolytical degradation and deconjugation, while total antibody concentrations changes are driven solely by proteolytical degradation. As a result, the difference in the concentration decrease of the two analytes could infer the rate of deconjugation from the ADC.Citation20
Figure 2. Concentration (in nM)–time profiles (mean + SD) of acMMAE, total antibody and unconjugated MMAE (uMMAE) post the first dose of vc-MMAE ADCs at 2.4 mg/kg (90 min intravenous infusion)
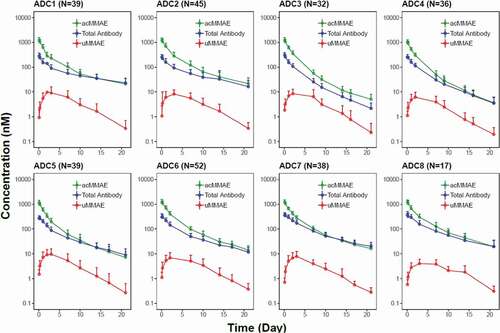
Figure 3. Exposure comparison of acMMAE, total antibody and unconjugated MMAE across the eight vc-MMAE ADCs post the first dose of vc-MMAE ADCs at 2.4 mg/kg (90 min intravenous infusion)
Across the eight vc-MMAE ADCs, the PK of acMMAE at 2.4 mg/kg was characterized by mean clearance values ranging from 16.6 to 30.2 mL/d/kg, a mean volume of distribution at steady state limited to plasma and interstitial space volume and a mean terminal half-life of approximately of 3.8–6.2 d, which likely explains the observation that repeated dosing of vc-MMAE ADCs q3w only resulted in modest accumulation of acMMAE for the eight vc-MMAE ADCs. Similar PK characteristics were also reported for brentuximab vedotin, the clinically approved vc-MMAE ADC with average DAR of 4.0 (CL: 23–25 mL/d/kg and t1/2: 4.4–5.9 d at clinically approved dose of 1.8 mg/kg).Citation3 Total antibody analyte was found to have a lower clearance (approximately 8.2–23.6 mL/d/kg) and longer t1/2 (approximately 3.9–10.7 d) compared to acMMAE. It was noted that total antibody clearance was faster than that of typical mAbs at linear range (approximately 3–6 mL/d/kg).Citation21 The estimated elimination half-life of total antibody is also shorter than that for a typical IgG1 antibody (2–3 weeks).Citation22 These results suggest that the mAb component of the ADCs undergoes additional clearance besides the target-mediated and nonspecific proteolytic degradation pathways through which a mAb is typically eliminated. In fact, Lyon et al.Citation23 showed that ADCs with hydrophobic drug linkers (e.g., vc-MMAE) undergo selective uptake by the nonparenchymal cells (i.e., sinusoidal endothelium and Kupffer cells) of the liver, thus contributing to the accelerated clearance of total antibody analyte as compared to mAbs. Overall, the PK properties of acMMAE and total antibody are more similar to a mAb than to a small molecule drug, with relatively slow clearance and a small volume of distribution that is mostly confined to plasma and interstitial space.
There was an apparent delay for unconjugated MMAE in reaching its Cmax relative to acMMAE (Tmax: approximately 2–3 d vs. post-infusion), but this was expected, as time is needed for unconjugated MMAE to be formed following cellular uptake, lysosomal internalization and degradation of a vc-MMAE ADC, and then to be released back into the systemic circulation. The released unconjugated MMAE is expected to behave like a small molecule that could be metabolized by CYP3A4/5 or excreted unchanged into the urine/feces. The half-lives of unconjugated MMAE (3.0–5.11 d) were generally much longer than half-lives expected for typical small molecules and approximated the half-lives of acMMAE and total antibody, although the mean value was numerically shorter than those of acMMAE and total antibody. This suggests that PK of unconjugated MMAE follows formation of rate-limited kinetics. Additionally, no evidence of unconjugated MMAE accumulation in plasma was observed after repeated dosing of an vc-MMAE ADC at 2.4 mg/kg q3w.
Over the dose tested across eight ADCs (0.1–3.2 mg/kg), a trend toward faster clearance at lower doses was observed for three vc-MMAE ADCs, but not for the remaining five ADCs, suggesting that PK non-linearity depends on the target expression and/or disease burden. These results, though limited, suggest that there is target-mediated clearance for the three ADCs at low doses in addition to nonspecific proteolytical degradation and deconjugation clearance. The presence of circulating soluble antigen does not necessarily result in non-linear PK. DMOT4039A and DFRF4539A, which were able to bind soluble antigen, exhibited linear PK over the dose tested. Upon increasing dose levels, the clearance of the three ADCs reached a plateau when target-mediated clearance was saturated; all eight vc-MMAE ADCs appeared to approach linear PK at 2.4 mg/kg ()). Given that the clearance pathways of vc-MMAE ADCs are expected to be similar when target-mediated clearance is saturated, it is not entirely unexpected that time-concentration profiles and key parameters of the three analytes for the eight vc-MMAE ADCs demonstrated remarkable similarity at 2.4 mg/kg regardless of target and tumor indication. These findings are consistent with results from platform population PK modeling of acMMAE analytes for the eight ADCs, which showed comparable acMMAE PK for the eight vc-MMAE ADCs, with much lower inter-molecule variability compared to the inter-individual variability. Therefore, for a future novel vc-MMAE ADC entering FIH clinical study, it is conceivable that the PK properties of vc-MMAE ADCs at 2.4 mg/kg reported here could be used to project human PK of a vc-MMAE ADC within a linear range and inform its FIH study design.
Figure 4. Dose-dependency of acMMAE and unconjugated MMAE PK for the eight vc-MMAE ADCs.
B. Dose-normalized AUCinf at Cycle 1 of unconjugated MMAE vs dose
Open cycle: observed data, AUCinf: area under the concentration–time curve from time zero to infinity, acMMAE: antibody-conjugated MMAE, ADC1 = Pinatuzumab vedotin (CD22); ADC2 = Polatuzumab vedotin (CD79b); ADC3 = DEDN6526A (ETBR); ADC4 = DMOT4309A (MsLN); ADC5 = DMUC5754A (MUC-16); ADC6 = DNIB0600A (Napi2b); ADC7 = DSTP3086S (Steap1); ADC8 = DFRF4539A (FcRH5)
Given the complex structure of an ADC with both large and small molecule components, it is essential to measure multiple analytes in the FIH Phase 1 study to understand the clearance pathway and elimination kinetics of an ADC in humans, but whether there is a need to continue measuring the multiple analytes of an ADC during late-stage clinical development is not yet clear. In order to address this question, we assessed the correlation between analytes. As shown in , there is a strong correlation between acMMAE and total antibody exposure (AUCinf at Cycle 1) for all eight vc-MMAE ADCs, with R2 values ranging from 0.96 to 0.99, supporting that measuring total antibody analyte in late-stage clinical development (e.g., Phase 2 or 3 studies) may not be warranted. In contrast, a weaker association was observed between acMMAE and unconjugated MMAE exposure (R2: 0.63–0.78). Lack of strong apparent correlation between acMMAE and unconjugated MMAE exposure may be partially due to the complex multi-step formation and release processes of MMAE. Additionally, the released MMAE undergoes CYP3A-mediated metabolism and biliary/renal excretion.Citation24 The inter-subject variability of these complex processes, especially large inherent inter-subject variability for CYP3A,Citation25 may potentially contribute to the lack of strong exposure correlation between acMMAE and unconjugated MMAE.
Figure 5. Correlation of AUCinf at Cycle 1 between analytes post the first dose of vc-MMAE ADCs over the doses tested (90 min IV infusion).
B. acMMAE vs unconjugated MMAE
Open cycle: observed data, The black line and shaded gray area represent linear regression model prediction and 90% confidence interval of predictions, acMMAE: antibody-conjugated MMAE, AUCinf: area under the concentration–time curve from time zero to infinity, ADC1 = Pinatuzumab vedotin (CD22); ADC2 = Polatuzumab vedotin (CD79b); ADC3 = DEDN6526A (ETBR); ADC4 = DMOT4309A (MsLN); ADC5 = DMUC5754A (MUC-16); ADC6 = DNIB0600A (Napi2b); ADC7 = DSTP3086S (Steap1); ADC8 = DFRF4539A (FcRH5)
Given the high correlation between acMMAE and total antibody exposure, exposure–response analysis was conducted with acMMAE and unconjugated MMAE analytes only. The results showed that higher acMMAE exposure was associated with better objective response; however, weaker or no apparent relationship was observed between unconjugated MMAE exposure and ORR ( and Figure S3). Similar observations were also made for Grade 2+ peripheral neuropathy. The probability of patients having Grade 2+ peripheral neuropathy appeared to correlate better with acMMAE exposure, rather than unconjugated MMAE exposure, with p values of exposure–response relationship numerically lower for acMMAE compared with that of unconjugated MMAE ( and Figure S4). These findings were observed consistently across the four ADCs evaluated. Similar exposure–response findings were also observed for brentuximab vedotin, the clinically approved vc-MMAE ADC.Citation3 These results support that acMMAE, but not unconjugated MMAE, is the main analyte associated with key efficacy and safety endpoints for vc-MMAE ADCs, which is aligned with the design concept and mechanism of action of ADCs. Theoretically, the MMAE in the tissues can come from circulating ADC (measured as acMMAE) and/or unconjugated MMAE, but the exposure–response results suggest that circulating ADC appears to play a more important role in delivering MMAE to the tissues compared to circulating unconjugated MMAE, and thus its exposure correlated better with the efficacy and safety outcomes. It is worth noting that the exposure–response assessment for each Phase 1 study is rather limited due to small patient and event numbers, but the consistent trend of the exposure–response relationships observed across 4 vc-MMAE ADCs and brentuximab vedotin strengthens the robustness of the findings. Since there is weaker or no apparent relationship between unconjugated MMAE exposure and key efficacy and safety endpoints, monitoring unconjugated MMAE analytes may be of limited value to support late-stage clinical development (such as Phase 2 and/or 3 studies).
Figure 6. Logistic regression analysis of exposure-efficacy (ORR) response relationship by acMMAE AUCinf at Cycle 1
Figure 7. Logistic regression analysis of exposure-safety (Grade 2+ peripheral neuropathy) response relationship by acMMAE AUCinf at Cycle 1
In conclusion, the PK properties of acMMAE, total antibody and unconjugated MMAE of single-agent vc-MMAE ADCs are well characterized and demonstrated remarkable similarity at 2.4 mg/kg q3w across the eight vc-MMAE ADCs included in this analysis. Strong correlation between acMMAE and total antibody exposure, but not between acMMAE and unconjugated MMAE exposure were consistently observed for all the eight vc-MMAE ADCs. Additionally, exposure–response analysis for multiple vc-MMAE ADCs showed that key efficacy and safety endpoints tested appeared to correlate well with acMMAE exposure, but not with that of unconjugated MMAE. Together these integrated platform analyses suggest that measurement of acMMAE analyte only might be adequate to support the clinical pharmacology strategy at the late stage of clinical development of vc-MMAE ADCs. Reducing the PK sample collection from three analytes to one analyte will not only increase the efficiency of clinical studies and reduce the development cost of an ADC, but also reduce unnecessary patient blood burden. However, it remains to be seen whether the recommended PK sampling strategy is applicable to other ADC platforms, such as ADCs with site-specific conjugation or different cytotoxic drugs.Citation1
Materials and methods
Study designs and data
The PK analysis was based on data from FIH Phase 1 studies in cancer patients of eight ADCs that included both a dose-escalation component and at least one expansion cohort at a dose identified for further clinical study. Studied doses were in the range of 0.1–3.2 mg/kg given every 3 weeks (q3w) and in the range of 0.8–1.6 mg/kg given every week (qw). All studies included an expansion cohort at 2.4 mg/kg given every 3 weeks as a single agent. All data available in the clinical database at the time of data extraction were included in the analysis. PK sampling was rich with multiple samples per patient (n ~ 10) collected during cycle 1 (up to 21 d post first dose) and 4–5 samples/cycle up to cycle 4. In addition, samples pre-dose and post-infusion were collected every other cycle until at least cycle 8. PK concentrations of acMMAE, total antibody, and unconjugated MMAE were quantified in the clinical studies at prespecified timepoints. For two of the ADCs developed for non-Hodgkin lymphoma (pinatuzumab vedotin and polatuzumab vedotin), the FIH studies included single-agent treatment only as well as in combination with the standard of care drug, rituximab. The PK data from single-agent treatment given every 3 weeks were the main focus of the current analyses.
Bioanalytical methods for PK concentrations of the three analytes
The acMMAE concentrations in plasma were quantified using a validated method consisting of Protein A affinity chromatography to capture the ADC followed by the enzyme-mediated release of MMAE, and liquid chromatography-tandem mass spectrometry (LC-MS/MS) for detection of MMAE.Citation9 The acMMAE assay measured the total concentration of MMAE conjugated to the antibody moiety. The total antibody assay quantified all forms of fully conjugated, partially deconjugated, and fully deconjugated antibody, which was measured in patient serum samples using a validated enzyme-linked immunosorbent assay (ELISA) method.Citation9 Unconjugated MMAE, a measure of the total plasma MMAE that was unconjugated from the antibody, was quantified using a validated LC-MS/MS method.
PK assessment
PK analyses included all patients who received at least one vc-MMAE ADC dosing and adequate blood sampling for at least one PK parameter at cycle 1. PK parameters at cycles 1, including Cmax, AUCinf, clearance, Vdss, and t1/2 were estimated with non-compartmental analyses (NCA) using WinNonlin 5.2.1 when data permitted. PK parameters were summarized and compared by molecules and dose levels using descriptive statistics and graphically. Relationships between exposure of any two analytes were explored graphically and by simple linear regression.
Exposure–response analysis
The following efficacy and safety endpoints were examined in the exposure–response analyses: ORR and Grade 2+ peripheral neuropathy. AUCinf at cycle 1 for acMMAE and unconjugated MMAE analytes were used as the exposure metrics. Given different tumor indications may have different exposure–efficacy relationships, only one tumor indication with adequate efficacy across tested doses was selected for each ADC if multiple tumor types were assessed in the study. All the patients who received at least one dose of the ADC and had enough PK samples to estimate AUCinf at Cycle 1 across tested doses were included in exposure-safety analysis. Logistic regression analyses were conducted for ORR and Grade 2+ peripheral neuropathy by including AUCinf at Cycle 1 of acMMAE or unconjugated MMAE as a continuous variable. The analyses were performed using generalized linear model functions in Splus 8.2 (Solution Metrics, Sydney, Australia).
Compliance with ethical standards
All the eight clinical studies were approved by the relevant Institutional Review Boards and Medical Ethics Committees and were carried out in accordance with International Conference on Harmonization E6 Guidelines for Good Clinical Practice and with the Helsinki declaration of 1975 or comparable ethical standards. Written informed consent was obtained for all patients in accordance with federal and institutional guidelines.
Declaration of Interest Statement
CL, CZ, ZL, DS, DL, BW, SC, RZ, PA, BF and SG are paid employees of Genentech, Inc. and stockholders of Roche Holding Ltd.
Disclosure of Potential Conflicts of Interest
No potential conflicts of interest were disclosed.
Supplemental Material
Download Zip (1 MB)Acknowledgments
The authors would like to thank all the patients and investigators for their participation in the clinical studies. The authors also thank clinical study teams for each project for their thoughtful study design and careful implementation of the clinical study. Support for third-party editing assistance for this manuscript was provided by F. Hoffmann-La Roche, Ltd.
Supplemental Material
Supplemental data for this article can be accessed on the publisher’s website.
Additional information
Funding
Related Research Data
References
- Polakis P. Antibody drug conjugates for cancer therapy. Pharmacol Rev. 2016;68:3–12. doi:https://doi.org/10.1124/pr.114.009373.
- Trail PA. Antibody drug conjugates as cancer therapeutics. Antibodies. 2013;2:113–29. doi:https://doi.org/10.3390/antib2010113.
- Center for Drug Evaluation and Research. Clinical Pharmacology and Biopharmaceutics Review for Adcetris; Silver Spring (MD); 2011 [cited 2019 Dec 2]. https://www.accessdata.fda.gov/drugsatfda_docs/nda/2011/125388Orig1s000ClinPharmR.pdf.
- Kamath AV, Iyer S. Preclinical pharmacokinetic considerations for the development of antibody drug conjugates. Pharm Res. 2015;32:3470–79. doi:https://doi.org/10.1007/s11095-014-1584-z.
- Kamath AV, Iyer S. Challenges and advances in the assessment of the disposition of antibody-drug conjugates. Biopharm Drug Dispos. 2016;37:66–74. doi:https://doi.org/10.1002/bdd.v37.2.
- Shen BQ, Xu K, Liu L, Raab H, Bhakta S, Kenrick M, Parsons-Reponte KL, Tien J, Yu SF, Mai E, et al. Conjugation site modulates the in vivo stability and therapeutic activity of antibody-drug conjugates. Nat Biotechnol. 2012;30:184–89. doi:https://doi.org/10.1038/nbt.2108.
- Bender B, Leipold DD, Xu K, Shen BQ, Tibbitts J, Friberg LE. A mechanistic pharmacokinetic model elucidating the disposition of trastuzumab emtansine (T-DM1), an antibody-drug conjugate (ADC) for treatment of metastatic breast cancer. AAPS J. 2014;16:994–1008. doi:https://doi.org/10.1208/s12248-014-9618-3.
- Gorovits B, Alley SC, Bilic S, Booth B, Kaur S, Oldfield P, Purushothama S, Rao C, Shord S, Siguenza P. Bioanalysis of antibody-drug conjugates: American association of pharmaceutical scientists antibody-drug conjugate working group position paper. Bioanalysis. 2013;5:997–1006. doi:https://doi.org/10.4155/bio.13.38.
- Kaur S, Xu K, Saad OM, Dere RC, Carrasco-Triguero M. Bioanalytical assay strategies for the development of antibody-drug conjugate biotherapeutics. Bioanalysis. 2013;5:201–26. doi:https://doi.org/10.4155/bio.12.299.
- Girish SR, Li C. Clinical pharmacology and assay consideration for characterizing pharmacokinetics and understanding efficacy and safety of antibody-drug conjugates. In: Gorovits B, Shord S, editors. Novel methods in bioanalysis and characterization of antibody-drug conjugates. London (UK): Future Medicine; 2015. p. 36–55.
- Advani RH, Lebovic D, Chen A, Brunvand M, Goy A, Chang JE, Hochberg E, Yalamanchili S, Kahn R, Lu D, et al. Phase I study of the anti-CD22 antibody-drug conjugate pinatuzumab vedotin with/without rituximab in patients with relapsed/refractory B-cell non-Hodgkin lymphoma. Clin Cancer Res. 2017;23:1167–76. doi:https://doi.org/10.1158/1078-0432.CCR-16-0772.
- Palanca-Wessels MC, Czuczman M, Salles G, Assouline S, Sehn LH, Flinn I, Patel MR, Sangha R, Hagenbeek A, Advani R, et al. Safety and activity of the anti-CD79B antibody-drug conjugate polatuzumab vedotin in relapsed or refractory B-cell non-Hodgkin lymphoma and chronic lymphocytic leukaemia: a phase 1 study. Lancet Oncol. 2015;16:704–15. doi:https://doi.org/10.1016/S1470-2045(15)70128-2.
- Infante JR, Sandhu SK, McNeil CM, Kabbarah O, Li C, Zhong W, Asundi J, Hamid O. A first-in-human phase I study of the safety and pharmacokinetic (PK) activity of DEDN6526A, an anti-endothelin B receptor (ETBR) antibody-drug conjugate (ADC), in patients with metastatic or unresectable melanoma. AACR Annual Meeting; 2014; San Diego, CA.
- Weekes CD, Lamberts LE, Borad MJ, Voortman J, McWilliams RR, Diamond JR, de Vries EG, Verheul HM, Lieu CH, Kim GP, et al. Phase I study of DMOT4039A, an antibody-drug conjugate targeting mesothelin, in patients with unresectable pancreatic or platinum-resistant ovarian cancer. Mol Cancer Ther. 2016;15:439–47. doi:https://doi.org/10.1158/1535-7163.MCT-15-0693.
- Liu JF, Moore KN, Birrer MJ, Berlin S, Matulonis UA, Infante JR, Wolpin B, Poon KA, Firestein R, Xu J, et al. Phase I study of safety and pharmacokinetics of the anti-MUC16 antibody-drug conjugate DMUC5754A in patients with platinum-resistant ovarian cancer or unresectable pancreatic cancer. Ann Oncol. 2016;27:2124–30. doi:https://doi.org/10.1093/annonc/mdw401.
- Burris HA, Gordon MS, Gerber DE, Spigel DR, Mendelson DS, Schiller JH, Wang Y, Choi Y, Kahn RS, Wood K, et al. A phase I study of DNIB0600A, an antibody-drug conjugate (ADC) targeting NaPi2b, in patients (pts) with non-small cell lung cancer (NSCLC) or platinum-resistant ovarian cancer (OC). ASCO. 2014 https://meetinglibraryascoorg/record/91851/abstract.
- Sukumaran S, Zhang C, Leipold DD, Saad OM, Xu K, Gadkar K, Samineni D, Wang B, Milojic-Blair M, Carrasco-Triguero M, et al. Development and translational application of an integrated, mechanistic model of antibody-drug conjugate pharmacokinetics. AAPS J. 2017;19:130–40. doi:https://doi.org/10.1208/s12248-016-9993-z.
- Stewart AK, Krishnan AY, Singhal S, Boccia RV, Patel MR, Niesvizky R, Chanan-Khan AA, Ailawadhi S, Brumm J, Mundt KE, et al. Phase I study of the anti-FcRH5 antibody-drug conjugate DFRF4539A in relapsed or refractory multiple myeloma. Blood Cancer J. 2019;9:17. doi:https://doi.org/10.1038/s41408-019-0178-8.
- Samineni D, Kagedal M, Gillespie B, Fine B, Lu D, Choi YJ, Li C, Jin JY, Girish S. Time-to-event modeling of peripheral neuropathy – platform mega-analysis of eight vc-MMAE antibody-drug conjugates (ADCs). AAPS National Biotechnology Conference (NBC); 2016; Boston, MA.
- Lin K, Tibbitts J. Pharmacokinetic considerations for antibody drug conjugates. Pharm Res. 2012;29:2354–66. doi:https://doi.org/10.1007/s11095-012-0800-y.
- Deng R, Iyer S, Theil FP, Mortensen DL, Fielder PJ, Prabhu S. Projecting human pharmacokinetics of therapeutic antibodies from nonclinical data: what have we learned? MAbs. 2011;3:61–66. doi:https://doi.org/10.4161/mabs.3.1.13799.
- Dirks NL, Meibohm B. Population pharmacokinetics of therapeutic monoclonal antibodies. Clin Pharmacokinet. 2010;49:633–59. doi:https://doi.org/10.2165/11535960-000000000-00000.
- Lyon RP, Bovee TD, Doronina SO, Burke PJ, Hunter JH, Neff-LaFord HD, Jonas M, Anderson ME, Setter JR, Senter PD. Reducing hydrophobicity of homogeneous antibody-drug conjugates improves pharmacokinetics and therapeutic index. Nat Biotechnol. 2015;33:733–35. doi:https://doi.org/10.1038/nbt.3212.
- Han TH, Gopal AK, Ramchandren R, Goy A, Chen R, Matous JV, Cooper M, Grove LE, Alley SC, Lynch CM, et al. CYP3A-mediated drug-drug interaction potential and excretion of brentuximab vedotin, an antibody-drug conjugate, in patients with CD30-positive hematologic malignancies. J Clin Pharmacol. 2013;53:866–77. doi:https://doi.org/10.1002/jcph.116.
- Westlind A, Lofberg L, Tindberg N, Andersson TB, Ingelman-Sundberg M. Interindividual differences in hepatic expression of CYP3A4: relationship to genetic polymorphism in the 5ʹ-upstream regulatory region. Biochem Biophys Res Commun. 1999;259:201–05. doi:https://doi.org/10.1006/bbrc.1999.0752.