
ABSTRACT
We describe a mammalian expression construct (SPLICELECT™) that allows the redirection of a proportion of a secreted protein onto the cell surface using alternative splicing: whereas the majority of the RNA is spliced into a transcript encoding a secreted protein, a weak splice donor site yields a secondary transcript encoding, in addition, a C-terminal transmembrane domain. The different sequence elements can be modified in order to modulate the level of cell surface display and of secretion in an independent manner. In this work, we demonstrated that the cell surface display of stable cell lines is correlated with the level of the secreted protein of interest, but also with the level of heterodimerization in the case of a bispecific antibody. It was also shown that this construct may be useful for rapid screening of multiple antibody candidates in binding assays following transient transfection. Thus, the correlation of product quantity and quality of the secreted and of membrane-displayed product in combination with the flexibility of the construct with regards to cell surface display/secretion levels make SPLICELECT™ a valuable tool with many potential applications, not limited to industrial cell line development or antibody engineering.
Introduction
The manufacturing of recombinant proteins relies on the generation of stable cell lines transfected with genes coding for the product of interest. The stable integration of the transgene in the host cell genome is a rare event and screening is required in order to select the most appropriate cell line candidates during a cell line development campaign. Usually, this requires parallel overgrow batches of several hundreds of candidates.Citation1,Citation2 Tools that can facilitate this screening of stable cell lines are of great interest to simplify the cell line development process.
Flow cytometry allows the screening of several thousands of single cells in very short time, and can be used for the selection of high producer cell lines in the field of biotherapeutic production. This requires a specific marker that can be converted in a fluorescent signal and that is correlated with the amount of secreted product of interest from the individual cell.Citation3,Citation4
In the simplest cases, the protein of interest can be directly tagged, for example, with green fluorescent protein (GFP).Citation5 However, protein function and structure may be altered by the presence of the tag. Therefore, direct tagging is usually not applicable for therapeutic proteins. Other methods rely on the co-expression of a fluorescent protein (e.g., GFP) with the gene of interest, either through an internal ribosome entry site (IRES), using polycistronic vectors or by co-transfection.Citation6–Citation14 However, limitations in the secretory pathway, protein folding or different efficiencies in translation may affect the correlation of expression of the reporter protein and the gene of interest. These limitations are partially overcome by using a transmembrane reporter protein co-expressed with the protein of interest, such as using an IRES in the expression cassette,Citation14–Citation18 or due to a non-optimal start codon,Citation19 even if an expression bias, which could be caused by uncorrelated expression of reporter and gene of interest due to different folding kinetics, may still be possible. In general, the reporter protein needs to be carefully selected in order to avoid toxic effects for the host cellCitation20 or co-purification with the gene of interest.
Alternatively, the secreted protein may be captured in the vicinity of the producer cell (affinity matrixes,Citation21–Citation26 micro droplets,Citation27–Citation29 or the cultivation in semi-solid mediaCitation30,Citation31). However, these methods require a specific environment that may not always be suitable for the host cell, as well as a lot of optimization for each campaign. Even direct surface staining of the producing cells has been proposed, but the nature of the signal is not well understood and may not always be directly linked to the level of secretion.Citation32–Citation35
Many of the limitations described above can be overcome by cell surface display of a membrane version of the target protein, for example, by linking the protein to the cell surface with a glycosylphosphatidylinositol anchorCitation36 or a transmembrane domain with a cleavable peptide,Citation8,Citation37,Citation38 so that the protein of interest is released after proteolytic treatment. The co-expression of an “anchor” protein at the cell surface in order to link the recombinant protein to the producing cell was recently described.Citation39 Alternatively, the transmembrane domain can be added due to regulated read-through of a non-sense codonCitation40 or due to the use of amber suppression.Citation41 In these examples, an antibiotic or specific non-natural amino acid was added to the cultivation medium to promote the membrane binding of the otherwise secreted protein. However, for many applications (e.g., biotherapeutic production) these additional processing steps are not desired. Alternatively, the usage of a leaky stop codon between the protein of interest and a transmembrane domain allows the constitutive display of a small, but fixed fraction on the cell surface.Citation42,Citation43
Interestingly, the human immune system provides an additional and elegant way to link cell surface display and secretion. B cells are the antibody producers in the human immune system. Each B cell expresses a single antibody specifically binding a single antigen. In resting B cells (memory cells), the antibody is predominantly membrane-bound. Upon recognition of its antigen, a B cell will proliferate into plasma cells expressing a huge amount of secreted antibody.Citation44 The only difference between the two antibody isoforms is a C-terminal extension of the membrane-bound version with a transmembrane region.Citation45 The controlled transition between the two isoforms of antibody (membrane-bound and secreted) is achieved by alternative splicing.Citation45,Citation46 Splicing describes the precise excision of the introns of the mRNA, accomplished by a protein complex called spliceosome that is able to recognize consensus sequences: the 5ʹ splice donor (5ʹ SD) and 3ʹ splice acceptor (3’SA) sites at the intron/exon borders and the branch point and the poly pyrimidines (poly(Y)) tract in the intron. The efficiency of the splicing depends largely on the different consensus sequences, but also on so-called splicing enhancer and repressor sequences present in both introns and exons. Alternative splicing describes the mechanisms by which a single pre-mRNA is matured into different mRNA, a process that is usually highly regulated by interaction of many different factors.Citation47–Citation58
The use of the natural intron of the immunoglobulin gene for antibody display using alternative splicing has been described.Citation59–Citation62 However, the natural intron sequence substantially increases the size of the gene of the heavy chain (to around 5 kb), which may affect routine cloning steps. Current improvements include the use of gene-editing tools, such as TALE nucleases or CRIPR-Cas9, for the integration of antibody libraries in hybridoma cells, leading to surface display and secretion of the correctly integrated genes.Citation63,Citation64
The major disadvantage of all the cell surface display technologies presented so far is the lack of adaptability of the fraction of antibody that is directed to membrane display. Different applications may require very low levels of display, whereas others may require much higher levels. For example, the selection of stable cell lines expressing a classic monoclonal antibody would require relatively low levels of display, whereas some of the new antibody formats that express at lower levels may require a higher fraction of membrane display in order to generate a measurable and quantifiable signal. A system that allows adjustment of the level of display and of the amount of secreted product may, therefore, be of great interest.
Here, we describe a method of cell surface display based on alternative splicing using the chicken cardiac troponin intron 4, which is located upstream of the alternative exon 5 in the chicken genome.Citation49,Citation58 This intron is around 0.5 kbs long, and therefore more convenient for use in plasmids. In order to modulate the fractions of secreted and displayed antibody, the intron consensus sequences can be modified. We also show that the transmembrane domain added at the C-term of the heavy chain has a huge impact on the proportion of displayed antibody. This alternative splicing construct can, for example, be used as a screening or sorting tool in cell line development or in antibody discovery, allowing not only screening for the highest producers, but also for the desired product quality attributes, such as the heterodimerization level of a bispecific antibody or binding affinity to a target molecule.
Results
Introduction of the AS construct and proof of concept
Alternative splicing can be used to redirect a small fraction of a protein of interest from the secretory pathway to the membrane by adding a transmembrane domain at its end. An antibody is generally composed of four polypeptides: two heavy chains and two light chains. In order to display a fraction of an antibody at the cell surface, the expression construct encoding the heavy chain gene was modified: a weak splice donor site was added close to the 3ʹ-end of the heavy chain gene, prior to the stop codon. The chicken cardiac troponin intron 4 flanked by a strong splice donor site (5ʹ end) and a strong splice acceptor site (3ʹ end) was inserted after the stop codon, followed by a sequence coding for a transmembrane domain. Here, we refer to this construct as the alternative splicing (AS) construct (). The RNA transcripts of this sequence will undergo two different splicing events. In one case, the splice donor site 1 is not recognized, resulting in an mRNA with an open reading frame stopping at the first stop codon not including the transmembrane domain, and thus coding for a secreted protein (). In the other case, the splice donor site 1 is recognized, resulting in an mRNA with an open reading frame including the transmembrane domain, and thus cellular display of the protein (). As the splice donor site 1 is weak, only a small fraction of the antibody will be membrane bound.
Figure 1. Architecture of the alternative splicing (AS) construct. (a) The sequence coding for the protein of interest has a weak splice donor site (5’SD1) upstream of the stop codon. The intron following the stop codon has a strong splice donor site (5ʹ SD2), an optional polyadenylation signal (poly(A)), a branch point (depicted by A in the figure), a polypyrimidine (poly(y)) tract and a splice acceptor sequence (3ʹ SA). It is followed by an exon coding for a transmembrane domain (TM domain), which is composed of an extracellular linker sequence, a transmembrane helix (TM helix) and a cytosolic tail (Cyto. tail) and terminated by a stop codon. The expression cassette is closed by a polyadenylation signal (poly(A)). (b and c) The two mRNA species obtained after splicing. (d) Antibody cell surface display 1 day after transient transfection of CHO-S cells with AS construct for the expression of a mAb. As control, cells were transfected with a NoS expression vector coding for the same antibody. (e) Expression level of the transiently transfected cells on day four (n ≥ 3, mean ± standard deviation)
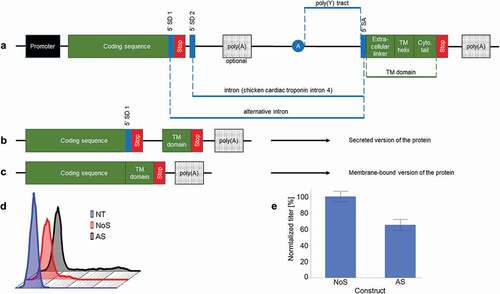
Chinese hamster ovary (CHO)-S cells were transiently transfected to produce an antibody of the IgG1 type. The heavy chain was either encoded by a non-splicing control construct (NoS) or by the AS construct in which the IgG1 heavy chain is linked by alternative splicing with the M1M2 transmembrane domain. The day after transfection, cells were stained with an anti-Fc phycoerythrin (PE)-conjugated antibody and analyzed by flow cytometry. While the cells transfected with the NoS construct showed only a slight staining on their surface compared to the non-transfected cells, the use of the AS construct resulted in a larger number of stained cells, as well as in a brighter signal (). However, 4 days after transfection the use of the AS construct resulted in a decrease of approximatively 40% of the expression titer compared to the standard construct ().
Modifications of the AS construct for modulation of splice ratio and signal
Modifications of the transmembrane domain
In the following constructs, the M1M2 domain of the initial construct was replaced by the transmembrane domain from the human T-cell receptor alpha gene (PTCRA) and from the murine B7-1 gene. PTCRA was used because the T-cell receptors are structurally similar to immunoglobulins and the murine B7-1 transmembrane domain because it has been described to allow efficient secretion of transmembrane chimeric proteins.Citation65–Citation67 Whereas the secretion level was not improved compared to the initial M1M2 transmembrane domain construct, a substantial impact was seen on the surface staining, with B7-1 allowing the highest level of surface display, with 5x more cells stained and an increase of the mean fluorescent signal of 30x ( and .
Figure 2. Modification of the transmembrane domain of AS construct. (a) Impact of the transmembrane domain on secretion level (n ≥ 3, mean ± standard deviation). (b) Impact of the different transmembrane on the surface staining. (c) Impact of transmembrane helix length on secretion level (n ≥ 3, mean ± standard deviation, *: p < .001 in Tukey–Kramer test). (d) Impact of transmembrane helix length on surface staining. In blue, modified, B7-1 transmembrane domain with modified transmembrane helix. In black, control B7-1 transmembrane helix (e) Impact of the charged amino acids in the transmembrane helix (n ≥ 3, mean ± standard deviation). (f) Impact of the ER export signal in the cytosolic tail. (n ≥ 3, mean ± standard deviation). “-“ = without ER export signal; “+” = with ER export signal
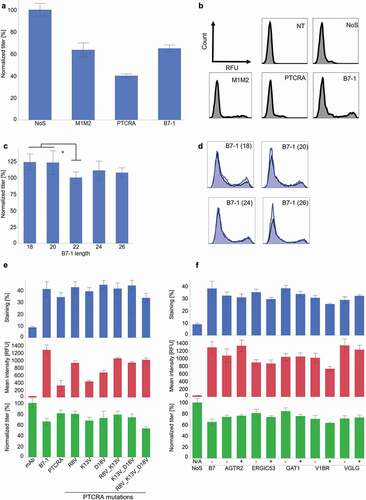
The transmembrane helix contained in the transmembrane domain is the actual stretch of amino acids that spans the cell membrane. The length of the transmembrane helix is believed to be important for its stabilization. It must correspond roughly to the depth of the lipid bilayer: longer helixes will be destabilized by the hydrophilic environment on both sides of the membrane, whereas shorter helixes will be too short to span the entire membrane and hydrophilic residues will be in contact with the hydrophobic environment of the lipid bilayer.Citation68 The B7-1 transmembrane helix is composed of 20 hydrophobic and two polar amino acids. AS constructs were cloned with length variants of B7-1 transmembrane helixes (varying from 18 to 26 amino acids). Decreasing the size of the transmembrane helix to 18 amino acids was beneficial for secretion (24% increase). The mean fluorescence signal of the surface staining was decreased by this modification, but the signal was still sufficiently strong to allow discrimination between low and high producers ( and .
In contrast to B7-1, the PTCRA transmembrane helix comprised three charged amino acids for a total length of 21 amino acids. In order to assess the effect of these charged residues on the cell surface display and on secretion, alternative splicing constructs containing the B7-1 extracellular sequence and cytosolic tail, but with different variants of the PTCRA transmembrane helix, were generated. The charged residues of the PTCRA transmembrane helix were exchanged for a hydrophobic valine. These modifications showed different effects, depending on which amino acid was exchanged. While modifying only arginine 8 had no impact on secretion but increased the surface staining intensity, the modification of lysine 13 was detrimental for the secretion level. Interestingly, modifying both arginine 8 and lysine 13 gave the same effect than modifying only arginine 8. Finally, replacing all the charged amino acids for valines had a clear negative impact on the expression. This demonstrated that the amino acid composition of the transmembrane helix has a strong effect on both the cell surface display (up to 30% in number of stained cells and up to 75% in mean fluorescence signal) and secretion (up to 35%) () and can be used for modulation.
The cytosolic tail of the transmembrane domain was described to contribute to transmembrane protein expression, as it might contain a so-called endoplasmic reticulum (ER) exportation signal. This signal might be linear, but can also be structural. The B7-1 cytosolic tail was shown not to contain any linear nor structural ER exportation signal.Citation65 In order to assess the impact of the ER exportation signal in the AS constructs, different cytosolic tails with or without the ER exportation signal were used. No significant effect on the staining results, nor on secretion levels, was observed (), indicating that the ER exportation signal was not contributing in a significant manner.
Modulation of splice ratio and signal by modification of intron-exon border
Modifications of the splicing consensus motifs of the AS construct can have a substantial impact on the fraction of displayed protein versus secreted protein.
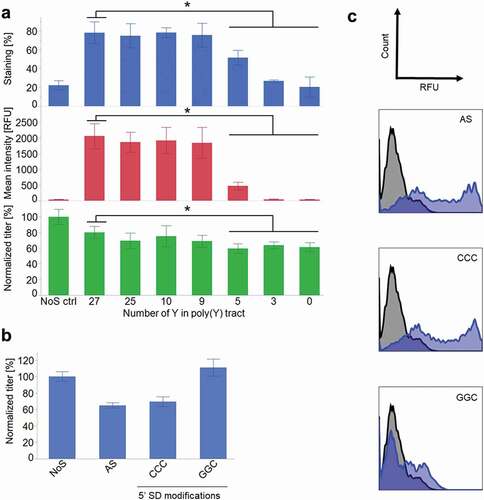
The poly-pyrimidine tract (poly(Y)) is important for the formation of the spliceosome, as it is the binding site for one of its subunits.Citation51–Citation53,Citation69–Citation71 Reducing the pyrimidine number in the poly(Y) tract from 27 (control AS construct) to 0 resulted in a decrease of the surface staining and in a parallel decrease of the titer from 5Y. The reason for the decrease in secretion is unknown, but might be linked with the requirement of splicing for effective RNA export and translation in mammalian cells.Citation72
The presence of a polyA signal in the RNA may lead to the termination of the transcription and to the cleavage of the RNA before the insertion of the polyA tail, which might play a role in alternative splicing regulation.Citation73,Citation74 In B cells an alternative polyadenylation signal seems to contribute to regulate the switch from membrane-bound to secreted antibody.Citation46,Citation75,Citation76 Introducing a polyA signal after the first stop codon may reduce the possibility for the alternative splicing at SD1 to occur, and thus increase the secretion level. However, AS constructs generated with or without polyadenylation signal did not show significant changes in surface staining and in secretion (data not shown).
The gastrin terminator was described to detach the transcription machinery from the DNA.Citation77 Added at the end of the expression cassette after the polyadenylation signal, it may affect splicing, but the addition of the gastrin terminator at the end of the expression cassette had no significant impact on either surface staining or titer (data not shown).
The splice donor consensus sequence is important for the recognition of the splicing site by the splicing machinery. In the germline sequence of the heavy chain, the splice donor site was weak, but its strength can still be further reduced. The use of the alternative codons to keep the same amino acids while modifying the splice donor site allowed generation of two modified splice donor sites. The modification “CCC” did not have any impact on staining and had a minor negative impact on secretion. On the other hand, the modification “GGC” resulted in a high secretion, comparable to the one of the controls. However, the staining was affected by this modification and was reduced to very low levels ().
Figure 3. Modifications of splicing recognition sequences. (a) Reduction of pyrimidine content of the poly(y) tract of the intron (n ≥ 3, mean ± standard deviation, *: p < .001 in Tukey–Kramer test). (b) Titer determination after modification of the splice donor site (n ≥ 3, mean ± standard deviation). (c) Surface staining after modification of the splice donor sequence 1 day after transfection. In blue, AS construct. In black, NoS control
In order to obtain the best possible ratio between cell surface display and secretion, careful design of the AS construct was required. The optimal ratio might even be molecule dependent, as the sequence of the exon (the antibody coding sequence) has an influence on the splicing regulation, as shown in .
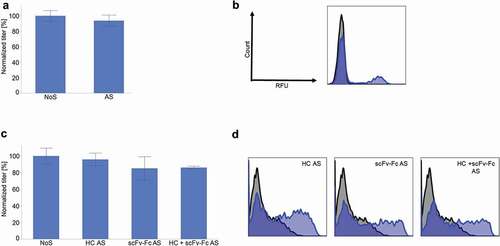
Figure 4. An IgG4 and a bispecific antibody (BEAT®) were expressed in CHO-S cells with and without AS construct. (a) IgG4 titer 4 days after transfection (n ≥ 3, mean ± standard deviation). (b) IgG4 cell surface staining the day after transfection. In blue, AS construct. In black, NoS control. (c) BEAT® titer 4 days after transfection (n ≥ 3, mean ± standard deviation). (d) BEAT® cell surface staining the day after transfection. In blue, AS construct. In black, NoS control
Stable cell lines generation
A stable cell line expressing an IgG1 was generated using the AS construct. Several clonally derived subpopulations were analyzed for antibody surface display and expression in a fed-batch of 12 days. The mean fluorescence intensity of surface staining for each subpopulation was plotted against the fed-batch titer, which showed a good correlation (R2 = 0.76, p < .001) between both signals (). Thus, the surface display of the antibody as detected by flow cytometry was demonstrated to be predictive for the expression level of a cell line. Moreover, the staining profile of the different cell line candidates seems indicative of the homogeneity and the stability of the population,Citation78 with a single tight peak characterizing a stable and homogeneous cell line.
Figure 5. Cell line screening and sorting with AS construct. (a) Stable cell lines expressing an IgG1 with the AS construct were analyzed by cell surface staining and fed-batch assessment for expression level correlation. (b) Example of a stable pool of cells transfected with the AS construct encoding a BEAT®. (c) Stable cell lines expressing a BEAT® with the AS construct were analyzed by cell surface staining and fed-batch assessment for product quality attribute (percentage of BEAT® expressed). (d) Sorting of a stable pool of cells transfected with the AS construct encoding an IgG1. The cells were sorted according to the level of cell surface display. (e) Expression level of the stable clones obtained after cell sorting in (D)
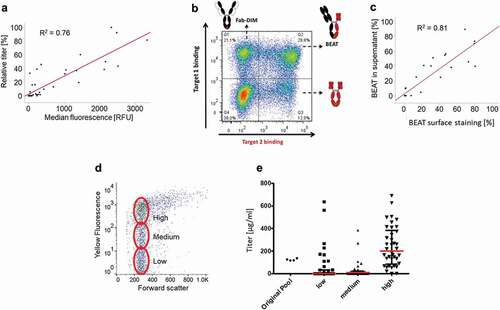
Similarly, a stable cell line expressing a bispecific antibody was generated with the AS construct. The bispecific antibody, derived from the Bispecific Engagement by Antibodies based on the T cell receptor (BEAT®) technology, was a heterodimer of an IgG moiety recognizing one target and a scFv-Fc recognizing a second target. One of the major challenges of cell line development for bispecific antibodies is the selection of cell populations that express a majority of the heterodimer, as homodimerization can also occur. Dual staining based on the two soluble targets tagged with different fluorophores allowed us to screen efficiently for cells expressing correctly assembled bispecific antibodies. After analysis of several cell populations stably expressing a bispecific AS construct, a statistically significant correlation between the cell surface staining and the actual proportion of true bispecific antibody expressed was shown (R2 = 0.81, p < .001) (). Therefore, the AS construct can be used not only for the screening of high producers but also for cells producing the protein with the desired quality attributes.
The AS construct can be used either for population enrichment prior to clone generation, e.g., with magnetic beads, or for direct single-cell cloning using flow cytometry. After transfection with the AS construct, pools of stable transfectants were generated. Cells were then stained and dispensed in 96-well plates by single-cell sorting using flow cytometry. Different clusters of clones were generated: for IgG1 expressing cell lines, low, middle and high producer clones were generated using the level of surface display on the day of sorting. The obtained clones were amplified and their productivity was determined in fed-batch. The distribution of the titer mean for each subpopulation was in accordance with the sorting strategy, showing that cell sorting using the AS construct is able to select cell lines with secreted productivity similar to the membrane-bound expression level and allows easier selection of the desired clones than using traditional methods. Noteworthy, some high producers were obtained in the low and middle subpopulation, possibly due to staining artifacts ( and . For the BEAT®-expressing cell line, clones were generated from three different subpopulations according to the dual-staining signal: the Fab homodimer expressors, the scFv-Fc homodimer expressors and the BEAT® expressors. The resulting clones were assessed in fed-batch: the majority of the cell lines obtained this way expressed the expected product based upon the selected subpopulation (data not shown).
Molecular characterization of the splice event
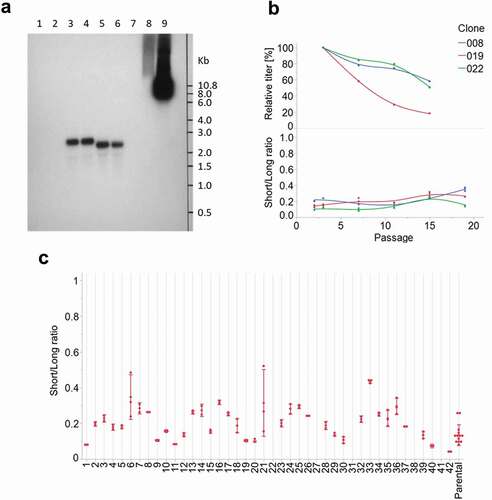
In order to ensure that the AS construct is not leading to undesired splicing events and undesired RNA species that may produce different protein variants, a Northern Blot analysis was performed on the stable clone transfected with the AS construct expressing an IgG1. As control, a stable cell line generated with the NoS construct was used. In the two samples (NoS and AS constructs), only a single transcript could be detected, with no presence of aberrant splice variants. This was in accordance with our expectations, as the size difference between the two transcripts generated by the AS construct (18 nt) is too small to be detected as two distinct bands on the gel (). An RT-PCR followed by sequencing confirmed the sequence of both splice variants.
Figure 6. (a) Northern blot analysis. Lanes 1–2: non-transfected cells. Lanes 3–4: clone transfected with the AS construct. Lanes 5–6: control clone transfected with the NoS construct. Lane 7: empty. Lane 8–9: 1 ng and 10 ng, respectively, of the AS construct plasmid. (b) Stability study on three cell lines generated by cell sorting. Upper panel: fed-batch titers over time, relative to P3 value. Lower panel: ratio between short and long transcripts over time. (c) Ratio between short and long transcripts in 42 sub-populations obtained after sub-cloning of a parental cell line population
In order to exclude the presence of unwanted species due to the AS construct, a protein sample was analyzed by mass spectrometry. No aberrant C-terminal sequence of the protein resulting, for example, from a shedding of the transmembrane version could be detected (data not shown).
In order to assess the stability of the splicing event, i.e., to be sure that the proportion of both RNAs remained stable, a qPCR assay was designed. Three different cell lines generated by cell sorting were cultivated for more than 80 population doubling levels. Samples were collected at different time-points during this cultivation and analyzed by qPCR for the presence of both RNA variants. The ratio between both variants remained stable over time (). In order to determine whether the splice ratio is an inheritable feature, a cell line was sub-cloned by limiting dilution, and 42 subpopulations were analyzed by qPCR (). Except for three populations (22, 31 and 38) that completely lost the expression of the transgene, and one (42) in which the ratio was significantly different, all the other populations showed the same ratio between the two splice variants as the parental cell line.
Mammalian display as discovery tool
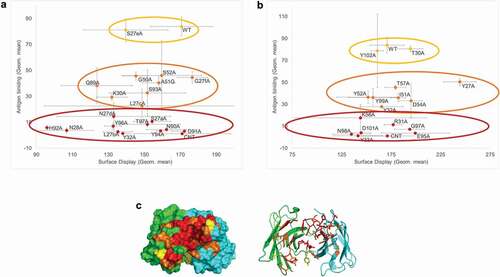
Until now, we demonstrated that mammalian display allows selection of desired cell populations. An alternative use is to determine desired product characteristics out of different candidate molecules using comparable cell populations. In this case, the AS construct allows determination of the expression level (linked to staining), as well as the binding to target. An AS construct composed of the B7 transmembrane domain with the CD28 transmembrane helix was used for high-throughput screening of antibody candidate molecules. In an alanine-scan experiment, different amino-acids forming the binding pocket of an antibody were mutated to alanine in order to identify residues required for target binding. Using the AS construct, cells were transiently transfected with the different constructs, in 96-well plates. The day after transfection, the cells were double stained with an anti-Fc PE-conjugated antibody and with the soluble target of the antibody ( and . The intensity of the display was not affected by the different mutations, indicating that all constructs were expressed at similar levels (low-expressing antibody candidates would have shown low surface staining). However, the binding intensity was clearly decreased for some of them, allowing the identification of the amino acids critical for the binding of the antibody to its target (see ). The use of SPLICELECT™ allowed direct purification of the candidates of interest after 4–5 more culture days, in order to confirm these findings (data not shown).
Figure 7. Alanine-scan using the AS construct. (a) Different amino acids of the light chain of an antibody were mutated to alanine. The signal from antibody display (PE signal) was plotted against the binding (APC signal). Three categories of mutations could be detected: no effect (yellow population), moderate effect (orange population) and significant loss of binding (red population). (b) Similar study on the heavy chain amino acids. (c) Structural modeling of the antibody binding pocket: the mutated amino acids are represented with the color of the population they were attributed in the binding experiment (yellow: no effect, orange: moderate effect, red: critical amino acids for binding)
Discussion
Production of therapeutic proteins requires the selection of the best cell line in terms of titer and product quality. The screening process leading to the selection of the best-suited candidate is usually time- and resource-consuming. There is a need for the development of improved tools and technologies that can reduce the cell line development lead time.
Multiple cellular display technologies with different advantages and limitations are described in the literature.Citation3,Citation4 SPLICELECT™, the display technology presented here, is based on alternative splicing using the chicken cardiac troponin intron 4. The chicken cardiac troponin gene is expressed under two different isoforms during the development, due to alternative splicing.Citation58 Introns 4 and 5 of the chicken troponin genes were already used to generate reporter constructs for the study of alternative splicing.Citation49,Citation79 The intron 4 of the chicken cardiac troponin is only around 550 bps long, which allows it to be included in any plasmid without constraints of size.
Using the chicken troponin 4 intron and the natural transmembrane domain of IgG (M1M2) resulted in detectable cell surface display, but also in a decrease of the transient expression compared to exclusively secreted expression constructs. The reason for the observed decrease may be the shift of expression from secreted to membrane bound, but other factors may contribute (e.g., loss of stability or reduced transcription due to the modifications of sequence of the pre-mRNA or unfavorable codon usageCitation80). In order to be most efficient, the AS construct has to derive a sufficient fraction of antibody to the cell surface in order to yield a quantifiable signal with minimal reduction of the production level.
The different elements of the AS construct can be modified in order to modulate the levels of secreted and membrane-bound antibody. The replacement of the M1M2 domain by B7-1, a murine transmembrane domain often used for the construction of chimeric transmembrane proteins and known to lead to high surface display of chimeric proteins,Citation65–Citation67 did not affect the secretion level, but increased the surface staining. This increased staining may be due to favorable folding characteristics of B7-1 compared to the M1M2 domain or to enhanced stability of the chimeric construct.
Transmembrane helices are usually 19–29 amino acids long and are mainly composed of hydrophobic residues.Citation68 While the B7-1 transmembrane helix is composed of 20 hydrophobic and two polar amino acids, the PTCRA transmembrane helix is composed of 18 hydrophobic and three charged residues. Several modified transmembrane helices were generated to assess the impact of length and amino acids composition in the AS construct. Reducing the length of B7-1 helix to 18 or 20 amino acids led to an increase of ~20% in secreted titer compared with the native helix, while maintaining the cell surface display of antibody. The replacement of charged amino acids in PCTRA by valine had no positive effect on secreted titer but was positive in terms of surface display signal intensity for most of the constructs (except for the K13V mutation).
A transmembrane protein also has a cytosolic tail that might contain a so-called ER-exportation signal, which is thought to have an impact on the intracellular trafficking of the protein.Citation65,Citation81 However, in our AS construct, no impact of the ER-exportation signal could be detected.
Splicing is performed by a complex called spliceosome that is composed of 50–100 core proteins and five small nuclear RNAs. The recognition of the splicing consensus sequences (5ʹ splice donor site, branch point, 3ʹ splice acceptor site including the poly-pyrimidines tract) is essential for the correct excision of introns. Therefore, modifications of these consensus sequences will affect the efficacy of the splicing. The content of pyrimidines in the poly(Y) tract is known to be an important factor for the recognition of the 3ʹ SA site, and replacement of pyrimidines by purines was used for modulation of alternative splicing events.Citation69 The chicken troponin intron 4 contains 27 pyrimidines between the branch point and the splice acceptor sequence. This content can be reduced up to 9 without significant impact on titer or staining, but reducing the pyrimidine content further leads to a reduction of the cell surface staining signal and to a slight but significant decrease of secreted titer. The reduction of titer was unexpected, and it can be speculated that the weakening of the splice donor site has an impact on mRNA stability or more generally on transcription.Citation72
The cleavage and polyadenylation of the RNA play an important role in the RNA maturation, and the use of alternative polyadenylation signal was also described to play a role in alternative splicing, especially in the gene of heavy chain in B cells.Citation46,Citation73–Citation76 In addition to polyadenylation signals, so-called “terminators”, such as the human gastrin terminator, have been described to play an important role in transcription terminator.Citation77 In our AS construct, neither addition of polyadenylation signals or gastrin terminator in the intron, nor addition of the gastrin terminator at the end of the expression cassette had an effect on secretion or cell surface display.
The weak splicing donor site located before the first stop codon was derived from the germline sequence of human IgG1 heavy chain. As part of the coding sequence for the antibody, this sequence can be modified using synonymous codons. We incorporated this approach in order to further weaken the splice donor site and shift the splicing toward the secreted form. One of the modifications had no impact, while the second one restored the secretion level to the NoS control level. However, with this modification, the cell surface signal was still detectable, but very low. An impact of alternative codon usage (“codon bias”Citation80) on expression is unlikely in this case, and the difference of behavior is probably due only to the disruption of the consensus splicing sequences.
In addition to the consensus sequences that define exon/intron borders, other sequence elements have effects on the splicing efficacy, including the intron and exon length,Citation46,Citation71,Citation82,Citation83 but also the coding sequence of the gene of interest, which may contain splicing enhancers and silencers.Citation48 Therefore, the optimal AS construct might be different for every molecule.
The cell surface display of a reporter antibody expressed with the AS construct was shown to be directly correlated with the secreted amount of antibody. This feature is of great interest, for example, in cell line development campaigns, as it allows pool enrichment (e.g., using magnetic beads), screening of clone candidates by flow cytometry, or single-cell cloning of cells with high surface staining. In addition to being predictive for expression titers, the cell surface display was shown to be predictive for product quality attributes, as demonstrated with bispecific antibodies: using a dual staining, it is possible to rapidly eliminate the cells expressing undesired homodimers. To our knowledge, the use of cellular display for the selection of cell populations producing a protein with desired quality attributes (e.g., a maximal level of heterodimerization) has not been reported previously.
One of the main advantages of alternative splicing for membrane display is that no specific compound is required: the cells constitutively express a small proportion of the antibody on their cell surface while secreting the majority of it. However, splicing is a complex system, and undesired mRNA variants could be produced. This scenario was excluded with a Northern Blot analysis and an RT-PCR followed by sequencing: both confirmed that only the two expected splice variants could be detected in a stable cell line. Moreover, the stability of the splicing event in a clonally derived cell population was confirmed with qPCR analysis at different population doubling levels and in different sub-clones derived from the parental clonally derived population.
Another concern linked to membrane display is the potential sheading of membrane-bound antibody in the cultivation medium, which would result in impurities in the final product. A protein sample obtained from a stable cell line was analyzed by mass spectrometry and no aberrant C-terminal sequence could be detected, showing that alternative splicing is safe to be used even in production cell lines.
In addition to its use in cell line development, membrane display can also be used early in antibody development, as a tool for mammalian display for antibody engineering. In this study, we used it for the characterization of the antigen-binding pocket of an antibody, using an alanine scan in the VH and in the VL of the test antibody. Cells were transfected in 96-well plates with the different variants and then screened with a dual staining in flow cytometry. Dual staining allows the detection of expression (display level) and antigen binding. This analysis was possible already the day after transfection. In addition, 5 days after transfection, a significant amount of protein could be purified and used for further testing. In a similar way, the presented constructs may be useful for antibody humanization, allowing fast screening of the candidates on both expression level and antigen-binding criteria.
In summary, the cell surface display of protein coded in the AS construct described here was demonstrated to be correlated with the secretion level and product quality. The construct offers the unique feature to modulate the cell surface display and the secretion level by modifying the different sequence elements summarized in , allowing to generate a measurable and quantifiable signal for well-expressing proteins, but also for proteins with low expression levels. This unique combination makes the described AS construct a valuable tool in cell line development or antibody engineering.
Table 1. Impact of the different elements of the SPLICELECT™ construct on the cell surface display and secretion
Material and methods
Cloning
Except otherwise stated, all kits and enzymes were used according to manufacturer protocols. All PCRs were performed using the Phusion® DNA Polymerase (New England Biolabs), dNTPs mix (10 mM for each dNTP; Invitrogen, Carlsbad, CA, USA) and primers synthesized at Microsynth (Balgach, Switzerland) or Operon (Ebersberg, Germany). PCR fragments were cleaned prior to digestion with NucleoSpin® Gel and PCR Clean-up kit (Macherey-Nagel). Primers annealing was performed the same way as a PCR, but without template in the reaction mix.
Restriction digests were performed with New England Biolabs enzymes. After digestion, the backbone was treated with calf intestinal alkaline phosphatase (New England Biolabs).
Gel electrophoresis was performed using 1–2% agarose gels, prepared with UltraPureTM Agarose (Invitrogen) and 1X Tris Acetic Acid EDTA buffer (TAE, pH 8.3; Bio RAD) and stained with Gel Red Dye (Biotum). The bands of interests were cut out from the agarose gel and purified using the Gel and PCR clean-up kit (Macherey-Nagel). Ligations were performed with the T4 DNA ligase (New England Biolabs). Transformation were performed in One Shot® TOP 10 Competent E. coli (Life Technologies) and bacteria were grown with ampicillin or kanamycin (Sigma-Aldrich). Plasmid preparations were performed using the NucleoSpin Plasmid or NucleoBond Xtra Midi kits (Macherey Nagel) for minipreps and midipreps, respectively. Plasmid sequences were confirmed by Sanger sequencing at Fasteris (Plan-les-Ouates, Switzerland).
Complementarity-determining region (CDR) residues were mutated to alanine by site-directed mutagenesis using methylated plasmids (CpG Methyltransferase (M.SssI), New England Biolabs) and primers specific for the desired mutations. PCRs were performed using PfuUltra II Hotstart PCR Master Mix (Agilent, Cat # 600850) in a 96-well plate. Competent E. coli (XL1-blue) cells prepared with the Mix & Go E. coli Transformation Kit & Buffer Set (Zymo Research) were transformed with each PCR product and plated on LB Ampicillin plates. DNA minipreps were prepared using the Plasmid Miniprep96 Kit (Millipore).
Details regarding the cloning of the different constructs are provided in the supplementary data section (supplementary Tables 1, 2 and 3).
Northern blot
Northern blot was performed at Merck’s biosafety testing services facility (Glasgow, UK). Total RNA was prepared using a QIAGEN RNeasy Midi-Kit. After treatment with DNase 1 (DNA-Free, Ambion), samples were diluted in glyoxal loading buffer, heated at 50°C for 40 min, loaded onto a 1.2% agarose Glyoxal/dimethyl sulfoxide (DMSO) denaturing gel (NorthernMax-Gly Kit, Ambion) and run in Glyoxal/DMSO gel running buffer. The RNA marker lanes were excised and stained with ethidium bromide. The gel was incubated in 0.05 N NaOH, rinsed with diethyl pyrocarbonate-treated water and transferred by capillary blotting onto nylon hybridization membrane. The membrane was hybridized overnight in 50% formamide at 42°C with a molecular probe specific for the heavy chain of IgG1 present in the AS construct (radiolabelled 860 bp PCR DNA fragment amplified from the reference plasmid and agarose gel purified, radiolabelled to high specific activity with 32P by random priming). Following hybridization, the membrane was washed under conditions of high stringency (0.1 x SSC/0.1% sodium dodecyl sulfate at 65°C) and exposed to X-ray film.
RT-PCR + sequencing
RT-PCR followed by Sanger sequencing was performed at Microsynth (Balgach, Switzerland). RNA was isolated using the RNeasy Mini Kit (Qiagen). RNA isolations were quantified using RiboGreen. cDNA was synthesized using the specific primer PCR_01_R01 using the QuantiTect Reverse Transcription kit (Qiagen). PCR was performed using the primers PCR_01_F01 and PCR_cDNA_01_R02 with the HiFi HotStart polymerase (KAPA). PCR products were cloned in the Zero Blunt® TOPO® PCR Cloning Kit (Life Technologies). Ten single colonies were Sanger sequenced using the primers M13 and M13r.
qPCR
qPCR was performed at Microsynth (Balgach, Switzerland). RNA was isolated with the RNeasy Mini kit (Qiagen) and quantified with Quant-iT RiboGreen RNA Quantitation Reagent (ThermoFisher). cDNA was synthesized with QuantiTect kit (Qiagen). The following probes and primers were used: 111_spl22.3_short_PROBE1, 111_spl22.3_short_FW3 and 111_spl22.3_short_REV2 for the short splice transcript and 111_spl22.6_long_PROBE1, 111_spl22.3_short_FW3 and 111_spl22.3_short_REV2 for the long transcript. The qPCR Probe 2x LyoCake Master mix (MyPols) was used for amplification in a Corbet Rotorgene 6000 thermocycler, 2 min at 50°C, 10 min at 95°C followed by 50 cycles of 15 sec at 95°C and 1 min at 65°C.
Cell culture
Suspension CHO-S cells were routinely cultivated in PowerCHO2 medium, supplemented with glutamine in shake flasks, under agitation at 37°C, with humidity and 5% CO2. For batch cultures, recombinant pools were seeded in TubeSpins bioreactor 50 (tubespins, TPP) at a cell density of 0.5 × 10⁶ cells/mL in supplemented growth medium (PowerCHO2, 2 mM L-Glutamine, 8 mM Glutamax (Life Technologies), 15% Efficient Feed A (Life Technologies), 15% Efficient Feed B (Life Technologies)). For fed-batch cultures, clones were seeded in tubespins at a cell density of 0.5 × 10⁶ cells/mL in growth medium (PowerCHO2, 2 mM L-glutamine) and industrial feed solutions were added on a daily basis.HEK293 EBNA cells (ATCC-CRL-10852) were maintained in suspension at 37°C under 5–8% CO2 conditions in EX-CELL® 293 serum-free (Sigma-Aldrich, cat#14571C) supplemented with 10 mM Glutamine and 1% of Pluronic F-68 (Thermo Fischer, cat# 24040032).
Transfections
Transfections were performed using polyethyleneimine (JetPEI®, Polyplus-transfection) in tubespin. Cells were seeded at a density of 2 × 10⁶ cells/mL in 5 mL of transfection medium (e.g., OptiMEM (#31985-047, Invitrogen)). A JetPEI®:DNA complex was added to the cells in a weight ratio of 3 (µg/µg). Final DNA concentration in the cell suspension was 2.5 µg/mL. After 5-h incubation at 37°C under shaking (200 rpm), 5 mL of fresh culture medium were added to the cell suspension. Then, the cells were incubated on a shaken platform at 37°C, 5% CO2 and 80% humidity.
Stable transfected CHO cells were generated by co-transfection (see above) of the alternative splicing constructs together with two proprietary vectors for the expression of the protein providing resistance against an antibiotic, respectively. One day after transfection the cells were seeded in 96-well plates in a selective medium containing the two antibiotics at a concentration allowing the growth of stable pools. After 14 days of selection under static conditions, 15 producing stable pools were picked from the wells and expanded into tubespins.
HEK 293EBNA cells were transiently transfected with linear polyethyleneimine in 96-well plate. Five days after transfection, affinity purification was performed in batch mode in 96-well plate with Protein A. Expression yields were evaluated by measuring optical density at 280 nm and correcting with the construct’s extinction coefficient.
Surface staining
Surface staining of the cells was performed the day after the transfection. A total of 1 × 10⁵ cells were transferred to a round bottom well of a 96-well plate. The cells were washed twice with washing buffer (2% fetal bovine serum in phosphate-buffered saline) and then resuspended in 100 µL washing buffer containing the detection antibody. The specific detection of the kappa light chain was performed using a mouse anti-human kappa light chain allophycocyanin (APC)-labeled antibody (#561323, BD Pharmingen), excited by a red laser (640 nm) and detected in the spectral range 661/19 nm. Both heavy chain and scFv-Fc were detected using PE-conjugated goat anti-human Fc gamma specific antibody (#12-4998-82, eBioscience) excited by a blue laser (488 nm) and detected in the spectral range 583/26 nm and the scFv-Fc was detected specifically using a fluorescein isothiocyanate-labeled Protein A (#P5145, Sigma) excited at 488 nm by a blue laser and detected in the spectral range 525/30. After 20 min incubation in the dark at room temperature, the cells were washed once in washing buffer and resuspended in 200 µL of washing buffer for flow cytometric analysis. Alternatively, soluble targets were used: the cells were resuspended in 100 µL of a mix of biotinylated Target1 and His-tagged Target2. After 20 min incubation in the dark at room temperature, the cells were washed twice with washing buffer and resuspended in 100 µL of a mix containing streptavidin conjugated with APC (#554067, BD Pharmingen) and an anti-His-Tag antibody labeled with PE (#IC050P, RD Systems). After 20 min incubation in the dark at room temperature, the cells were washed once in washing buffer and resuspended in 200 µL for flow cytometric analysis. The cells were analyzed with a Guava flow cytometer (Merck Millipore) or with a FACSCalibur (Becton Dickinson)
Titer determination and analysis of protein quality attributes
The expression level of secreted molecules was measured on days 4–6 after transfection for transient expression or after a fed-batch of 14 days for stable cell populations using the Octet QK instrument (Fortebio) and protein A biosensors. For quality attribute determination, batch or fed-batches culture supernatants were harvested on day 14 by centrifugation and filtered using a 0.2 µm syringe filter (#99722. TPP). The crude supernatants were either directly analyzed or purified using Streamline Protein A beads (# 17-1281-02, GE). The proteins were analyzed using the Caliper LabChip GXII protein assay. The different species were identified according to their molecular weight and the fraction of each product was determined.
Cell sorting
Transfection and selection of stable transfectants were performed as described above. After 14 days of selection under static conditions, all stable transfectants were collected, pooled and passaged under dynamic conditions (orbital shaking) for a week. Single cell sorting was performed using a FACSAria II by gating on living cells excluding cell doublets by pulse processing.
Alanine scan
To map the paratope of test antibody onto its target, 1 day after transfection, live cells were stained with an anti-Human IgG (Fc)-PE (#12-4998-82, eBioscience) and co-incubated with biotinylated recombinant soluble target and stained by streptavidin-APC at room temperature. Live cells were gated on the basis of forward and side scatter.
The test antibody was modeled using the “prediction” tool of the Bioluminate software (Schrödinger, USA).
Conflict of interest
All authors were employees of Glenmark Pharmaceuticals SA at the time the work presented here was conducted.
Supplemental Material
Download MS Word (114 KB)Acknowledgements
We thank Ms Emilie Hily, Ms Vanessa Vrecsics, M Farid Mosbaoui and M Boris Zuber for excellent laboratory work; we thank Dr. Dean Thomas for helpful discussions; we thank Dr. Garcia Miguel for performing the cell sorting activities; we thank Dr. Sergey Yakushev and Dr. Christoph Grünig from Microsynth SA for the reverse transcription and qPCR work.
Supplementary material
Supplemental data for this article can be accessed on the publisher’s website.
Related Research Data
References
- Wurm FM. Production of recombinant protein therapeutics in cultivated mammalian cells. Nat Biotechnol. 2004;22:1393–14. doi:https://doi.org/10.1038/nbt1026.
- Zhu J, Hatton D. New mammalian expression systems. Adv Biochem Eng Biotechnol. 2018;165:9–50. doi:https://doi.org/10.1007/10_2016_55.
- Kumar N, Borth N. Flow-cytometry and cell sorting: an efficient approach to investigate productivity and cell physiology in mammalian cell factories. Methods. 2012;56:366–74. doi:https://doi.org/10.1016/j.ymeth.2012.03.004.
- Priola JJ, Calzadilla N, Baumann M, Borth N, Tate CG, Betenbaugh MJ. High-throughput screening and selection of mammalian cells for enhanced protein production. Biotechnol J. 2016;11:853–65. doi:https://doi.org/10.1002/biot.v11.7.
- Li C, Wei L, Jiang H, Shan L, Li X, Lu N, Wang G, Li D. Stable cell line of human SH-SY5Y uniformly expressing TWIK-related acid-sensitive potassium channel and eGFP fusion. Appl Biochem Biotechnol. 2014;172:3253–62. doi:https://doi.org/10.1007/s12010-014-0768-7.
- Mancia F, Patel SD, Rajala MW, Scherer PE, Nemes A, Schieren I, Hendrickson WA, Shapiro L. Optimization of protein production in mammalian cells with a coexpressed fluorescent marker. Structure. 2004;12:1355–60. doi:https://doi.org/10.1016/j.str.2004.06.012.
- Freimark D, Jerome V, Freitag R. A GFP-based method facilitates clonal selection of transfected CHO cells. Biotechnol J. 2010;5:24–31. doi:https://doi.org/10.1002/biot.200800264.
- Knox R, Nettleship JE, Chang VT, Hui ZK, Santos AM, Rahman N, Ho L-P, Owens RJ, Davis SJ. A streamlined implementation of the glutamine synthetase-based protein expression system. BMC Biotechnol. 2013;13:74. doi:https://doi.org/10.1186/1472-6750-13-74.
- Sleiman RJ, Gray PP, McCall MN, Codamo J, Sunstrom NA. Accelerated cell line development using two-color fluorescence activated cell sorting to select highly expressing antibody-producing clones. Biotechnol Bioeng. 2008;99:578–87. doi:https://doi.org/10.1002/(ISSN)1097-0290.
- Oberbek A, Matasci M, Hacker DL, Wurm FM. Generation of stable, high-producing CHO cell lines by lentiviral vector-mediated gene transfer in serum-free suspension culture. Biotechnol Bioeng. 2011;108:600–10. doi:https://doi.org/10.1002/bit.22968.
- Albano CR, Randers-Eichhorn L, Bentley WE, Rao G. Green fluorescent protein as a real time quantitative reporter of heterologous protein production. Biotechnol Prog. 1998;14:351–54. doi:https://doi.org/10.1021/bp970121b.
- Meng YG, Liang J, Wong WL, Chisholm V. Green fluorescent protein as a second selectable marker for selection of high producing clones from transfected CHO cells. Gene. 2000;242:201–07. doi:https://doi.org/10.1016/S0378-1119(99)00524-7.
- Wilke S, Krausze J, Gossen M, Groebe L, Jager V, Gherardi E, van den Heuvel J, Büssow K. Glycoprotein production for structure analysis with stable, glycosylation mutant CHO cell lines established by fluorescence-activated cell sorting. Protein Sci. 2010;19:1264–71. doi:https://doi.org/10.1002/pro.390.
- Liu X, Constantinescu SN, Sun Y, Bogan JS, Hirsch D, Weinberg RA, Lodish HF. Generation of mammalian cells stably expressing multiple genes at predetermined levels. Anal Biochem. 2000;280:20–28. doi:https://doi.org/10.1006/abio.2000.4478.
- DeMaria CT, Cairns V, Schwarz C, Zhang J, Guerin M, Zuena E, Estes S, Karey KP. Accelerated clone selection for recombinant CHO cells using a FACS-based high-throughput screen. Biotechnol Prog. 2007;23:465–72. doi:https://doi.org/10.1021/bp060298i.
- Gaines P, Wojchowski DM. pIRES-CD4t, a dicistronic expression vector for MACS- or FACS-based selection of transfected cells. Biotechniques. 1999;26:683–88. doi:https://doi.org/10.2144/99264st04.
- Helman D, Toister-Achituv M, Bar-Shimon M, Cohen B, Otmi I, Berger N, Kalimi D, Kimalov B, Medina T, Sapir A, et al. Novel membrane-bound reporter molecule for sorting high producer cells by flow cytometry. Cytometry A. 2014;85:162–68. doi:https://doi.org/10.1002/cyto.a.v85.2.
- Jarnigan K, Zhou H. rapid, parallel identification of cell lines. WO 01/57212 Al. 2001.
- Cairns VR, DeMaria CT, Poulin F, Sancho J, Liu P, Zhang J, Campos-Rivera J, Karey KP, Estes S. Utilization of non-AUG initiation codons in a flow cytometric method for efficient selection of recombinant cell lines. Biotechnol Bioeng. 2011;108:2611–22. doi:https://doi.org/10.1002/bit.v108.11.
- Liu HS, Jan MS, Chou CK, Chen PH, Ke NJ. Is green fluorescent protein toxic to the living cells? Biochem Biophys Res Commun. 1999;260:712–17. doi:https://doi.org/10.1006/bbrc.1999.0954.
- Bohm E, Voglauer R, Steinfellner W, Kunert R, Borth N, Katinger H. Screening for improved cell performance: selection of subclones with altered production kinetics or improved stability by cell sorting. Biotechnol Bioeng. 2004;88:699–706. doi:https://doi.org/10.1002/bit.v88:6.
- Borth N, Zeyda M, Kunert R, Katinger H. Efficient selection of high-producing subclones during gene amplification of recombinant Chinese hamster ovary cells by flow cytometry and cell sorting. Biotechnol Bioeng. 2000;71:266–73. doi:https://doi.org/10.1002/1097-0290(2000)71:4<266::AID-BIT1016>3.0.CO;2-2.
- Gray F, Kenney JS, Dunne JF. Secretion capture and report web: use of affinity derivatized agarose microdroplets for the selection of hybridoma cells. J Immunol Methods. 1995;182:155–63. doi:https://doi.org/10.1016/0022-1759(94)00319-R.
- Holmes P, Al-Rubeai M. Improved cell line development by a high throughput affinity capture surface display technique to select for high secretors. J Immunol Methods. 1999;230:141–47. doi:https://doi.org/10.1016/S0022-1759(99)00181-7.
- Manz R, Assenmacher M, Pfluger E, Miltenyi S, Radbruch A. Analysis and sorting of live cells according to secreted molecules, relocated to a cell-surface affinity matrix. Proc Natl Acad Sci U S A. 1995;92:1921–25. doi:https://doi.org/10.1073/pnas.92.6.1921.
- Rakestraw JA, Aird D, Aha PM, Baynes BM, Lipovsek D. Secretion-and-capture cell-surface display for selection of target-binding proteins. Protein Eng Des Sel. 2011;24:525–30. doi:https://doi.org/10.1093/protein/gzr008.
- Kenney JS, Gray F, Ancel MH, Dunne JF. Production of monoclonal antibodies using a secretion capture report web. Biotechnology (N Y). 1995;13:787–90. doi:https://doi.org/10.1038/nbt0895-787.
- Hammill L, Welles J, Carson GR. The gel microdrop secretion assay: identification of a low productivity subpopulation arising during the production of human antibody in CHO cells. Cytotechnology. 2000;34:27–37. doi:https://doi.org/10.1023/A:1008186113245.
- Powell KT, Weaver JC. Gel microdroplets and flow cytometry: rapid determination of antibody secretion by individual cells within a cell population. Biotechnology (N Y). 1990;8:333–37. doi:https://doi.org/10.1038/nbt0490-333.
- Caron AW, Nicolas C, Gaillet B, Ba I, Pinard M, Garnier A, Massie B, Gilbert R. Fluorescent labeling in semi-solid medium for selection of mammalian cells secreting high-levels of recombinant proteins. BMC Biotechnol. 2009;9:42. doi:https://doi.org/10.1186/1472-6750-9-42.
- Lee C, Ly C, Sauerwald T, Kelly T, Moore G. High-throughput screening of cell lines expressing monoclonal antibodies development of an immunoprecipitation-based method. Bioprocess Int. 2006;4:32–35.
- Pichler J, Hesse F, Wieser M, Kunert R, Galosy SS, Mott JE, Borth N. A study on the temperature dependency and time course of the cold capture antibody secretion assay. J Biotechnol. 2009;141:80–83. doi:https://doi.org/10.1016/j.jbiotec.2009.03.001.
- Brezinsky SC, Chiang GG, Szilvasi A, Mohan S, Shapiro RI, MacLean A, Sisk W, Thill G. A simple method for enriching populations of transfected CHO cells for cells of higher specific productivity. J Immunol Methods. 2003;277:141–55. doi:https://doi.org/10.1016/S0022-1759(03)00108-X.
- Ye J, Alvin K, Latif H, Hsu A, Parikh V, Whitmer T, Tellers M, de la Cruz Edmonds MC, Ly J, Salmon P, et al. Rapid protein production using CHO stable transfection pools. Biotechnol Prog. 2010;26:1431–37. doi:https://doi.org/10.1002/btpr.469.
- McKinney KL, Dilwith R, Belfort G. Manipulation of heterogeneous hybridoma cultures for overproduction of monoclonal antibodies. Biotechnol Prog. 1991;7:445–54. doi:https://doi.org/10.1021/bp00011a010.
- Chen CP, Hsieh YT, Prijovich ZM, Chuang HY, Chen KC, Lu WC, Tseng Q, Leu Y-L, Cheng T-L, Roffler SR, et al. ECSTASY, an adjustable membrane-tethered/soluble protein expression system for the directed evolution of mammalian proteins. Protein Eng Des Sel. 2012;25:367–75. doi:https://doi.org/10.1093/protein/gzs033.
- Chuang KH, Hsieh YC, Chiang IS, Chuang CH, Kao CH, Cheng TC, Wang Y-T, Lin -W-W, Chen B-M, Roffler SR, et al. High-throughput sorting of the highest producing cell via a transiently protein-anchored system. PLoS One. 2014;9:e102569. doi:https://doi.org/10.1371/journal.pone.0102569.
- Zhou Y, Wang J, Zhou I, Lou H, Li CZ, Chen ZR, Zhang ZH, Liu S, Wu S, Tan W, Jiang S, Zhou C. Simultaneous expression of displayed and secreted antibodies for antibody screen. PLoS One. 2013;8:e80005.
- Puligedda RD, Sharma R, Al-Saleem FH, Kouiavskaia D, Velu AB, Kattala CD, Prendergast GC, Lynch DR, Chumakov K, Dessain SK, et al. Capture and display of antibodies secreted by hybridoma cells enables fluorescent on-cell screening. MAbs. 2019;11:546–58. doi:https://doi.org/10.1080/19420862.2019.1574520.
- Bouquin T, Rasmussen PB, Bertilsson PA, Okkels JS. Regulated readthrough: a new method for the alternative tagging and targeting of recombinant proteins. J Biotechnol. 2006;125:516–28. doi:https://doi.org/10.1016/j.jbiotec.2006.03.028.
- Chakrabarti L, Zhuang L, Roy G, Bowen MA, Dall’Acqua WF, Hawley-Nelson P, Marelli M. Amber suppression coupled with inducible surface display identifies cells with high recombinant protein productivity. Biotechnol Bioeng. 2019;116:793–804. doi:https://doi.org/10.1002/bit.26892.
- Jostock T. Cell surface display of polypeptide isoforms by stop codon readthrough. WO 2010/022961 Al. 2010.
- Lang S, Drewello D, Wichter J, Nommay A, Wilms B, Knopf HP, Jostock T. Surface display vectors for selective detection and isolation of high level antibody producing cells. Biotechnol Bioeng. 2016;113:2386–93. doi:https://doi.org/10.1002/bit.26000.
- Pieper K, Grimbacher B, Eibel H. B-cell biology and development. J Allergy Clin Immunol. 2013;131:959–71. doi:https://doi.org/10.1016/j.jaci.2013.01.046.
- Major JG Jr., Davis FM, Liou RS, Chang TW. Structural features of the extracellular portion of membrane-anchoring peptides on membrane-bound immunoglobulins. Mol Immunol. 1996;33:179–87. doi:https://doi.org/10.1016/0161-5890(95)00109-3.
- Peterson ML, Bryman MB, Peiter M, Cowan C. Exon size affects competition between splicing and cleavage-polyadenylation in the immunoglobulin mu gene. Mol Cell Biol. 1994;14:77–86. doi:https://doi.org/10.1128/MCB.14.1.77.
- Sperling J, Azubel M, Sperling R. Structure and function of the Pre-mRNA splicing machine. Structure. 2008;16:1605–15. doi:https://doi.org/10.1016/j.str.2008.08.011.
- Chasin LA. Searching for splicing motifs. Adv Exp Med Biol. 2007;623:85–106.
- Orengo JP, Bundman D, Cooper TA. A bichromatic fluorescent reporter for cell-based screens of alternative splicing. Nucleic Acids Res. 2006;34:e148. doi:https://doi.org/10.1093/nar/gkl967.
- Black DL. Mechanisms of alternative pre-messenger RNA splicing. Annu Rev Biochem. 2003;72:291–336. doi:https://doi.org/10.1146/annurev.biochem.72.121801.161720.
- Gallego-Paez LM, Bordone MC, Leote AC, Saraiva-Agostinho N, Ascensao-Ferreira M, Barbosa-Morais NL. Alternative splicing: the pledge, the turn, and the prestige: the key role of alternative splicing in human biological systems. Hum Genet. 2017;136:1015–42.
- Hertel KJ. Combinatorial control of exon recognition. J Biol Chem. 2008;283:1211–15. doi:https://doi.org/10.1074/jbc.R700035200.
- Keren H, Lev-Maor G, Ast G. Alternative splicing and evolution: diversification, exon definition and function. Nat Rev Genet. 2010;11:345–55. doi:https://doi.org/10.1038/nrg2776.
- Matera AG, Wang Z. A day in the life of the spliceosome. Nat Rev Mol Cell Biol. 2014;15:108–21. doi:https://doi.org/10.1038/nrm3742.
- Matlin AJ, Clark F, Smith CW. Understanding alternative splicing: towards a cellular code. Nat Rev Mol Cell Biol. 2005;6:386–98. doi:https://doi.org/10.1038/nrm1645.
- Nilsen TW, Graveley BR. Expansion of the eukaryotic proteome by alternative splicing. Nature. 2010;463:457–63. doi:https://doi.org/10.1038/nature08909.
- Wang Z, Burge CB. Splicing regulation: from a parts list of regulatory elements to an integrated splicing code. RNA. 2008;14:802–13. doi:https://doi.org/10.1261/rna.876308.
- Cooper TA, Ordahl CP. A single cardiac troponin T gene generates embryonic and adult isoforms via developmentally regulated alternate splicing. J Biol Chem. 1985;260:11140–48.
- Endl J, Kopetzki E, Ploettner O, Schwarz U, Tiefenthaler G. polypeptide producing cells. US 2009/0311725 A1. 2009.
- Waldmeier L, Hellmann I, Gutknecht CK, Wolter FI, Cook SC, Reddy ST, Grawunder U, Beerli RR. Transpo-mAb display: transposition-mediated B cell display and functional screening of full-length IgG antibody libraries. MAbs. 2016;8:726–40. doi:https://doi.org/10.1080/19420862.2016.1160990.
- Horlick RA, Macomber JL, Bowers PM, Neben TY, Tomlinson GL, Krapf IP, Dalton JL, Verdino P, King DJ. Simultaneous surface display and secretion of proteins from mammalian cells facilitate efficient in vitro selection and maturation of antibodies. J Biol Chem. 2013;288:19861–69. doi:https://doi.org/10.1074/jbc.M113.452482.
- Bowers PM, Horlick RA, Kehry MR, Neben TY, Tomlinson GL, Altobell L, Zhang X, Macomber JL, Krapf IP, Wu BF, et al. Mammalian cell display for the discovery and optimization of antibody therapeutics. Methods. 2014;65:44–56. doi:https://doi.org/10.1016/j.ymeth.2013.06.010.
- Parola C, Neumeier D, Friedensohn S, Csepregi L, Di Tacchio M, Mason DM, Reddy ST. Antibody discovery and engineering by enhanced CRISPR-Cas9 integration of variable gene cassette libraries in mammalian cells. MAbs. 2019;11:1367–80.
- Parthiban K, Perera RL, Sattar M, Huang Y, Mayle S, Masters E, Griffiths D, Surade S, Leah R, Dyson MR, et al. A comprehensive search of functional sequence space using large mammalian display libraries created by gene editing. MAbs. 2019;11:884–98. doi:https://doi.org/10.1080/19420862.2019.1618673.
- Lin YC, Chen BM, Lu WC, Su CI, Prijovich ZM, Chung WC, Wu P-Y, Chen K-C, Lee I-C, Juan T-Y, et al. The B7-1 cytoplasmic tail enhances intracellular transport and mammalian cell surface display of chimeric proteins in the absence of a linear ER export motif. PLoS One. 2013;8:e75084. doi:https://doi.org/10.1371/journal.pone.0075084.
- Chou WC, Liao KW, Lo YC, Jiang SY, Yeh MY, Roffler SR. Expression of chimeric monomer and dimer proteins on the plasma membrane of mammalian cells. Biotechnol Bioeng. 1999;65:160–69. doi:https://doi.org/10.1002/(SICI)1097-0290(19991020)65:2<160::AID-BIT5>3.0.CO;2-U.
- Liao KW, Chou WC, Lo YC, Roffler SR. Design of transgenes for efficient expression of active chimeric proteins on mammalian cells. Biotechnol Bioeng. 2001;73:313–23. doi:https://doi.org/10.1002/bit.1064.
- Baeza-Delgado C, Marti-Renom MA, Mingarro I. Structure-based statistical analysis of transmembrane helices. Eur Biophys J. 2013;42:199–207. doi:https://doi.org/10.1007/s00249-012-0813-9.
- Fallot S, Ben Naya R, Hieblot C, Mondon P, Lacazette E, Bouayadi K, Kharrat A, Touriol C, Prats H. Alternative-splicing-based bicistronic vectors for ratio-controlled protein expression and application to recombinant antibody production. Nucleic Acids Res. 2009;37:e134. doi:https://doi.org/10.1093/nar/gkp716.
- Dominski Z, Kole R. Selection of splice sites in pre-mRNAs with short internal exons. Mol Cell Biol. 1991;11:6075–83. doi:https://doi.org/10.1128/MCB.11.12.6075.
- Dominski Z, Kole R. Cooperation of pre-mRNA sequence elements in splice site selection. Mol Cell Biol. 1992;12:2108–14. doi:https://doi.org/10.1128/MCB.12.5.2108.
- Valencia P, Dias AP, Reed R. Splicing promotes rapid and efficient mRNA export in mammalian cells. Proc Natl Acad Sci U S A. 2008;105:3386–91. doi:https://doi.org/10.1073/pnas.0800250105.
- Amara SG, Evans RM, Rosenfeld MG. Calcitonin/calcitonin gene-related peptide transcription unit: tissue-specific expression involves selective use of alternative polyadenylation sites. Mol Cell Biol. 1984;4:2151–60. doi:https://doi.org/10.1128/MCB.4.10.2151.
- Millevoi S, Vagner S. Molecular mechanisms of eukaryotic pre-mRNA 3ʹ end processing regulation. Nucleic Acids Res. 2010;38:2757–74. doi:https://doi.org/10.1093/nar/gkp1176.
- Danner D, Leder P. Role of an RNA cleavage/poly(A) addition site in the production of membrane-bound and secreted IgM mRNA. Proc Natl Acad Sci U S A. 1985;82:8658–62. doi:https://doi.org/10.1073/pnas.82.24.8658.
- Fusil F, Calattini S, Amirache F, Mancip J, Costa C, Robbins JB, Douam F, Lavillette D, Law M, Defrance T, et al. A lentiviral vector allowing physiologically regulated membrane-anchored and secreted antibody expression depending on b-cell maturation status. Mol Ther. 2015;23:1734–47. doi:https://doi.org/10.1038/mt.2015.148.
- Kim JM, Kim JS, Oh SM, Yoon JS, Baek KH, Chung SI, Park D, Yoon Y. expression vector for animal cell. US 7,422,874 B2. 2008.
- Dorai H, Corisdeo S, Ellis D, Kinney C, Chomo M, Hawley-Nelson P, Moore G, Betenbaugh MJ, Ganguly S. Early prediction of instability of Chinese hamster ovary cell lines expressing recombinant antibodies and antibody-fusion proteins. Biotechnol Bioeng. 2012;109:1016–30. doi:https://doi.org/10.1002/bit.24367.
- Cooper TA. Use of minigene systems to dissect alternative splicing elements. Methods. 2005;37:331–40. doi:https://doi.org/10.1016/j.ymeth.2005.07.015.
- Plotkin JB, Kudla G. Synonymous but not the same: the causes and consequences of codon bias. Nat Rev Genet. 2011;12:32–42. doi:https://doi.org/10.1038/nrg2899.
- Nufer O, Guldbrandsen S, Degen M, Kappeler F, Paccaud JP, Tani K, Hauri H-P. Role of cytoplasmic C-terminal amino acids of membrane proteins in ER export. J Cell Sci. 2002;115:619–28.
- Bell MV, Cowper AE, Lefranc MP, Bell JI, Screaton GR. Influence of intron length on alternative splicing of CD44. Mol Cell Biol. 1998;18:5930–41. doi:https://doi.org/10.1128/MCB.18.10.5930.
- Kandul NP, Noor MA. Large introns in relation to alternative splicing and gene evolution: a case study of Drosophila bruno-3. BMC Genet. 2009;10:67. doi:https://doi.org/10.1186/1471-2156-10-67.