
ABSTRACT
Glucose-dependent insulinotropic polypeptide (GIP) is an incretin hormone involved in regulating glucose and lipid metabolism. GIP receptor (GIPR) antagonism is believed to offer therapeutic potential for various metabolic diseases. Pharmacological intervention of GIPR, however, has limited success due to lack of effective antagonistic reagents. Previously we reported the discovery of two mouse anti-murine GIPR monoclonal antibodies (mAbs) with distinctive properties in rodent models. Here, we report the detailed structural and biochemical characterization of these two antibodies, mAb1 and mAb2. In vitro and in vivo characterizations demonstrated mAb2 is a full GIPR antagonistic antibody and mAb1 is a non-neutralizing GIPR binder. To understand the molecular basis of these two antibodies, we determined the co-crystal structures of GIPR extracellular domain in complex with mAb1 and with mAb2 at resolutions of 2.1 and 2.6 Å, respectively. While the non-neutralizing mAb1 binds to GIPR without competing with the ligand peptide, mAb2 not only partially occludes the ligand peptide binding, but also recognizes the GIPR C-terminal stalk region in a helical conformation that acts as a molecular mimic of the ligand peptide and locks GIPR in a novel auto-inhibited state. Furthermore, administration of mAb2 in diet-induced obesity mice for 7 weeks leads to both reduction in body weight gain and improvement of metabolic profiles. In contrast, mAb1 has no effect on body weight or other metabolic improvement. Together, our studies reveal the unique molecular mechanism of action underlying the superior antagonistic activity of mAb2 and signify the promising therapeutic potential of effective GIPR antagonism for the treatment of metabolic disorders.
Introduction
Glucose-dependent insulinotropic polypeptide (GIP) and glucagon-like peptide-1 (GLP-1), secreted by the gut in response to food intake, are called incretin hormones due to their ability to increase glucose-stimulated insulin secretion.Citation1,Citation2 They are important regulators of glucose and lipid metabolism, appetite, and body weight. While GLP-1-based therapeutics, such as long-acting GLP-1 analogs, have now been developed for the treatment of type 2 diabetes and obesity,Citation3 GIP has received less attention. The concept of using GIPR antagonism to treat obesity has been discussed for more than a decade, but pharmacological approaches have not yielded satisfactory data,Citation4 possibly due to the fact that only weak GIP antagonist peptides with short half-life are available.
GIP is a 42-amino-acid peptide secreted by the K-cells, which are located in the upper tract of the small intestine, duodenum, and jejunum. Similar to GLP-1, GIP is quickly inactivated by DPP-4 mediated cleavage post secretion.Citation5 The signaling of GIP is initiated after binding to its receptor, GIPR, a Gs-coupled class B G-protein-coupled receptor (GPCR) that shares sequence similarity with GLP-1 receptor (GLP-1R) and glucagon receptor (GCGR). GIPR is predominantly expressed in the pancreatic beta cells, the adipose tissue, and certain regions of the brain.Citation1,Citation6 The binding of GIP to GIPR leads to the activation of Gαs and stimulation of adenylate cyclase, which is coupled to the increases in cAMP level.Citation1,Citation6 In pancreas, GIP stimulates glucose-dependent insulin secretion, whereas in adipose tissues, GIP facilitates insulin’s ability to promote fatty acid uptake and incorporation into adipose tissues,Citation7,Citation8 and demonstrates insulin-like lipogenic effects by increasing free fatty acid re-esterification and stimulating lipolysis.Citation9 Moreover, it has been shown that GIP stimulates glucagon secretion, which might contribute to the postprandial hyperglycemia in patients with type 2 diabetes.Citation10–Citation12
Recently, several human genetics studies have associated GIPR with body mass index (BMI), and multiple single nucleotide polymorphisms (SNPs) (rs2287019, rs10423928, rs1800437, rs1167664) have been identified in various ethnic populations.Citation13–Citation16 In addition, even though GIPR knockout mice exhibit similar growth to the wild type under the chow diet, they are resistant to high fat diet-induced obesity and insulin resistance.Citation17 While human genetics and mouse models demonstrate that GIPR loss of function is associated with lower body weight, pharmacological evidence has been weak and controversial so far. Mild in vivo efficacy has been reported with several GIPR antagonists (For review see ref.).Citation18 However, a widely used peptide antagonist, (pro3)GIP, is a weak antagonist with short in vivo half-life and can behave as a weak GIPR agonist in certain situations.Citation19
GIPR, along with other subfamily members of the class B GPCRs, holds a signature extracellular domain (ECD) of ~140 residues at the N-terminus that is essential for binding to the peptide hormone and a canonical 7-helix transmembrane domain at the C-terminus. Binding of the peptide ligand has been proposed as a two-step process wherein the C-terminal part of the peptide binds to the ECD first and the N-terminus of the peptide follows by inserting into the ligand binding pocket formed by the transmembrane (TM) helices of the GPCR.Citation20 Our understanding of the receptor activation for class B GPCRs has been greatly advanced with the availability of various crystal and cryo-electron microscope (cryo-EM) structures. Multiple structures of class B GPCR N-terminal ECD in complex with short peptide hormones have been reported.Citation21 In addition, structures of the transmembrane domain of GCGR and GLP1-R have been solved that provide snapshots of the configuration of the 7-TM in the presence of a negative allosteric modulator.Citation22–Citation24 Most recently, crystal and cryo-EM structures of the full-length class B GPCR were illustrated for the first time and demonstrated cross-talks between the ECD and 7-TM.Citation25–Citation27
Antibodies targeting GPCRs provide useful tools to interrogate the complex biology of GPCR. Several antibodies against class B GPCR ECD have been described.Citation28–Citation30 In the case of GIPR, co-crystal structures of an antibody gipg013 with GIPR ECD revealed that the antibody binding site overlaps with the cognate peptide binding siteCitation28 and central administration of gipg013 to obese mice leads to lower body weight and food intake.Citation31 Previously we reported that anti-GIPR antibodies co-dosed with glucagon-like peptide-1 receptor (GLP-1R) agonists exhibited enhanced weight loss in non-human primates, providing preclinical validation of a therapeutic potential to treat obesity with anti-GIPR antibodies. In the same study, we also described preliminary proof-of-concept studies of two mouse anti-murine antibodies with distinctive activities in vivo.Citation32 To further understand the underlying molecular mechanism, here we provided in-depth biochemical, cellular, pharmacological and structural characterizations of those two antibodies.
Results
Discovery and characterization of anti-GIPR antibodies
Previously we reported a mouse anti-murine GIPR antibody (muGIPR-Ab, hereafter referred to as mAb2) that showed superior antagonistic activity in a rodent model in contrast to another non-neutralizing antibody (CTL-Ab, hereafter referred to as mAb1).Citation32 We performed further biochemical analysis of these two antibodies. The binding affinity was evaluated using a KinExA assay ( and ) and the bioactivity was measured using a cell-based functional assay which measures GIP-stimulated cAMP production (). In the cell-based cAMP assay, 6 pM mouse GIP (mGIP) was used to ensure close to maximal activity of mGIP, since the EC50 of mGIP is 0.8 pM. As summarized in , mAb1 binds to mouse GIPR with a KD of 144 pM, but does not compete with mouse GIP in the cAMP assay. In comparison, mAb2 is both a high-affinity binder to the mouse GIPR with a KD of 68 pM and a potent antagonist to GIP in the cAMP assay with IC50 of 48 nM. Furthermore, mAb2 is able to completely reverse GIP-induced cAMP production. Interestingly, from the same immunization campaign, we also identified additional binders to GIPR ECD. Two other antibodies, mAb3 and mAb4, also have high affinity to the mouse GIPR with KD of ~80 pM and inhibit GIP-stimulated cAMP production with very high potency (IC50 of 1.7 nM and 3.1 nM, respectively). However, both mAb3 and mAb4 can only partially antagonize the GIP activity with maximal inhibition of 29% and 50%, respectively (Figure S1). We characterized mAb1 as a non-neutralizing GIPR binder, mAb2 as a full antagonist, and mAb3 and mAb4 as partial antagonists to the endogenous ligand GIP. Because of the significant difference in the biochemical activities of mAb1 and mAb2, we decided to focus in vivo and structural studies on these two antibodies.
Figure 1. Characterization of anti-mouse GIPR antibodies. A) and B) Measurement of the equilibrium dissociation constant (KD) of mAb1 and mAb2 binding to the mouse GIPR membrane by KinExA. C) Effects of mAb1 and mAb2 on the GIP-induced cAMP production assay. D) Summary of bioactivity and binding affinity of the two antibodies. E) Acute in vivo effect of antibodies on insulinotropic effect of exogenous [D-Ala2]-GIP (DAGIP) during IPGTT. Blood insulin and glucose levels were measured after IP DAGIP and glucose challenges in C57BL/6 mice treated with vehicle, DAGIP alone, DAGIP with mAb1 or DAGIP with mAb2. Results are expressed as the mean and standard error of the mean. Statistical analysis was performed using one-way with Dunnett’s test for multiple comparisons. *** p < .001, ** p < .01, * p < .05
![Figure 1. Characterization of anti-mouse GIPR antibodies. A) and B) Measurement of the equilibrium dissociation constant (KD) of mAb1 and mAb2 binding to the mouse GIPR membrane by KinExA. C) Effects of mAb1 and mAb2 on the GIP-induced cAMP production assay. D) Summary of bioactivity and binding affinity of the two antibodies. E) Acute in vivo effect of antibodies on insulinotropic effect of exogenous [D-Ala2]-GIP (DAGIP) during IPGTT. Blood insulin and glucose levels were measured after IP DAGIP and glucose challenges in C57BL/6 mice treated with vehicle, DAGIP alone, DAGIP with mAb1 or DAGIP with mAb2. Results are expressed as the mean and standard error of the mean. Statistical analysis was performed using one-way with Dunnett’s test for multiple comparisons. *** p < .001, ** p < .01, * p < .05](/cms/asset/ccd07451-8a03-465a-8a2d-e67627f1b28f/kmab_a_1710047_f0001_oc.jpg)
We measured the acute antagonistic effect of mAb2 in vivo in a pharmacodynamics study. This study tested the antagonistic activities of mAb2 in vivo through an intraperitoneal glucose tolerance test (IPGTT) experiment in C57BL/6 mice by examining its ability to inhibit the insulinotropic effect elicited by exogenous GIP. Serum insulin levels and blood glucose levels were measured 10 min and 30 min, respectively, after glucose and [D-Ala2]-GIP (DAGIP) administration. DAGIP is an enzymatically stable GIP analogue used to ensure prolonged in vivo activity during the treatment period. As expected, intraperitoneal (IP) DAGIP administration resulted in increased blood insulin levels and reduced blood glucose levels (). Treatment with mAb1 did not block the insulinotropic effect after DAGIP administration. Both blood insulin and glucose levels from that group were similar to those from the DAGIP only group. In contrast, mAb2 completely abolished the insulinotropic effect induced by DAGIP, confirming its full antagonistic activity in vivo. Insulin levels were decreased by ~64%, and blood glucose levels were increased by ~63% in comparison to the DAGIP alone group. In the diet-induced obesity (DIO) mice, we observed similar effects showing that mAb2 abolished the insulinotropic effect induced by DAGIP.Citation32 Together, these results demonstrated that mAb2 is a full GIPR-neutralizing antibody in both in vitro and in vivo, whereas mAb1 is a non-neutralizing GIPR binder.
Structure of mouse GIPR ECD with fab1
To probe the molecular insight into the distinctive functional activities demonstrated by mAb1 and mAb2, we crystallized the mouse GIPR ECD in complex with the antigen-binding fragments (Fab) of mAb1 and mAb2. The crystal structure of the binary complex of mouse GIPR ECD with the Fab of mAb1 (Fab1) was determined to 2.1 Å resolution ().
Figure 2. Structure of mouse GIPR with Fab1. A) Overall structure of mouse GIPR ECD in complex with Fab1. The GIPR ECD is shown in cartoon representation and colored in rainbow scheme with N-terminus in blue and C-terminus in red. Fab1 is shown in cartoon representation and colored purple for heavy chain and wheat for light chain. B) and C) Detailed interactions in the interface between GIPR ECD and Fab1. Fab1 surface is colored in wheat. The interface residues are shown in sticks and colored as in A. D) Superposition of GIPR ECD-GIP complex structure (PDB access code: 2QKH) with GIPR ECD-Fab1 structure. Fab1 is shown as surface and colored as in A. GIPR ECD is shown in cyan surface. Superposed GIP peptide is shown as yellow cartoon
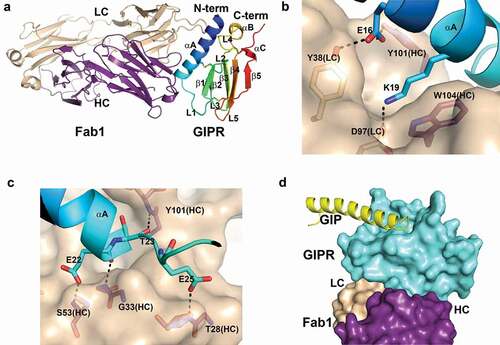
Mouse GIPR ECD adopts an α-β-β-α fold that is common to other class B GPCR ECD structures including GCGR, GLP-1R and human GIPR.Citation33 Fab1 forms extensive interactions with the GIPR ECD fragment, which is consistent with its sub-nM binding affinity. The N-terminal helix αA of GIPR ECD sits in a groove formed by the complementary-determining region (CDR) loops of both the heavy chain (HC) and light chain (LC) of Fab1 ( and Figure S2A). A network of hydrogen bonds and salt bridges dominates the interface between the ECD and Fab1. There is a salt bridge from residues Lys19 of GIPR to Asp97 of the LC CDR3 at the center of the interface. Lys19 also stacks against the side chain of Trp104 of the HC CDR3, forming a cation-pi interaction. Glu16 of GIPR forms hydrogen bonds with the hydroxyl of Tyr38 of LC CDR2 and Tyr101 of HC CDR3, respectively ( and Figure S2A). There are several main-chain hydrogen bond interactions between residues of GIPR and Fab1. As shown in , several hydrogen bonds are formed at the interface, including hydrogen bonds from Glu22 of GIPR to the amide of Ser53 of HC CDR2, from Glu25 to the amide of Thr28 of HC CDR1, from the carbonyl of Glu22 to the amide of Gly33 of HC CDR1, and from the carbonyl of Thr23 to the amide of Try101 of HC CDR3 ( and Figure S2B). Overall, the buried solvent access surface area is 775 Å2 on GIPR ECD and 735 Å2 on Fab1.
To understand whether mAb1 binding affects endogenous ligand, we compared the complex structure of mouse GIPR ECD-Fab1 with the previously reported human GIPR ECD-GIP complex (PDB: 2QKH)Citation33 (Figure S3). The mouse and human GIPR ECD share high sequence identity (78%), and the structures of the two proteins superpose well with a root-mean-square deviation of 0.89 Å for the Cα atoms. Mouse GIP also shares high sequence identity with human GIP, with only three mutations among 42 residues and none of the mutations involved in binding to GIPR. Due to the high-sequence conservation between human and mouse GIPR ECD ligand binding sites, we reason that mouse GIP interacts with mouse GIPR ECD in a similar manner as in the human homologue. The structure superposition reveals that there is no overlap between the endogenous ligand and Fab1 binding (). Fab1 sits on the opposite side of the GIP binding site in GIPR ECD, so the binding of Fab1 is unlikely to affect GIP binding. Thus, the co-crystal structure elucidates the molecular basis that mAb1 is a non-neutralizing high-affinity binder to GIPR, subsequently having no effect on GIP signaling.
Structure of mouse GIPR with fab2
Our attempt to crystallize mouse GIPR ECD with the Fab of mAb2 (Fab2) failed to produce diffraction-quality crystals. Taking advantage of the stable complex between GIPR and Fab1, we were able to generate diffraction-quality crystals and determined the crystal structure of the ternary complex of mouse GIPR ECD with both Fab1 and Fab2 at 2.6 Å resolution. There is a single complex in the asymmetric unit, with Fab1 and Fab2 approaching mouse GIPR ECD from opposite directions (). Fab1 interacts with the ECD in an identical manner as in the binary complex structure of GIPR ECD-Fab1. Overall, the GIPR ECD domain in the ternary complex resembles that in the ECD-Fab1 binary complex, with the exception of the conformation of the stalk region at the C-terminus of the ECD (). The stalk, a 15-residue segment of residue from Lys94 to Gln109 between the ECD domain and the first transmembrane helix, is disordered in the binary complex structure but forms a two-turn helix and packs against the core of the ECD domain in the ternary complex structure (). The function of this C-terminal stalk helix is discussed below.
Figure 3. Ternary complex structure of mouse GIPR with Fab1 and Fab2. (A) Overall structure of the ternary complex. GIPR ECD is shown in cartoon representation and colored in rainbow scheme with N-terminus in blue and C-terminus in red. Fab1 is shown in cartoon representation and colored purple for heavy chain and wheat for light chain. Fab2 is shown in cartoon representation and colored blue for heavy chain and light blue for light chain. (B) Overlay of GIPR ECD in the ternary complex structure with Fab2 and Fab1 (rainbow color), in the binary complex with Fab1 (wheat) and in the complex structure with GIP (white). (C) and (D). Detailed interactions in the interface between GIPR ECD and Fab2. The proteins are colored as in (A). The interface residues are shown in sticks. Fab2 surface is colored in light blue
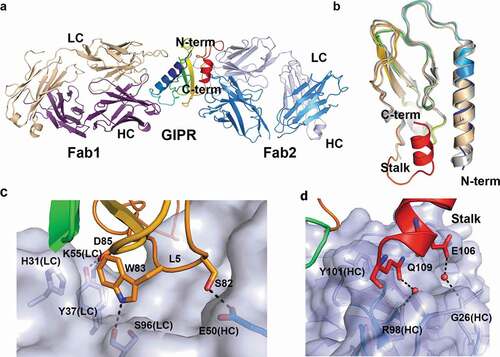
Fab2 engages the GIPR ECD in two distinctive areas. The first area includes residues from three β-stands (β3, β4, and β5), sitting in a groove formed by the LC CDR1 and CDR3, and three HC CDR loops (). The interactions include both polar and van der Waals (vdW) interactions. At the center, GIPR Trp83 fits tightly in a pocket formed by a few residues, including His31 and Tyr37 from the Fab2 LC. GIPR Trp83 also forms a hydrogen bond interaction with the carbonyl of Ser96 from Fab2 LC. Other notable interactions include a hydrogen bond from GIPR Ser82 to the side chain of Glu50 of Fab2 HC; a salt bridge from GIPR Asp85 to LC Lys55; and a hydrogen bond from GIPR Asp85 to LC Tyr37 ( and Figure S2C).
The second area of interactions involves residues from the C-terminal stalk of ECD, which was disordered in the GIPR-Fab1 structure and other related class B GPCR ECD domain structures such as GCGR and GLP1-R. This C-terminal stalk helix is sandwiched between HC CDR1 and CDR3. The interface is mostly vdW interactions. The side chains of GIPR Glu106 and Gln109 fit in two small pockets that are slightly positively charged and form water-mediated hydrogen bond interactions with HC Gly26 main-chain carbonyl and HC Arg98 side chain, respectively. Gln109 also forms stacking interactions with the side chain of Tyr101 of the HC ( and Figure S2D).
Mab2 locks GIPR ECD in an auto-inhibitory conformation
To understand how mAb2 binding affects endogenous peptide ligand binding, we superposed the structure of Fab2-ECD complex to that of the GIPR-GIP complex (PDB: 2QKH).Citation33 The structure comparison reveals that mAb2 would clash only with the C-terminus of GIP peptide. Surprisingly, the mid-portion of GIP peptide overlaps well with the stalk region of GIPR ECD (). The buried solvent access surface area between GIPR ECD and Fab2 is 826 Å2 (). This is slightly larger than the 617 Å2 of the buried solvent access surface area between GIPR ECD and its peptide ligand GIP.Citation34 Notably, Fab2 and GIP epitopes on the ECD only partially overlap ().
Figure 4. Fab2 stabilizes GIPR in auto-inhibited conformation. (A) Structure superposition of GIPR-GIP complex with GIPR-Fab2 complex. Fab2 is shown in blue surface. GIPR ECD is shown as cyan cartoon with the stalk region colored in red. Superposed GIP peptide is shown as yellow cartoon. (B) The epitope of GIP and Fab2 on the GIPR ECD. The C-terminal stalk of GIPR is removed for comparison with GIPR-GIP structure. GIPR is shown as cyan surface and the GIP is shown as yellow cartoon. The GIP epitope is colored in orange and the Fab2 epitope is outlined in blue. (C) Sequence alignment of the GIPR ECD stalk and GIP peptide presented in a helical wheel. GIPR stalk peptide residues are in red and GIP peptide residues are in black. The three conserved residues are highlighted in cyan shade. (D) Superposition of the GIP peptide to the ECD C-terminal stalk. GIPR ECD with the C-terminal stalk removed is shown as cyan surface. The C-terminal stalk is shown as red cartoon. Superposed GIP is shown as yellow cartoon. The conserved hydrophobic residues are shown as sticks. (E). Comparison of four Class B GPCR-antibody complex structures. GPCR ECD is shown in white surface. The Fabs are shown in cartoon and color in blue (mAb2), cyan (hGIPR-mAb), green (gipg013), and orange (mAb 3F52) respectively. The C-terminal stalk of GIPR ECD is shown in red cartoon
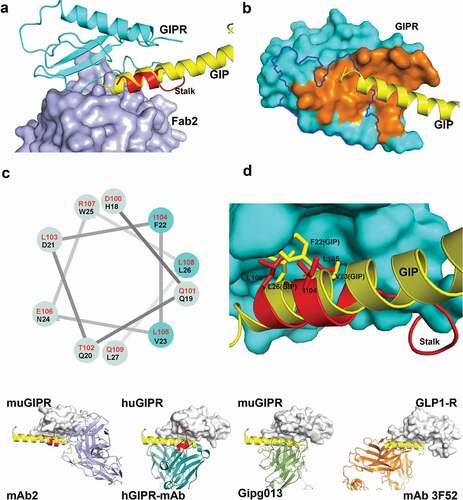
As mentioned before, the stalk region of GIPR, a 15-amino acid segment between the ECD core domain and the first transmembrane helix that is usually disordered in other class B GPCR ECD, forms a distinctive secondary structure in the ternary complex of GIPR with Fab1 and Fab2. Specifically, residues Glu101 to Arg107 adopt a two-turn helix and pack against αA, L3, and L5 of ECD (). In comparison with the GIP-GIPR structure, the two-turn helix overlaps very well with the mid-portion of GIP peptide. Even though there is no recognizable sequence homology at the primary sequence level between GIP peptide and GIPR stalk, several hydrophobic residues in the stalk region, including Ile104, Leu105, and Leu108, aligned well with residues Phe22, Val23, and Leu26 of GIP, which occupy the center of the highly conserved, hydrophobic site on GIPR ( and ). The confirmation of the stalk peptide suggests that the stalk may act as a molecular mimic of the peptide ligand and occlude the ligand-binding site of endogenous GIP peptide. Thus, the binding of mAb2 recognizes and stabilizes the stalk conformation that mimics the ligand peptide and locks the GIPR in an inactive state.
The structures of several Class B GPCR ECD with antagonistic antibodies' fragments were reported previously.Citation28,Citation30,Citation32 This wealth of structural data allows us to compare the angle of approach of the Fab to the ECD domain and evaluate the effects of Fab binding with respect to the ligand binding (). In both GLP1-R-Fab 3F52 (PDB: 5E94)Citation30 and GIPR-Fab gipg013 complex structures (PDB: 4HJ0),Citation28 the Fab approaches the ECD from the same angle and overlaps the peptide ligand-binding site completely, and the stalk regions are disordered. This is very different from GIPR-Fab2 complex where the Fab and peptide ligand only partially overlap, and the C-terminal stalk serves as an autoinhibitory pseudo-ligand stabilized by the antibody binding. Interestingly, in the huGIPR-hGIPR Ab co-crystal structure (PDB: 6DKJ),Citation32 while the Fab overlaps well with GIP binding site, the stalk region of human GIPR ECD adopts a helical conformation that is packed against antibody. The findings in both GIPR-Fab2 and huGIPR-hGIPR Ab structure suggest that the helical conformation of the stalk region may be an intrinsic state that is captured upon antagonist antibody binding. Note that, in the structures of full-length Class B GPCR and other antibody-ECD complex, the stalk region reveals significant conformational changes at different activity states. It is possible that the stalk region acts as an important signal switch for the activation of class B GPCR and targeting the stalk region in addition to ligand blocking contributed to the antagonistic activity.
Mab2 lowers body weight gain and improves metabolic profiles in vivo in DIO mice
Previously we reported the evaluation of mAb2 on the metabolic profile of DIO mice under two different doses, including a low dose of 1 mg/kg and a very high dose of 30 mg/kg.Citation32 We expanded the study using an intermediate dose of 10 mg/kg twice a week for 7 weeks. The dosing regimen ensures sufficient pharmacological coverage of target over the treatment period. In a pharmacokinetic study, a single IP injection of mAb2 demonstrated a prolonged half-life of 12–13 days over a dose range of 1 to 100 mg/kg.Citation32 Body weights and metabolic profiles (glucose, insulin, triglyceride, and total cholesterol levels) were measured during the treatments. The mAb2-treated mice showed reduced body weight gain (+2.33 g; 6.5%) over the course of treatment phase compared to the mAb1-treated mice (+9.63 g; 26.4%) or the control group (+9.36 g; 25.5%) ( and ).
Figure 5. Chronic in vivo studies in DIO mice with anti-mouse GIPR antibodies. DIO mice were treated with the antibodies twice a week via IP injection for 7 weeks. (A) body weight, (B) % of body weight change, (C) glucose level, (D) insulin level, (E) fat mass, (F) lean mass. Results are expressed as the mean and standard error of the mean. Statistical analysis was performed using one-way or two-way ANOVA with Sidak’s test for multiple comparisons. *** p < .001, ** p < .01, * p < .05 vs. mAb1
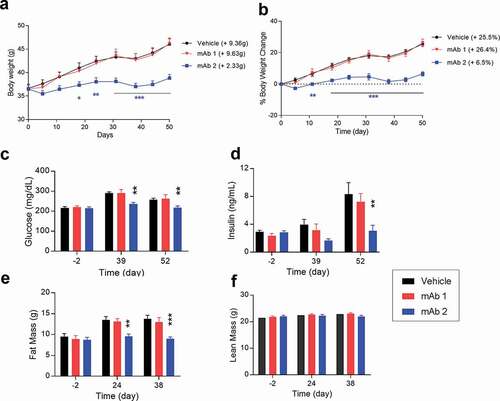
Furthermore, four-hour fasting blood glucose levels and fasting blood insulin levels in the mAb2-treated group also decreased at days 39 and 52 compared to the control or mAb1-treated group ( and ). Our results demonstrated that the effects of mAb2 on body weight are resulted from a decrease in fat mass gain but not a loss of lean mass ( and , and Figure S4D). Reduced fat mass gain by mAb2 also correlated with lower leptin and adiponectin levels (Figure S3A and S4B), two hallmarks of adipose tissue. Liver weight was also significantly decreased in the mAb2-treated group compared to the control or mAb1-treated group (Figure S4C), which correlated with significant reduction of liver triglyceride content and lipid reduction in liver histology in our follow-up studies.Citation32 There were no significant changes in circulating triglyceride and total cholesterol, even though both trended to lower levels in mAb2-treated group (Figure S4E and S4F). These results demonstrated that mAb2 antagonizes the GIPR activity in both wild type and diet-induced obese mice and improves the metabolic profile over the course of the treatment.
To further elucidate the molecular mechanism of blocking GIPR, metabolic-related gene expressions were studied in epididymal and inguinal white adipose tissue. In both epididymal and inguinal fat, genes related to the oxidative phosphorylation pathway, insulin sensitivity, and lipolysis pathways, such as prdm16, Pparc1a, cidea, Pparg, Adipoq, Lipe, Pnpla2, were significantly upregulated in mAb2-treated mice compared to mAb1, while inflammation-related genes such as cd44, Spp1, ccl2, ccl7 were significantly downregulated (Figure S5). Overall gene changes were more pronounced in epididymal fat than inguinal fat.
Discussion
Even though both GIP and GLP-1 are incretin hormones that potentiate insulin secretion in a glucose-dependent manner, they play different roles in regulating energy homeostasis. GLP-1 induces satiety and leads to weight loss. While the primary role of GIP is still being debated, one main function of GIP is to facilitate the anabolic effect of insulin by promoting fat storage in adipose tissue. Despite the fact that long-lasting GLP-1 analogs have shown clinical efficacy and achieved commercial success in treating type 2 diabetes and obesity in humans, development of therapeutics based on GIP has not been successful, primarily due to its attenuated insulinotropic effect in diabetic patientsCitation35 and lack of effective GIP antagonistic agents.Citation4 Here, we reveal the molecular mechanism of the superior activity of a GIPR antagonistic antibody, mAb2, through detailed structural and functional characterizations in comparison with a non-neutralizing binder.
Class B GPCR, including glucagon receptor, GLP1R and GIPR, are characterized by an N-terminal extracellular domain of about 140 residues that recruits small peptide hormone. Previous biochemical and structural biology studies have shed light on the process from peptide hormone recognition to signal transduction to G proteins.Citation34,Citation36 A two-step tethering mechanism was proposed, where the C-terminus of the peptide hormone first binds to the ECD followed by the high-affinity binding of the N-terminal half of the peptide to the transmembrane helical domain. This model is corroborated by structures of full-length class B GPCRs solved by crystallography and cryo-EM.Citation25–Citation27 However, the conformation of the stalk peptide between the ECD and the first transmembrane helix and its functional consequence remain elusive, even though this segment is a pivot point between the ECD and TM domain.
Our structure of GIPR with mAb2 reveals that, in the presence of the antagonistic antibody, the stalk region not only adopts a distinctive α-helical structure that is not reported in previous structures, but also seems to act as an auto-inhibitory pseudo ligand. While the stalk region possesses no homology with the GIP peptide, three hydrophobic residues from the stalk region align well with the conserved hydrophobic residues in GIP in the helical conformation and maintain the critical vdW interactions with GIPR ECD in the peptide-binding site. Thus, the stalk region of GIPR in the presence of the full antagonist mAb behaves like a molecular mimic of the ligand peptide. Interestingly, the stalk region was shown to adopt significantly different conformations ranging from disordered in the cryo-EM structure of full-length GLP1R with a partial agonist peptideCitation25 and in various complex structures of GPCR ECD with either peptide hormone or antibodies,Citation28,Citation30,Citation33,Citation37 to a β-strand in the crystal structure of GCGR with a negative modulator,Citation27 to an α-helix in the crystal structure of GCGR with an agonistic peptide.Citation38 Computation prediction suggests that the secondary structure of the stalk region can adopt a helical conformation by itself in solution.Citation39 A wealth of structural information suggests that the various conformational states of the stalk peptide could be related to the different activation states of the class B GPCR. Of note, Koth et al. have proposed that the ECD of GCGR can negatively regulate receptor activity independent of ligand binding.Citation37 Our data provide direct evidence that the stalk peptide may act as an auto-inhibitory pseudo ligand to negatively regulate receptor activity.
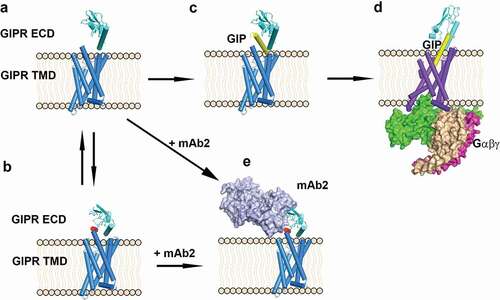
Here, we propose a molecular model to illustrate the differential effects of antagonistic antibody mAb2 and endogenous ligand GIP (). In the absence of a peptide ligand, GIPR ECD is in equilibrium between a conformation in which the peptide binding site is fully accessible with the stalk disordered () and an auto-inhibited conformation in which the peptide binding site is occupied by the stalk peptide in a helical conformation (). Upon binding of the C-terminal half of GIP to the ECD region (), both ECD and stalk undergo conformational changes and align the ECD to the transmembrane domain to allow efficient binding of the N-terminal half of GIP to the peptide-binding site in the TM domain (). The peptide-bound GIPR then recruits G proteins and initiates the downstream signaling process. In the presence of antagonistic antibody mAb2, the antibody approaches the ECD in one of the two states. It can bind to the ECD where the stalk peptide is disordered () and mAb2 binding induces the peptide to adopt a helical conformation and dock into the peptide-binding site. mAb2 can also recognize the ECD when the stalk peptide is docked in the GIP binding site as a helical peptide ligand mimic (). The consequence of both scenarios is that mAb2 stabilizes the receptor in a similar auto-inhibited inactive state () and displays superior antagonistic activity in both in vitro and in vivo assays. Interestingly, the structure of a previous reported GIPR antagonistic antibody gipg013 did not reveal this auto-inhibitory mechanism.Citation28 The inhibitory effect of gipg013 is likely the result of simple competition with the endogenous ligand-binding site.
Figure 6. Scheme of antagonist antibody and endogenous ligand GIP-induced conformation changes. (A) GIPR ECD in an open conformation in which the peptide binding site is free. (B) GIPR ECD in an auto-inhibited conformation in which the peptide binding site is occupied by the stalk peptide (red). (C) GIP binds to GIPR ECD, (D) GIP inserted into the GIPR TMD and recruits the G protein complex. (E) Antagonistic antibody mAb2 binds to the GIPR ECD. GIPR 7-helix TMD is shown as blue cylinder. GIPR ECD is shown as cyan cartoon and the stalk region is colored in red. mAb2 is shown as light blue surface and the G-protein complex is shown as magenta/wheat/green surface. The GIP peptide is shown as yellow cartoon. The membrane is shown as beige cartoon
Our data demonstrate that antagonistic anti-mouse GIPR antibodies decreased body weight gain and improved metabolic profiles in DIO mice, as part of our early discovery effort to understand the GIPR biology. We later discovered that the anti-GIPR antagonistic antibodies combined with GLP1R agonist synergistically enhanced weight loss in DIO mice and non-human primates.Citation32 This synergism is profound and intriguing, since GIP/GLP-1 co-agonism has demonstrated synergistic weight loss in multiple animal modelsCitation40 and demonstrated effects in a recent Phase 2 clinical trial of co-agonist LY3298176.Citation41 While the effect of GLP-1R agonism on weight loss is mainly due to reduced food intake, GIPR antagonism is more complicated,Citation32 and further studies are warranted.
Obesity and type-2 diabetes affect millions of people worldwide. There are still significant unmet medical needs for effective treatment for diabetes, as well as obesity. Our data established the anti-obesity effect of GIPR antagonism using a pharmacological approach and paves the way for further study to evaluate the efficacy and safety of therapeutic antibodies against GIPR for treatment of obesity and type 2 diabetes.
Materials and methods
Materials
The mouse anti-mouse GIPR antibodies were generated using a DNA immunization method by the Amgen hybridoma group.Citation32 To generate mouse anti-murine GIPR antibodies, five female 8-12-week-old 129/C57Bl6 mice (Charles River) were immunized 3 times with DNA expression plasmids encoding the full-length murine GIPR. The murine GIPR coding sequence was flanked on the N and C terminus with heterologous T-cell epitopes. For each boost, 50 µg of the DNA expression vector was diluted into phosphate-buffered saline and subcutaneously injected. DNA was then delivered to the mouse using the BTX T830 electroporation generator according to the manufacturer’s instructions (Harvard Apparatus). Sera were collected 4–6 weeks after the first immunization and murine GIPR-specific titers were determined by live-cell fluorescence-activated cell sorting (FACS) using Chinese hamster ovary (CHO) cells stably expressing mouse GIPR. Animals exhibiting satisfactory titers were identified and were given a final boost (5 days prior to harvest), with 5 × 10⁶ human embryonic kidney (HEK)-293-6E cells transiently expressing murine GIPR via IP and harvested for hybridoma generation using Sp2/0-Ag14 (ATCC) cells as fusion partners. All animals were cared for in accordance with the Amgen Institutional Animal Care and Use Committee in Thousand Oaks, CA. To identify mouse anti-murine GIPR-specific monoclonal antibodies, hybridoma supernatants were screened by fluorometric microvolume assay technology (FMAT) (FMAT 8200 Screening System; Molecular Devices). Hybridoma supernatants displaying positive signals in FMAT screening were confirmed by high-throughput FACS for binding to transiently transfected HEK-293-6E cells expressing murine GIPR. Finally, hybridoma supernatants were screened in a cAMP functional assay and top clones with neutralizing activity were selected for sequencing. All the GIP peptides and its analogs were purchased from Phoenix Pharmaceuticals.
The sequences of the Fab of mAb1 and mAb2 are as follows:
mAb1 heavy chain
DVQLVESGGGLVQPGGSRKLSCAASGFTFSSFGMHWVRQAPEKGLEWVAYISSGSSTIYYADTVKGRFTISRDNPKNTLFLQMTSLRSEDTAMYYCARGKYPTWIAYWGQGTLVTVSAAKTTPPSVYPLAPGSAAQTNSMVTLGCLVKGYFPEPVTVTWNSGSLSSGVHTFPAVLQSDLYTLSSSVTVPSSTWPSETVTCNVAHPASSTKVDKKIVPRDCGCKPC
mAb1 light chain
DIVMTQSPSSLTVTAGEKVTMSCKSSQSLLNSGNQKNYLTWYQQKPGQPPKLLISWASTRDSGVPDRFTGSGSGTDFTLTISSVQAEDLAVYYCQNDYSYPLTFGAGTKLELKRADAAPTVSIFPPSSEQLTSGGASVVCFLNNFYPKDINVKWKIDGSERQNGVLNSWTDQDSKDSTYSMSSTLTLTKDEYERHNSYTCEATHKTSTSPIVKSFNRNEC
mAb2 heavy chain
QVQLQQPGAELVKPGASVKLSCRASGYTFTSNWMHWVKQRPRQGLEWIGEINPSNGRSNYNEKFKTKATLTVDKSSSTAYMQLSSLTSEDSAVYYCARFYYGTSWFAYWGQGTLVAVSAAKTTPPSVYPLAPGSAAQTNSMVTLGCLVKGYFPEPVTVTWNSGSLSSGVHTFPAVLQSDLYTLSSSVTVPSSTWPSETVTCNVAHPASSTKVDKKIVPRDCGCKPC
mAb2 light chain
DVVMTQTPLSLPVSLGDQASISCRSSQSLVHSNGDTYLHWYLQKPGQSPKLLIYKVSNRFSGVPDRFSGSGSGTDFTLKISRVEAADLGVYFCSQSTHVPPFTFGGGTKLEIKRADAAPTVSIFPPSSEQLTSGGASVVCFLNNFYPKDINVKWKIDGSERQNGVLNSWTvDQDSKDSTYSMSSTLTLTKDEYERHNSYTCEATHKTSTSPIVKSFNRNEC
Camp cell-based assay and kinexa binding assay
The cAMP cell-based assay and KinExA binding assay were previously described.Citation32 cAMP was measured with HTRF dynamic cAMP assay kit (Cisbio) using CHO cells stably expressing mouse GIPR stimulated with 6 pM mouse GIP. The binding affinity of mouse anti-mouse GIPR antibody with mouse GIPR target membranes were determined using KinExA.
In vivo insulinotropic effect of exogenous GIP during IPGTT
Eight-week-old male C57BL/6 mice were weighed and randomized into three groups: no DAGIP (N = 8), DAGIP alone (N = 7), and DAGIP with 30 mg/kg mAb 1 (N = 8). Immediately post randomization, the first two groups received vehicle (10 mM acetate, 9% sucrose, PH5.2), and the third group received mAb2. All were given via IP injection. Approximately 24 hlater, baseline blood glucose levels were measured after mice were fasted for 4 h. A dose of DAGIP (Phoenix Pharmaceuticals) at 50 nmol/kg or saline (no DAGIP group) was given IP, followed with an IP dose of glucose at 2 g/kg immediately. Blood samples were collected at 10 min, and blood glucose was measured with a glucometer at 30-min post glucose administration. Serum was obtained from the collected blood samples and insulin levels were determined using mouse insulin ELISA (ALPCO Diagnostics). mAb1 was tested in a separate experiment using the same procedure. In this experiment, male C57BL/6 mice at 9-weeks old were randomized into three groups: no DAGIP (N = 8), DAGIP alone (N = 7), and DAGIP with 30 mg/kg mAb2 (N = 8).
Chronic efficacy studies in DIO mice
Male C57BL/6 DIO mice at 18 weeks of age that had been fed an HFD for 12 weeks prior to purchase were randomized into groups (N = 10 per group) based on body weight, glucose, and insulin levels. Mice were administered via IP injection twice a week for 7 weeks with one of the treatments: vehicle, mAb1 (10 mg/kg), and mAb2 (10 mg/kg). Body weight was recorded once a week or as indicated. Fat mass and lean mass were measured using Minispec whole body composition analyzer (Bruker). Four-hour fasting blood glucose levels were measured from tail vein using a blood glucose meter (Abbott). Fasting serum insulin levels were determined using mouse insulin ELISA (ALPCO Diagnostics). At termination of the study, liver and epididymal fat were collected and weighed. Epididymal fat and inguinal fat were collected for RNA analysis. Serum triglyceride levels were measured using an infinity triglyceride assay kit (Thermo Scientific). Serum total cholesterol levels were measured using an infinity total cholesterol assay kit (Thermo Scientific).
Protein expression and purification
Mouse GIPR ECD (residue numbers 19 to 134, lacking the N-terminal signal sequence) was cloned into the pET30 vector (Novagen, Madison, WI) for bacterial expression. Large-scale protein production was carried out in Escherichia coli BL21 (DE3) cells (Stratagene, La Jolla, CA); the protein was produced as inclusion bodies. Lysis of the cells and isolation and solubilization of inclusion bodies were performed as described.Citation33 Refolding was carried out by rapid dilution into buffer containing 100 mM Tris (pH 8.5), 800 mM arginine, 2 mM glutathione, 5 mM glutathione disulfide, and 3 mM EDTA, and refolding continued for 48 h at 4°C. Refolded GIPR ECD was purified by hydrophobic interaction chromatography (butyl-Sepharose 4FF; GE healthcare) and by gel filtration (Superdex 75 HR 16/60; GE healthcare), both steps in the presence of 500 mM arginine. Before complex formation, the purified mouse GIPR ECD was polished by gel filtration in a buffer containing 25 mM Hepes, pH 7.4, and 150 mM NaCl.
Mouse antibody mAb1 and mAb2 were expressed in 293-6E cells and purified by protein A column. Fabs were generated using Pierce Fab preparation kit.Citation42 Cleaved Fab was further purified by cation exchange chromatography (MonoS; GE Healthcare) and by gel filtration chromatography (Superdex 75 HR 16/60; GE Healthcare).
Complex formation and crystallization
The complex of mouse GIPR ECD with Fab1 was formed by incubating Fab1 with excess molar ratio of mouse GIPR ECD protein and was purified by size exclusion chromatography (Superdex 200; GE Healthcare) in buffer containing 25 mM Hepes, pH 7.4, and 150 mM NaCl. The ternary complex of mouse GIPR ECD with Fab1 and Fab 2 was formed by incubating purified mouse GIPR ECD/Fab1 complex with excess molar ratio of Fab2, and was purified by size exclusion chromatography (Superdex 200; GE Healthcare) in buffer containing 25 mM Hepes, pH 7.4, and 150 mM NaCl. The purified complex was then concentrated to 8 mg/ml for crystallization. The mouse GIPR/Fab1 complex was crystallized by sitting drop vapor diffusion method at 20°C with 1:1 protein solution to reservoir solution of 10% PEG10,000, 0.1 M sodium citrate, pH 5.0 and 15% isopropanol. The mouse GIPR/Fab1/Fab2 ternary complex was crystallized by sitting drop vapor diffusion method at 20°C with 1:1 protein solution to reservoir solution of 0.1 M Bis-Tris, pH 5.5, 0.2 M MgCl2, and 25% PEG3350. The crystals were flash-frozen with liquid nitrogen using oil as cryoprotectant.
Structure solution
The X-ray diffraction data sets were collected at the synchrotron beamline 502 at Advanced Light Source (ALS) in Berkeley, California or beamline 22-ID at the Argonne Photon Source of Argonne National Laboratory in Chicago. The structure was solved by molecular replacement with PHASERCitation43 using published human GIPR ECD structure (PDB access code: 2QKH). Model building was carried out in COOTCitation44, and refinement was done in REFMAC5Citation45 in the CCP4 program suite.Citation46 Final refinement is performed with Phenix.refine with default parameters including coordinate and Atomic Displacement Parameter refinement.Citation47 Structural data have been deposited in RCSB with PDB codes 6O9H (mGIPR-Fab1) and 6O9I (mGIPR-Fab1-Fab2 ternary complex). All structural figures were prepared using Pymol (Schrodinger Inc.). The data collection and refinement statistics are presented in Table S1.
Supplemental Material
Download Zip (16.2 MB)Acknowledgments
We thank Robert Kurzeja for discussion on experiments, and Sheree Johnson and Ann Shim for critical reading of the manuscript.
The Berkeley Center for Structural Biology is supported in part by the National Institutes of Health, National Institute of General Medical Sciences, and the Howard Hughes Medical Institute. The Advanced Light Source is supported by the Director, Office of Science, Office of Basic Energy Sciences, of the U.S. Department of Energy under Contract No. DE-AC02-05CH11231
X-ray diffraction data were also collected at Southeast Regional Collaborative Access Team (SER-CAT) 22-ID (or 22-BM) beamline at the Advanced Photon Source, Argonne National Laboratory. Use of the Advanced Photon Source was supported by the U. S. Department of Energy, Office of Science, Office of Basic Energy Sciences, under Contract No. W-31-109-Eng-38.
Supplementary material
Supplemental data for this article can be accessed on the publisher’s website.
Additional information
Funding
Related Research Data
References
- Baggio LL, Drucker DJ. Biology of incretins: GLP-1 and GIP. Gastroenterology. 2007;132:2131–12. doi:https://doi.org/10.1053/j.gastro.2007.03.054.
- Campbell JE, Drucker DJ. Pharmacology, physiology, and mechanisms of incretin hormone action. Cell Metab. 2013;17:819–37. doi:https://doi.org/10.1016/j.cmet.2013.04.008.
- Ahren B. The future of incretin-based therapy: novel avenues–novel targets. Diabetes Obes Metab. 2011;13(Suppl 1):158–66. doi:https://doi.org/10.1111/dom.2011.13.issue-s1.
- Irwin N, Flatt PR. Evidence for beneficial effects of compromised gastric inhibitory polypeptide action in obesity-related diabetes and possible therapeutic implications. Diabetologia. 2009;52:1724–31. doi:https://doi.org/10.1007/s00125-009-1422-8.
- Kieffer TJ, McIntosh CH, Pederson RA. Degradation of glucose-dependent insulinotropic polypeptide and truncated glucagon-like peptide 1 in vitro and in vivo by dipeptidyl peptidase IV. Endocrinology. 1995;136:3585–96. doi:https://doi.org/10.1210/endo.136.8.7628397.
- Usdin TB, Mezey E, DC B, Brownstein MJ, Bonner TI. Gastric inhibitory polypeptide receptor, a member of the secretin-vasoactive intestinal peptide receptor family, is widely distributed in peripheral organs and the brain. Endocrinology. 1993;133:2861–70. doi:https://doi.org/10.1210/endo.133.6.8243312.
- Beck B, Max JP. Direct metabolic effects of gastric inhibitory polypeptide (GIP): dissociation at physiological levels of effects on insulin-stimulated fatty acid and glucose incorporation in rat adipose tissue. Diabetologia. 1986;29:68. doi:https://doi.org/10.1007/BF02427284.
- Kim SJ, Nian C, McIntosh CH. Activation of lipoprotein lipase by glucose-dependent insulinotropic polypeptide in adipocytes. A role for a protein kinase B, LKB1, and AMP-activated protein kinase cascade. J Biol Chem. 2007;282:8557–67. doi:https://doi.org/10.1074/jbc.M609088200.
- Getty-Kaushik L, Song DH, Boylan MO, Corkey BE, MM W. Glucose-dependent insulinotropic polypeptide modulates adipocyte lipolysis and reesterification. Obesity (Silver Spring). 2006;14:1124–31. doi:https://doi.org/10.1038/oby.2006.129.
- Chia CW, Carlson OD, Kim W, Shin YK, Charles CP, Kim HS, Melvin DL, Egan JM. Exogenous glucose-dependent insulinotropic polypeptide worsens post prandial hyperglycemia in type 2 diabetes. Diabetes. 2009;58:1342–49.
- Meier JJ, Gallwitz B, Siepmann N, Holst JJ, Deacon CF, Schmidt WE, Nauck MA. Gastric inhibitory polypeptide (GIP) dose-dependently stimulates glucagon secretion in healthy human subjects at euglycaemia. Diabetologia. 2003;46:798–801. doi:https://doi.org/10.1007/s00125-003-1103-y.
- Christensen M, Vedtofte L, Holst JJ, Vilsboll T, Knop FK. Glucose-dependent insulinotropic polypeptide: a bifunctional glucose-dependent regulator of glucagon and insulin secretion in humans. Diabetes. 2011;60:3103–09. doi:https://doi.org/10.2337/db11-0979.
- Speliotes EK, Willer CJ, Berndt SI, Monda KL, Thorleifsson G, Jackson AU, Lango Allen H, Lindgren CM, Luan J, Magi R, et al. Association analyses of 249,796 individuals reveal 18 new loci associated with body mass index. Nat Genet. 2010;42:937–48. doi:https://doi.org/10.1038/ng.686.
- Okada Y, Kubo M, Ohmiya H, Takahashi A, Kumasaka N, Hosono N, Maeda S, Wen W, Dorajoo R, Go MJ, et al. Common variants at CDKAL1 and KLF9 are associated with body mass index in east Asian populations. Nat Genet. 2012;44:302–06. doi:https://doi.org/10.1038/ng.1086.
- Wen W, Cho YS, Zheng W, Dorajoo R, Kato N, Qi L, Chen CH, Delahanty RJ, Okada Y, Tabara Y, et al. Meta-analysis identifies common variants associated with body mass index in east Asians. Nat Genet. 2012;44:307–11. doi:https://doi.org/10.1038/ng.1087.
- Berndt SI, Gustafsson S, Magi R, Ganna A, Wheeler E, Feitosa MF, Justice AE, Monda KL, Croteau-Chonka DC, Day FR, et al. Genome-wide meta-analysis identifies 11 new loci for anthropometric traits and provides insights into genetic architecture. Nat Genet. 2013;45:501–12. doi:https://doi.org/10.1038/ng.2606.
- Miyawaki K, Yamada Y, Ban N, Ihara Y, Tsukiyama K, Zhou H, Fujimoto S, Oku A, Tsuda K, Toyokuni S, et al. Inhibition of gastric inhibitory polypeptide signaling prevents obesity. Nat Med. 2002;8:738–42. doi:https://doi.org/10.1038/nm727.
- PR F, Dorothy H Lecture. Gastric inhibitory polypeptide (GIP) revisited: a new therapeutic target for obesity-diabetes? Diabet Med. 2008;2008:759–64.
- Faivre E, Hamilton A, Holscher C. Effects of acute and chronic administration of GIP analogues on cognition, synaptic plasticity and neurogenesis in mice. Eur J Pharmacol. 2012;674:294–306. doi:https://doi.org/10.1016/j.ejphar.2011.11.007.
- Hoare SR. Mechanisms of peptide and nonpeptide ligand binding to Class B G-protein-coupled receptors. Drug Discov Today. 2005;10:417–27. doi:https://doi.org/10.1016/S1359-6446(05)03370-2.
- Culhane KJ, Liu Y, Cai Y, Yan EC. Transmembrane signal transduction by peptide hormones via family B G protein-coupled receptors. Front Pharmacol. 2015;6:264. doi:https://doi.org/10.3389/fphar.2015.00264.
- Jazayeri A, Dore AS, Lamb D, Krishnamurthy H, Southall SM, Baig AH, Bortolato A, Koglin M, Robertson NJ, Errey JC, et al. Extra-helical binding site of a glucagon receptor antagonist. Nature. 2016;533:274–77. doi:https://doi.org/10.1038/nature17414.
- Siu FY, He M, de Graaf C, Han GW, Yang D, Zhang Z, Zhou C, Xu Q, Wacker D, Joseph JS, et al. Structure of the human glucagon class B G-protein-coupled receptor. Nature. 2013;499:444–49. doi:https://doi.org/10.1038/nature12393.
- Song G, Yang D, Wang Y, de Graaf C, Zhou Q, Jiang S, Liu K, Cai X, Dai A, Lin G, et al. Human GLP-1 receptor transmembrane domain structure in complex with allosteric modulators. Nature. 2017;546:312–15. doi:https://doi.org/10.1038/nature22378.
- Liang YL, Khoshouei M, Radjainia M, Zhang Y, Glukhova A, Tarrasch J, Thal DM, Furness SGB, Christopoulos G, Coudrat T, et al. Phase-plate cryo-EM structure of a class B GPCR-G-protein complex. Nature. 2017;546:118–23. doi:https://doi.org/10.1038/nature22327.
- Zhang Y, Sun B, Feng D, Hu H, Chu M, Qu Q, Tarrasch JT, Li S, Sun Kobilka T, Kobilka BK, et al. Cryo-EM structure of the activated GLP-1 receptor in complex with a G protein. Nature. 2017;546:248–53. doi:https://doi.org/10.1038/nature22394.
- Zhang H, Qiao A, Yang D, Yang L, Dai A, de Graaf C, Reedtz-Runge S, Dharmarajan V, Zhang H, Han GW, et al. Structure of the full-length glucagon class B G-protein-coupled receptor. Nature. 2017;546:259–64. doi:https://doi.org/10.1038/nature22363.
- Ravn P, Madhurantakam C, Kunze S, Matthews E, Priest C, O’Brien S, Collinson A, Papworth M, Fritsch-Fredin M, Jermutus L, et al. Structural and pharmacological characterization of novel potent and selective monoclonal antibody antagonists of glucose-dependent insulinotropic polypeptide receptor. J Biol Chem. 2013;288:19760–72. doi:https://doi.org/10.1074/jbc.M112.426288.
- Mukund S, Shang Y, Clarke HJ, Madjidi A, Corn JE, Kates L, Kolumam G, Chiang V, Luis E, Murray J, et al. Inhibitory mechanism of an allosteric antibody targeting the glucagon receptor. J Biol Chem. 2013;288:36168–78. doi:https://doi.org/10.1074/jbc.M113.496984.
- Hennen S, Kodra JT, Soroka V, Krogh BO, Wu X, Kaastrup P, Orskov C, Ronn SG, Schluckebier G, Barbateskovic S, et al. Structural insight into antibody-mediated antagonism of the Glucagon-like peptide-1 Receptor. Sci Rep. 2016;6:26236. doi:https://doi.org/10.1038/srep26236.
- Kaneko K, Fu Y, Lin HY, Cordonier EL, Mo Q, Gao Y, Yao T, Naylor J, Howard V, Saito K, et al. Gut-derived GIP activates central Rap1 to impair neural leptin sensitivity during overnutrition. J Clin Invest. 2019;130:3786–3791. doi:https://doi.org/10.1172/JCI126107.
- Killion EA, Wang J, Yie J, Shi SD, Bates D, Min X, Komorowski R, Hager T, Deng L, Atangan L, et al. Anti-obesity effects of GIPR antagonists alone and in combination with GLP-1R agonists in preclinical models. Sci Transl Med. 2018;10(472). pii: eaat3392. doi: https://doi.org/10.1126/scitranslmed.aat3392.
- Parthier C, Kleinschmidt M, Neumann P, Rudolph R, Manhart S, Schlenzig D, Fanghanel J, Rahfeld JU, Demuth HU, Stubbs MT. Crystal structure of the incretin-bound extracellular domain of a G protein-coupled receptor. Proc Natl Acad Sci U S A. 2007;104:13942–47. doi:https://doi.org/10.1073/pnas.0706404104.
- Parthier C, Reedtz-Runge S, Rudolph R, Stubbs MT. Passing the baton in class B GPCRs: peptide hormone activation via helix induction? Trends Biochem Sci. 2009;34:303–10. doi:https://doi.org/10.1016/j.tibs.2009.02.004.
- Jones IR, Owens DR, Moody AJ, Luzio SD, Morris T, Hayes TM. The effects of glucose-dependent insulinotropic polypeptide infused at physiological concentrations in normal subjects and type 2 (non-insulin-dependent) diabetic patients on glucose tolerance and B-cell secretion. Diabetologia. 1987;30:707–12. doi:https://doi.org/10.1007/BF00296993.
- Dong M, Pinon DI, Cox RF, Miller LJ. Molecular approximation between a residue in the amino-terminal region of calcitonin and the third extracellular loop of the class B G protein-coupled calcitonin receptor. J Biol Chem. 2004;279:31177–82. doi:https://doi.org/10.1074/jbc.M404113200.
- Koth CM, Murray JM, Mukund S, Madjidi A, Minn A, Clarke HJ, Wong T, Chiang V, Luis E, Estevez A, et al. Molecular basis for negative regulation of the glucagon receptor. Proc Natl Acad Sci U S A. 2012;109:14393–98. doi:https://doi.org/10.1073/pnas.1206734109.
- Zhang H, Qiao A, Yang L, Van Eps N, Frederiksen KS, Yang D, Dai A, Cai X, Zhang H, Yi C, et al. Structure of the glucagon receptor in complex with a glucagon analogue. Nature. 2018;553:106–10. doi:https://doi.org/10.1038/nature25153.
- Yang Y, Heffernan R, Paliwal K, Lyons J, Dehzangi A, Sharma A, Wang J, Sattar A, Zhou Y. SPIDER2: A Package to Predict Secondary Structure, Accessible Surface Area, and Main-Chain Torsional Angles by Deep Neural Networks. Methods Mol Biol. 2017;1484:55–63.
- Finan B, Ma T, Ottaway N, Muller TD, Habegger KM, Heppner KM, Kirchner H, Holland J, Hembree J, Raver C, et al. Unimolecular dual incretins maximize metabolic benefits in rodents, monkeys, and humans. Sci Transl Med. 2013;5:209ra151. doi:https://doi.org/10.1126/scitranslmed.3007218.
- Frias JP, Nauck MA, Van J, Kutner ME, Cui X, Benson C, Urva S, Gimeno RE, Milicevic Z, Robins D, et al. Efficacy and safety of LY3298176, a novel dual GIP and GLP-1 receptor agonist, in patients with type 2 diabetes: a randomised, placebo-controlled and active comparator-controlled phase 2 trial. Lancet. 2018;392:2180–93. doi:https://doi.org/10.1016/S0140-6736(18)32260-8.
- Mage MG. Preparation of Fab fragments from IgGs of different animal species. Methods Enzymol. 1980;70:142–50.
- McCoy AJ, Grosse-Kunstleve RW, Adams PD, Winn MD, LC S, Read RJ. Phaser crystallographic software. J Appl Crystallogr. 2007;40:658–74. doi:https://doi.org/10.1107/S0021889807021206.
- Emsley P, Cowtan K. Coot: model-building tools for molecular graphics. Acta Crystallogr D Biol Crystallogr. 2004;60:2126–32. doi:https://doi.org/10.1107/S0907444904019158.
- Murshudov GN, AA V, Dodson EJ. Refinement of macromolecular structures by the maximum-likelihood method. Acta Crystallogr D Biol Crystallogr. 1997;53:240–55. doi:https://doi.org/10.1107/S0907444996012255.
- CCP4. (Collaborative Computational Project N. The CCP4 suite: programs for protein crystallography. Acta Crystallogr D Biol Crystallogr. 1994;50:760–63. doi:https://doi.org/10.1107/S0907444994003112.
- Adams PD, Afonine PV, Bunkoczi G, Chen VB, Davis IW, Echols N, Headd JJ, Hung LW, Kapral GJ, Grosse-Kunstleve RW, et al. PHENIX: a comprehensive Python-based system for macromolecular structure solution. Acta Crystallogr D Biol Crystallogr. 2010;66:213–21. doi:https://doi.org/10.1107/S0907444909052925.