
ABSTRACT
Integrins are transmembrane multi-conformation receptors that mediate interactions with the extracellular matrix. In cancer, integrins influence metastasis, proliferation, and survival. Collagen-binding integrin-α11/β1, a marker of aggressive tumors that is involved in stroma-tumor crosstalk, may be an attractive target for anti-cancer therapeutic antibodies. We performed selections with phage-displayed synthetic antibody libraries for binding to either purified integrin-α11/β1 or in situ on live cells. The in-situ strategy yielded many diverse antibodies, and strikingly, most of these antibodies did not recognize purified integrin-α11/β1. Conversely, none of the antibodies selected for binding to purified integrin-α11/β1 were able to efficiently recognize native cell-surface antigen. Most importantly, only the in-situ selection yielded functional antibodies that were able to compete with collagen-I for binding to cell-surface integrin-α11/β1, and thus inhibited cell adhesion. In-depth characterization of a subset of in situ-derived clones as full-length immunoglobulins revealed high affinity cellular binding and inhibitory activities in the single-digit nanomolar range. Moreover, the antibodies showed high selectivity for integrin-α11/β1 with minimal cross-reactivity for close homologs. Taken together, our findings highlight the advantages of in-situ selections for generation of anti-integrin antibodies optimized for recognition and inhibition of native cell-surface proteins, and our work establishes general methods that could be extended to many other membrane proteins.
Introduction
Integrins are a family of heterodimeric transmembrane receptors that mediate cell-cell and cell-extracellular matrix (ECM) interactions. Integrins are associated with cell growth, division and differentiation,Citation1,Citation2 and they also interact with growth factors and cytokine receptorsCitation3-Citation6 to affect cell survival pathways.Citation7-Citation10 Consequently, integrins play important roles in cancer biology by influencing tumor migration, proliferation and survival.Citation11,Citation12 Moreover, increased integrin expression in human tumors correlates with disease progression and reduced patient survival.Citation13-Citation15 Thus, integrins are promising targets for cancer therapy.
A critical feature of the tumor microenvironment is the tumor-stroma interface, which relies on integrins that interact with ECM molecules and paracrine growth factorsCitation11,Citation16,Citation17 to orchestrate proliferative cues, stimulate angiogenic pathways, and influence immuno-surveillance evasion mechanisms,Citation18-Citation20 all of which are essential for tumor survival and progression. In particular, integrin-α11/β1 is upregulated in cancer-associated fibroblasts (CAFs) of metastatic tumors and behaves as a tumor-stroma mediator,Citation21-Citation23 and its expression is correlated with aggressive tumors in patientsCitation24 Integrin-α11/β1 in CAFs interacts with collagen-I in the ECM to indirectly stimulate cancer-stromal stiffness and tumor progression through the release of factors that enhance tumor survival and growth.Citation25-Citation28 Accordingly, given its roles as a pro-tumorigenic factor and as a prognostic marker for metastatic tumors, integrin-α11/β1 shows potential as a cancer therapeutic target.
In recent years, antibodies (Abs) have risen to prominence as versatile tools for cancer research and also as therapeutics.Citation29-Citation31 Indeed, a number of anti-integrin Abs are in clinical trials (ClinicalTrials.gov), including the following: anti-integrin-αV Abs for prostate cancer (NCT00537381), melanoma (NCT00246012), colorectal cancer (NCT01008475), and pancreatic cancer (NCT02683824); an anti-integrin-α5/β1 Ab for renal cell carcinoma (NCT00100685), melanoma (NCT00099970), lung cancer (NCT00654758), and pancreatic cancer (NCT00401570); and an anti-αV/β3 Ab for melanoma (NCT00111696) and lymphoma (NCT00111696). However, deriving selective and potent Abs against integrins remains challenging, because integrin heterodimers exist in multiple conformationsCitation32,Citation33 that are difficult to recapitulate with purified recombinant proteins. Furthermore, integrin conformations are influenced by cations and the local membrane environment,Citation34 and they are exquisitely controlled by ‘inside-out’ signaling,Citation34-Citation36 which may also augment dynamic conformational states and modulate their functions in the extracellular environment.
Given the dependence of integrin structure and function on the membrane environment, we applied a phage display strategy that enabled Ab selection in situ with native integrin-α11/β1 displayed on live cells. Utilizing this approach in combination with a highly functional phage-displayed synthetic Ab library,Citation37,Citation38 we demonstrated that in-situ selections yielded more diverse, potent and selective Abs than those obtained through conventional selections with purified recombinant integrin-α11/β1 protein. Moreover, some of the Abs identified from the in-situ selections acted as potent inhibitors of collagen-I binding to integrin-α11/β1 receptors on cells. Thus, these Abs will serve as valuable tools to interrogate integrin-α11/β1 function in cancer progression, and the general in-situ selection strategy can be applied to target other integrin family members and integral membrane proteins to identify promising cancer therapeutics.
Results
Selection and screening of anti-integrin-α11/β1 Abs
To assemble a diverse panel of anti-integrin-α11/β1 Abs, we used a highly functional library of antigen-binding fragments (Fabs) displayed on phage (library F)Citation37 and performed either conventional selections for binding to purified integrin-α11/β1 or in-situ selections with integrin-α11/β1 displayed on live cells. For the recombinant protein selections, we used the complete extra-cellular domains of integrin-α11 and integrin-β1 purified as a non-covalently linked heterodimer (see Materials & Methods for details). After four rounds of selection for binding to immobilized integrin-α11/β1, the screening of 96 individual phage clones by ELISA yielded eight unique Fabs ().
Figure 1. Sequences of integrin-α11/β1 Abs. Abs were isolated by screening a phage-displayed Fab library for binding to (a) purified integrin-α11/β1 or (b) integrin-α11/β1 displayed on live cells. Sequences are shown for positions that were diversifed in the library and are numbered according to the IMGT nomenclature.Citation39 Dashes indicate gaps in the alignment. Underlined bold text indicates Abs that inhibited integrin-α11/β1 binding to collagen-1, and asterisks (*) indicate Abs that were also characterized as full-length immunoglobulins
For in-situ selections, we used two different cell lines engineered to overexpress integrin-α11/β1, CAF094-α11/β1 and C2C12-α11/β1 (Fig. S1). To enable selection of diverse Abs, we confirmed previous reports of differential effects of Ca+2, Mg+2 and Mn+2 cations on integrin conformation and function (Fig. S2A-B), and we performed separate selections with each of the two cell lines in the presence of each of these cations. We used a strategy whereby we first depleted clones that bound to other cell-surface antigens by exposing phage pools to control cells that did not express integrin-α11/β1, pelleting the cells, and collecting the supernatant containing the depleted phage pool. The depleted phage pool was then subjected to positive selections by incubating with CAF094-α11/β1 or C2C12-α11/β1 cells; the cells were pelleted and washed, and bound phage were eluted, amplified in E. coli and used for another round of selection (Fig. S2C).
After the fourth round, we isolated and analyzed 240 clones from each of the six selections (two different cell lines with three different cations) for specific binding to the cell line with which they were enriched. Thus, in total, we screened 1440 Fab-phage clones by cellular ELISA and identified 95 clones with sequences that were unique within their pool (Fig. S2D), each of which bound to immobilized CAF094-α11/β1 or C2C12-α11/β1 cells more strongly than to the parental cell line (data not shown). We then compared these 95 sequences to each other to consolidate any clones that were unique in one of the 6 pools, but were duplicates across pools, and this analysis yielded a final set of 82 unique sequences. From these 82 clones, Fab proteins were purified and evaluated by flow cytometry, yielding a set of 45 positive Fabs that bound to both CAF094-α11/β1 and C2C12-α11/β1 cells, but did not bind to parental cell lines that did not express integrin-α11/β1 ( and S3). The other 37 Fab proteins were deemed negative, as 23 did not bind selectively to either CAF094-α11/β1 or C2C12-α11/β1 cells and 14 bound selectively to C2C12-α11/β1 cells but not to CAF094-α11/β1 cells (Fig. S3A).
Identification of Abs that inhibit integrin-α11/β1 function
The entire panel of 53 anti-integrin-α11/β1 Fabs () was assessed for binding to purified integrin-α11/β1 by ELISA and cell-surface integrin-α11/β1 by flow cytometry (). The eight Fabs from the conventional selection bound robustly to purified integrin-α11/β1, but did not exhibit significant binding to the cell-surface antigen. Conversely, the 45 Fabs from the in-situ selection exhibited strong and selective binding to cells expressing integrin-α11/β1, but only a few exhibited even modest binding to purified integrin-α11/β1. We also screened the panel for their ability to inhibit the binding of integrin-α11/β1 to collagen-1 by assessing the effect of each Fab on the attachment of C2C12-α11/β1 cells to plates coated with collagen-1 (). As expected, the Fabs derived from the conventional selection, which did not recognize cell-surface integrin-α11/β1, were unable to inhibit cell attachment. Amongst the Fabs derived from the in-situ selections, a significant number were functional and nine strongly inhibited cell attachment ( and ). Notably, with the exception of A11-42, these inhibitory Fabs were among those that did not efficiently recognize purified integrin-α11/β1 ().
Figure 2. Binding and function of anti-integrin-α11/β1 Fabs. (a) Binding of Fabs (x-axis) to purified integrin-α11/β1 (white bars, y-axis, left) or C2C12-α11/β1 cells (black bars, y-axis, right). Binding to purified or cell-surface integrin-α11/β1 was assessed by ELISA or flow cytometry, respectively. Data are shown for single-point measurements, and error bars indicate the standard deviation (SD) of two independent experiments. (b) Effects of Fabs (x-axis) on adhesion of C2C12-α11/β1 cells to collagen-I (y-axis). Asterisks (*) indicate Fabs that inhibited cell adhesion to collagen-I, and double asterisks (**) indicate Abs that were also characterized as full-length immunoglobulins. See Materials and Methods for details. Data are shown for single-point measurements, and error bars indicate SD of two independent experiments
Next-generation sequencing analysis of cell-binding phage pools
We used next-generation sequencing (NGS) to comprehensively assess the sequences and abundances of the clones in each Fab-phage pool selected for binding to each integrin-α11/β1 overexpressing cell line under each cation condition, and also in pools selected for binding to negative control cell lines that did not overexpress integrin-α11/β1 (). Taking advantage of the simple library F design, which uses a single defined framework and contains diversity in only four complementary-determining regions (CDRs), we applied a sequencing strategy that recovered the complete paratope sequence for each clone (see Materials and Methods). Unique high-quality sequence reads from each pool were parsed based on CDR sequences and observation counts. The abundance of each unique paratope in each positive pool was plotted versus its enrichment in the positive pool relative to the negative pool (). To estimate the number of potential unique integrin-α11/β1-binding clones in each pool, we defined an upper-right quadrant of putative positives as those sequences representing more than 100 counts in the positive pool and being more than two-fold enriched relative to the negative pool. Notably, virtually all integrin-α11/β1-binding sequences validated by ELISA () resided in this quadrant. We identified additional clones that were not validated by ELISA but are likely to bind integrin-α11/β1 given their location in the upper-right quadrant, and for each unique CDR L3 and H3 combination, we chose the clone with the highest counts in the positive pool as a representative of that paratope family.
Figure 3. NGS analysis of Fab-phage clones selected for binding to cells displaying integrin-α11/β1. (a) The abundance of each sequence in Fab-phage pools selected for binding to integrin-α11/β1 overexpressing cells (x-axis) is plotted versus the ratio of the abundance in pools selected for binding to cells overexpressing integrin-α11/β1 over pools selected for binding to cells not expressing integrin-α11/β1 (positive/negative, y-axis). Selections were performed with C2C12 mouse myoblast cells or human CAF cells in the presence of the indicated cation. Each circle represents a unique paratope (i.e., a unique combination of CDRs L3, H1, H2 and H3). The dashed lines define an upper-right quadrant that contains putative integrin-α11/β1-binding clones, defined arbitrarily as those occurring more than 100 times in the positive pool and being greater than two-fold enriched relative to the negative pool. Clones that were validated as specific integrin-α11/β1-binding Abs by ELISA screening () are shown as filled circles, colored as indicated. Each red circle represents the highest abundance and enrichment clone of a family cluster based on unique CDR L3 and H3 sequences (see Materials and Methods) that was not validated by ELISA, but is predicted to bind to integrin-α11/β1. The number in parentheses in the lower right quadrant is the number of unique potential integrin-α11/β1-binding clones in each upper-right quadrant, which is the sum of the validated (filled circles) and putative binders (red circles). (b) Venn diagrams for potential integrin-α11/β1-binding clones selected with the two different cell lines in the presence of Mg+2, Ca+2, or Mn+2. The total unique clones are indicated at the bottom. (c) Venn diagram for total unique potential integrin-α11/β1-binding clones selected under the indicated cation conditions
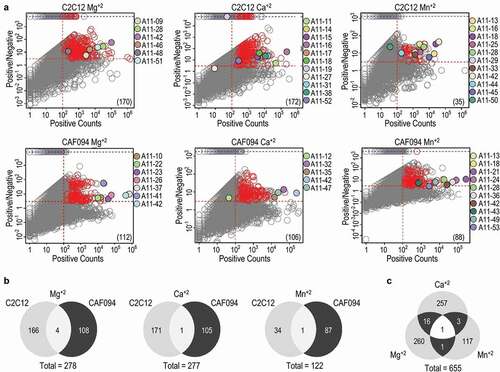
In total, the selections in the presence of Mg+2, Ca+2 or Mn+2 yielded 278, 277 or 122 unique putative integrin-α11/β1-binding Abs, respectively (), and taken together, the cell-based selections yielded a total of 655 unique potential anti-integrin-α11/β1 Abs (). Notably, there was very little overlap between the sequences enriched under the different selection conditions, suggesting that each individual selection did not capture all of the potential integrin-α11/β1-binding clones in the naïve library. Consequently, additional more exhaustive selections utilizing larger quantities of Fab-phage and antigen-presenting cells would likely yield additional unique positive clones. Moreover, additional putative binders could be recovered by gene synthesis from the sequences identified by our NGS analysis, as the complete set of 655 unique sequences is available (Fig. S4). However, even the limited ELISA screen yielded numerous validated Fabs that could bind selectively to integrin-α11/β1 on cells, including a significant proportion that inhibited cell adhesion. Thus, we did not pursue the NGS data further, but rather focused our efforts on detailed characterization of inhibitory Abs.
Characterization of full-length anti-integrin-α11/β1 immunoglobulins
To assess the affinity, selectivity and potency of full-length immunoglobulins, we converted several Fabs into the human IgG1 format. As our main interest was to develop inhibitors of integrin-α11/β1 function, we chose six Fabs that strongly blocked adhesion of C2C12-α11/β1 cells to collagen-I (), and amongst these, we focused on three IgGs (A11-26, A11-37, A11-42) that could be purified in high yields (data not shown). By flow cytometry, all three IgGs showed good selectivity for integrin-α11/β1, as they bound robustly to C2C12-α11/β1 cell lines, but not to C2C12 cell lines engineered to over-express structurally related integrins α1/β1 and α2/β1 (). Quantitative flow cytometry showed tight and saturable binding of each antibody to CAF094-α11/β1 and C2C12-α11/β1 cell lines () with EC50 values in the sub-nanomolar range ().
Figure 4. Characterization of full-length anti-integrin-α11/β1 immunoglobulins. (a) Binding of anti-integrin-α11/β1 IgGs and a negative control IgG (x-axis) to C2C12 cells engineered to express the indicated integrins, assessed by flow cytometry fluorescence (y-axis). Data are shown for single-point measurements, and error bars indicate SD of two independent experiments. (b) Dose response curves for anti-integrin-α11/β1 IgGs and a negative control IgG (x-axis) binding to CAF094-α11/β1 or C2C12-α11/β1 cells, assessed by flow cytometry fluorescence (y-axis). Mean fluorescence intensity signals were normalized to the highest concentration value for each sample, and error bars indicate SD of two independent experiments. (c) Peptide counts for IP-MS analysis of CAF094-α11/β1 cell lysates immunoprecipitated with anti-integrin-α11/β1 IgGs or a negative control IgG. (d) Blocking of anti-integrin-α11/β1 IgGs (x-axis) binding to CAF094-α11/β1 cells by indicated Fabs, assessed by flow cytometry fluorescence (y-axis). Data are shown for single-point measurements, and error bars indicate SD of two independent experiments
Table 1. Affinities and inhibitory potencies of anti-integrin-α11/β1 IgGs
Further corroboration of specificity for integrin-α11/β1 was provided by performing immunoprecipitation mass spectrometry (IP-MS) experiments with each IgG and CAF094-α11/β1 cells. Tandem mass spectra were searched against a human database to validate MS/MS protein identifications. Protein identifications were accepted if they could be established at greater than 99% probability based on identified peptides. After background filtering to remove keratin, immunoglobulin and cytoplasmic proteins, the highest peptide counts for all three IgGs were for integrin-α11 followed by integrin-β1 ().
We also used flow cytometry to assess epitope overlap by measuring the ability of various Fabs to block binding of each IgG to CAF094-α11/β1 cells (). As expected, preincubation of CAF094-α11/β1 cells with each Fab reduced subsequent binding of the cognate IgG. Moreover, Fabs A11-26 and A11-42 blocked binding of both A11-26 and A11-42 IgGs, whereas Ab A11-37 failed to compete for binding with the other IgGs tested. Taken together, these results showed that the three IgGs recognized cell-surface integrin-α11/β1 with high affinity and specificity, and Abs A11-26 and A11-42 likely bind to overlapping epitopes, whereas Ab 11–37 binds to a non-overlapping epitope.
Finally, we assessed whether the IgGs could inhibit integrin-α11/β1 function in a cellular context. The inhibitory assays were performed with standard reagents and growth media to measure the activity of the different IgGs in relevant physiological settings. As expected, based on the activities of the Fabs (), each IgG was able to inhibit adhesion of C2C12-α11/β1 cells to immobilized collagen-I, indicating that they blocked binding of integrin-α11/β1 to collagen-I (). We further corroborated the inhibitory activity of the IgGs on integrin-α11/β1 function in a collagen-I gel contraction assay.Citation40,Citation41 In this assay, C2C12-α11/β1 cells and collagen-I were mixed to form polymerized lattice gels that were then floated with cell media in the presence of the different IgGs. After 24 hours, images of the polymerized gels were captured and gel surface areas were analyzed to assess integrin-mediated collagen-I gel contraction. We observed potent inhibition of collagen-I gel matrix contraction by the anti-integrin-α11/β1 IgGs (). In both assays, IgGs A11-37 and A11-42 exhibited potencies in the sub-nanomolar range, whereas the potency of A11-26 was an order of magnitude weaker ().
Figure 5. Effects of immunoglobulins on integrin-α11/β1 function in cells. (a) Dose response curves for the effects of anti-integrin-α11/β1 IgGs and a negative control IgG (x-axis) on adhesion of C2C12-α11/β1 cells to collagen-I (y-axis). Assays were performed in DPBS containing 10 mM CaCl2 and 5 mM MgCl2 (b) Dose response curves for the effects of anti-integrin-α11/β1 IgGs and a negative control IgG (x-axis) on collagen-I gel contraction with C2C12-α11/β1cells. Assays were performed in serum-free DMEM. The means of at least three independent experiments are plotted and bars denote the standard deviation
Altogether, our results showed that in situ phage display selections with naïve libraries were able to generate anti-integrin-α11/β1 Abs that targeted multiple epitopes on cell-surface antigen. Moreover, at least two distinct functional epitopes were identified that potently inhibited cell adhesion and gel contraction by blocking the interaction between integrin-α11/β1 and collagen-I.
Discussion
Over the years, many anti-integrin Abs have been developed using purified antigens and standard hybridoma methods, and numerous drugs have advanced into clinical development.Citation42-Citation46 However in our selections with integrin-α11/β1, the immunodominant epitopes on the purified antigen appeared to be non-native epitopes that either do not exist or are not spatially accessible on the cell-surface form of the protein. Moreover, our results showed that cell-surface integrin-α11/β1 presents many epitopes that are either not present or are not immunodominant on purified antigen. These native epitopes may result from specific conformations, alternative glycosylation and/or additional protein-protein interactions that occur in the cell membrane, but are not recapitulated in the recombinant protein form.
Consequently, cell-surface selections proved crucial for generating a diverse panel of Abs targeting multiple epitopes, including some that do not block collagen binding and others that do. Our results raise the intriguing possibility that, despite extensive efforts to target integrins with Abs, the predominant use of purified antigens may have left many native epitopes untapped. In turn, this may represent a great opportunity to revisit integrin biology and therapeutics with more comprehensive cell-based selection strategies. Moreover, the general methods presented here could be readily adapted to target other membrane proteins, including multi-pass integral membrane proteins for which efficient antibody generation remains a challenge.
Materials and methods
Cell lines
The human cancer-associated fibroblast (CAF094) cell lines (wildtype and overexpressing integrin-α11)Citation27 and the C2C12 mouse myoblast cell lines (wildtype and overexpressing integrin-α11, α1, or α2 in complex with the endogenously expressed integrin β1chain) were gifts from Dr. Ming Tsao at Princess Margaret Cancer Center, Toronto.
Antibody selections with recombinant antigen
Recombinant human integrin α11/β1 protein was obtained from a commercial vendor (R&D Systems, 6357-AB-050). As described by the vendor, the recombinant protein was expressed and purified in a secreted form from CHO cells and consisted of the complete extra-cellular domains of integrin-α11 and integrin-β1 fused at their C termini to complementary leucine zippers that formed heterodimers. Protein purity was verified by SDS-PAGE to be greater than 95% and functional activity was verified by detection of binding to collagen by ELISA. Phage pools representing synthetic antibody library-FCitation37 were cycled through multiple rounds of binding selections with the integrin α11/β1 protein immobilized on 96-well Maxisorp Immunoplates (Nunc), as described.Citation47,Citation48 After four rounds of selection, individual phage clones were isolated and grown in 96-deep-well plates with 2xYT medium supplemented with carbenicillin (Sigma-Aldrich) and M13K07 helper phage (New England Biolabs). The culture supernatants were diluted with one-tenth volume of 10x phosphate-buffered saline (PBS) and used directly in phage ELISAs to identify clones that bound to integrin α11/β1 with at least three-fold higher signals than to bovine serum albumin (BSA, Sigma-Aldrich), and these positive clones were subjected to DNA sequencing analysis.
Antibody selections with cellular antigen
Phage pools representing synthetic antibody library-FCitation37 were cycled through four rounds of binding selections using a parental cell line as the background depleting step, and an integrin-α11/β1 overexpressing cell line as the target selection step (Fig. S2C). The adherent cell lines were suspended in PBS, 10 mM ethylenediaminetetraacetic acid (EDTA) (Sigma-Aldrich). Ten million re-suspended cells (greater than 90% viability) were incubated under gentle rotation for 30 minutes at 4°C in 1 mL PBS, 1% BSA, 2 mM CaCl2, 1 mM MgCl2 or 0.5 mM MnCl2. Fab-phage (3 x 10¹² cfu) in 200 µL PBS, 1% BSA were added and the cells were incubated under gentle rotation for 2 hours at 4°C. In each round, Fab-phage were first incubated with the parental cell line, and following centrifugation to pellet the cells, supernatant containing unbound phage was collected. The collected supernatant was incubated with cells overexpressing integrin-α11/β1, the cells were pelleted by centrifugation. and the supernatant was discarded. The cells were washed four times with chilled PBS, 1% BSA, 2 mM CaCl2, 1 mM MgCl2 or 0.5 mM MnCl2. Bound phage were eluted from the cell pellet by resuspending the cells in 0.1 M hydrochloric acid, incubating for 10 minutes at room temperature, pelleting the cells by centrifugation, and collecting the supernatant containing eluted phage. After round 4, phage were eluted from both the parental cells and the cells overexpressing integrin-α11/β1 cells to enable NGS sequencing of both negative and positive pools. The eluted supernatant was neutralized with 11 M Tris buffer (Sigma-Aldrich) and cellular debris was removed by high-speed centrifugation. The eluted phage were amplified by infection and growth in E. coli OmniMAXTM cells (Thermo-Fisher). After round 4, infected E.coli OmniMAXTM cells were plated on 2YT/carbenicillin (Sigma-Aldrich) plates for isolation of single colonies.
Phage ELISAs
Colonies of E. coli OmniMAXTM harboring phagemids were inoculated into 450 µl 2YT broth supplemented with carbenicillin and M13-KO7 helper phage, and the cultures were grown overnight at 37°C in a 96-well format. Culture supernatants containing Fab-phage were diluted two-fold in PBS buffer supplemented with 1% BSA and incubated for 15 minutes at room temperature. For phage ELISAs to test binding to purified antigen, recombinant integrin-α11/β1 protein was coated overnight at 4°C onto Maxisorp 384-well plates that were subsequently blocked with BSA. The plates were incubated with Fab-phage for 1 hour, washed with PBS, 0.05% Tween and incubated with anti-M13 horseradish peroxidase-conjugated Ab (Sigma-Aldrich) for 30 minutes at room temperature. The plates were washed, developed with TMB Microwell Peroxidase Substrate Kit (KPL Inc.) and quenched with 1.0 M phosphoric acid, and absorbance was determined at a wavelength of 450 nm. Positive binding clones were identified as those that produced at least three-fold greater signal on wells coated with integrin-α11/β1 compared to wells coated with BSA. For phage ELISAs to test binding to native antigen on cells, phage were added directly to the cellular media of CAF094 adherent cells (95–100% confluence) in tissue-culture-treated 96-well plates. After incubation for 45 minutes at room temperature, the plates were washed gently with PBS and the cells were fixed with 4% paraformaldehyde (Sigma-Aldrich). The cells were washed with PBS and incubated for 30 minutes with horseradish peroxidase/anti-M13 Ab conjugate (Sigma-Aldrich) in PBS buffer supplemented with 1% BSA. The plates were developed as described above. Clones were identified as positive if they produced at least two-fold greater signal on wells with integrin-α11/β1 overexpressing cells over parental cells. All positive clones were subjected to DNA sequence analysis.
Fab protein purification
Fab proteins were expressed in and purified from E. coli BL21 (ThermoFisher) with a FLAG epitope tag (amino acid sequence: DYKDDDDK) fused to the C-terminus of the light chain, as described.Citation49 Following expression, cells were harvested by centrifugation and cell pellets were flash-frozen using liquid nitrogen. The cell pellets were thawed, re-suspended in lysis buffer (50 mM Tris, 150 mM NaCl, 1%Triton X-100, 1 mg/ml lysozyme, 2 mM MgCl2, 10 units of benzonase), and incubated for 1 hour at 4°C. The lysates were cleared by centrifugation, applied to rProtein A-Sepharose columns (GE Healthcare), and washed with 10 column volumes of 50 mM Tris, 150 mM NaCl, pH 7.4. Fab protein was eluted with 100 mM phosphoric acid buffer, pH 2.5 (50 mM NaH2PO4, 140 mM NaCl, 100 mM H3PO4) into a neutralizing buffer (1 M Tris, pH 8.0). The eluted Fab protein was buffer exchanged into PBS and concentrated using an Amicon-Ultra centrifugal filter unit (EMD Millipore). Fab protein was characterized for purity by SDS-PAGE gel chromatography and concentration was determined by spectrophotometry at an absorbance wavelength of 280 nm.
IgG purification
Full-length IgG proteins were expressed in mammalian cells as previously described.Citation47 Briefly, plasmids designed to express heavy and light chains were co-transfected into Expi293 cells (ThermoFisher) using the FuGENE® 6 Transfection Reagent kit (Promega), according to the manufacturer’s instructions. After 5 days, cell culture media was harvested and applied to an rProtein-A affinity column (GE Healthcare). IgG protein was eluted with 25 mM H3PO4, pH 2.8, 100 mM NaCl and neutralized with 0.5 M Na3PO4, pH 8. Fractions containing eluted IgG protein were combined, concentrated and dialyzed into PBS, pH 7.4. IgG protein was characterized for purity by SDS-PAGE gel chromatography and concentration was determined by spectrophotometry at an absorbance wavelength of 280 nm.
Cell attachment assay
A 96-well plate (ThermoFisher) was coated with collagen-I protein in PBS (10 μg/ml Advanced Biomatrix) and incubated overnight at 4°C. Wells were blocked with 2% heat-inactivated BSA in PBS for 1 hour at 37°C. Parental C2C12 or integrin-α11/β1 overexpressing C2C12 cells were suspended in TrypLE Express cell dissociation reagent (Gibco) and washed two times with Dulbecco’s phosphate-buffered saline (DPBS) containing 10 mM CaCl2 and 5 mM MgCl2 (Gibco, 10404). The cells were incubated with Fab or IgG protein for 30 minutes at 37°C. The cells were plated in triplicate onto the 96-well plate, incubated for 60 minutes at 37°C, and gently washed three times with DPBS containing 10 mM CaCl2 and 5 mM MgCl2. Cellular confluence counts were determined using an IncuCyte® S2 microscope (Essen BioScience) and analyzed using IncuCyte® S2 software (Essen BioScience).
Gel contraction assay
Parental or integrin-α11/β1 overexpressing C2C12 cells were treated with TrypLE Express (Gibco) and washed three times with serum-free Dulbecco’s Modified Eagle’s Medium (DMEM). Cell suspensions were prepared in DMEM and preincubated with IgGs for 1 hour at 37 °C. A collagen suspension was prepared on ice using 5 parts 2X DMEM, 1 part 0.2 M Hepes pH 8.0, and 4 parts collagen type I (Advanced Biomatrix). Cell and collagen suspensions were mixed to obtain a final cell density of 1.0 × 10⁵ cells/ml. Samples were added to 96-well plates (ThermoFisher) pre-blocked with 2% heat inactivated BSA in PBS overnight at 37 °C and incubated for 1 hour at 37 °C as six replicates. Polymerized cell/collagen gels were floated with DMEM in presence of 200 nM IgG. Images of collagen gels were taken after 24 hours using an Evos FL microscope. Gel areas were measured using ImageJ software (https://imagej.nih.gov), and percentages of initial gel areas were calculated. IC50 values were determined using GraphPad Prism software.
Flow cytometry
Adherent cells were lifted and dissociated using TrypLE Express (Gibco), washed with cell growth media, and resuspended in ice-cold assay buffer (PBS, 2% fetal bovine serum) in V-bottom 96-well plates. The cells were incubated with 100 nM Fab or IgG in assay buffer for 30 minutes at 4°C, washed twice, incubated with Alexa488-conjugated rat anti-DYKDDDDK secondary antibody (1:400; Biolegend, 637318) for detection of Fab or Alexa488-conjugated goat anti-human IgG secondary antibody (1:400, Jackson ImmunoResearch, 109-545-008) for detection of IgG, washed twice, and resuspended in PBS. For validation of integrin-α11 expression on the transgenic cell lines, a rabbit polyclonal anti-integrin-α11 Ab (Abcam, ab107858) was used followed by detection using an anti-rabbit IgG secondary antibody, Alexa Fluor 488 (ThermoFisher, R37116). Data (>10,000 events) were collected using a CytoFLEX-S flow-cytometer (Beckman Coulter) using a 488-nm laser with a 525/40 nm filter. Quantitation analysis was carried out using FlowJo v10.2 Software (FlowJo, LLC).
Mass spectrometry
For immunoprecipitation (IP) of cell-surface protein, 107 lifted and dissociated CAF094 cells were incubated with 500 nM Fab protein in DPBS containing 10 mM CaCl2 and 5 mM MgCl2, for 1 hour at 4°C. Cells were washed with PBS and lysed using IP lysis buffer (50 mM Tris-HCl pH 7.5, 150 mM NaCl, 1.0% IGEPAL CA-630, 0.25% Na-deoxycholate, 1 mM EDTA, and protease inhibitor cocktail (Roche)) for 15 minutes at 4°C, and centrifuged at 12000 x g for 5 minutes at 4°C. The supernatant was incubated with 30 μl of sepharose protein-A beads (GE Healthcare) for 1 hour at 4°C. The beads were washed three times with lysis buffer, once with PBS, and resuspended in 22 μl 10 mM glycine, pH 1.5. After 5 minutes, the supernatant was collected and neutralized with 2.2 μl 1 M Tris, pH 8.8. DTT was added to a final concentration of 10 mM. The sample was incubated at 40°C for 1 hour and cooled to room temperature. Iodoacetamide was added to a final concentration of 20 mM, and the sample was incubated at room temperature in the dark for 30 minutes. Trypsin (1 µg, Promega) was added and the sample was incubated overnight at 37°C. Peptides were purified using C18 tips and analyzed on a linear ion trap-Orbitrap hybrid analyzer (LTQ-Orbitrap, ThermoFisher) outfitted with a nanospray source and EASY-nLC split-free nano-LC system (ThermoFisher).
Tandem mass spectra were extracted, and charge state was deconvoluted and deisotoped by Xcalibur version 2.2. All MS/MS samples were analyzed using PEAKS Studio (Bioinformatics Solutions, Waterloo, ON Canada; version 8.0 (2016-09-08)) and X! Tandem (The GPM, thegpm.org; version CYCLONE (2010.12.01.1)). Samples were searched against the Uniprot Human database (Downloaded May 1 2017, 20183 entries) assuming the digestion enzyme trypsin. Carbamidomethyl of cysteine was specified as a fixed modification. Deamidation of asparagine and glutamine were specified as variable modifications. Scaffold (version Scaffold_4.7.5, Proteome Software Inc., Portland, OR) was used to validate MS/MS based peptide and protein identifications. Peptide identifications were accepted if they could be established at greater than 95% probability. Peptide Probabilities from PEAKS Studio (Bioinformatic Solutions, Inc.) were assigned by the Peptide Prophet algorithm with Scaffold delta-mass correction. Peptide Probabilities from X! Tandem were assigned by the Scaffold Local FDR algorithm. Protein identifications were accepted if they could be established at greater than 99% probability and contained at least one identified peptide. Protein probabilities were assigned by the Protein Prophet algorithm.Citation50 Proteins that contained similar peptides and could not be differentiated based on MS/MS analysis alone were grouped to satisfy the principles of parsimony. Proteins sharing significant peptide evidence were grouped into clusters.
Next-generation sequencing analysis
PCR amplicons were generated with Fab-phage pools as template, using forward and reverse primers that flanked CDRs L3 and H3, respectively. The primers included a 24 base-pair template annealing region followed by a 6–8 base-pair unique nucleotide barcode identifier and an Illumina universal adapter tag (PE1 or PE2 for the reverse or forward primer, respectively). The amplicons were isolated by gel electrophoresis followed by agarose gel extraction (Qiagen), and DNA concentrations were determined by spectrophotometry (BioteK). All amplicons were normalized, pooled and sequenced using a HiSeq 2500 instrument (Illumina) with 300 paired-end cycles. Besides PE1 and PE2 Illumina universal primers, the sequencing runs also included a custom primer that allowed for complete sequencing of CDRs H1 and H2. Thus, the three primer reads together provided complete sequence coverage of the four CDRs that were diversified in library F.
We analyzed two NGS replicates from each PCR sample. The sequencing reads for the two replicates were combined and then deconvoluted for each clone, and the three primer reads (PE1, PE2, and custom) were combined into a single sequence to derive the complete sequence. Sequences were filtered from sequencing errors using per base high quality score cutoff of Q = 30, which corresponds to 1:1000 of incorrect base call.Citation51 A total of 34,366,632 high quality nucleotide sequences (Table S1) were obtained, translated into amino acid sequences, and compared to the designed sequence repertoire of library F to filter out technical errors inherent to sequencing and PCR amplification. A total of 34,310,158 high quality amino acid sequences (Table S1) were obtained, and these were divided into positive and negative selection pools using the unique barcode identifiers encoded in the sequencing reads (Table S1). A positive pool was obtained for each integrin-α11/β1 overexpressing cell line (C2C12 and CAF094) under each cation condition (Ca+2, Mg+2, Mn+2). Similarly, a negative pool was obtained for the parental cell line (human integrin-α11 negative) under each cation condition. From each selection pool, hybridization errors and heteroduplex molecules that formed during the PCR hybridization were filtered using a frequency cutoff according to the maximum interclass inertia method of the Koenig-Huygens theorem.Citation52 In total, six pairs of positive/negative selection pools encompassing 25,556–139,612 unique amino acid sequences each were obtained (Table S1). The specificity score of each unique clone was calculated as its frequency fold-change in the positive pool over the negative pool, in order to discriminate specific binders from cross-reactive and nonspecific binders. In order to determine family clusters, each clone was grouped into highly homologous L3 and H3 sequences with other clones using a minimum homology cutoff of 75% sequence identity.
Abbreviations
| Ab | = | Antibody |
| ECM | = | extracellular matrix |
| CHO | = | Chinese hamster ovary |
| BSA | = | bovine serum albumin |
| PBS | = | phosphate-buffered saline |
| IPTG | = | Isopropyl β-D-1-thiogalactopyranoside |
| CDR | = | complementary-determining regions |
| IP | = | Immunoprecipitation |
| IgG | = | ethylenediaminetetraacetic acid |
| EDTA | = | immunoglobulin |
| IP-MS | = | immunoprecipitation mass-spectrometry |
| NGS | = | next-generation sequencing |
Disclosure of potential conflicts of interest
No potential conflicts of interest were disclosed.
Correction Statement
This article has been republished with minor changes. These changes do not impact the academic content of the article.
Supplemental Material
Download MS Word (427.3 KB)Acknowledgments
We are grateful to Kirsten Krastel for Fab protein purification, Zvezdan Pavlovic for data analysis support, and Minerva Fernandez and Yazen Jmeian for technical assistance. We thank Ming Tsao, Robin Hallett, Johan Fransson and Jeanne Magram for helpful discussions.
Supplementary material
Supplemental data for this article can be accessed on the publisher’s website.
Additional information
Funding
Related Research Data
References
- Hynes RO. Integrins: bidirectional, allosteric signaling machines. Cell. 2002;110:673–11. doi:https://doi.org/10.1016/S0092-8674(02)00971-6.
- Hood JD, Cheresh DA. Role of integrins in cell invasion and migration. Nat Rev Cancer [Internet]. 2002 [accessed 2019 Nov 18];2:91–100. http://www.ncbi.nlm.nih.gov/pubmed/12635172.
- Cabodi S, Moro L, Bergatto E, Boeri Erba E, Di Stefano P, Turco E, Tarone G, Defilippi P. Integrin regulation of epidermal growth factor (EGF) receptor and of EGF-dependent responses. Biochem Soc Trans [Internet]. 2004 [accessed 2016 Feb 20];32:438–42. http://www.ncbi.nlm.nih.gov/pubmed/15157155.
- Montresor A, Bolomini-Vittori M, Toffali L, Rossi B, Constantin G, Laudanna C. JAK tyrosine kinases promote hierarchical activation of Rho and Rap modules of integrin activation. J Cell Biol [Internet]. 2013 [accessed 2016 Feb 20];203:1003–19. http://www.pubmedcentral.nih.gov/articlerender.fcgi?artid=3871442&tool=pmcentrez&rendertype=abstract.
- Eberwein P, Laird D, Schulz S, Reinhard T, Steinberg T, Tomakidi P. Modulation of focal adhesion constituents and their down-stream events by EGF: on the cross-talk of integrins and growth factor receptors. Biochim Biophys Acta, Mol Cell Res [Internet]. 2015 [accessed 2016 Jan 9];1853:2183–98. http://www.ncbi.nlm.nih.gov/pubmed/26079101.
- Schwartz MA. Integrins, oncogenes, and anchorage independence. J Cell Biol. 1997;139:575–78. doi:https://doi.org/10.1083/jcb.139.3.575.
- Courter DL, Lomas L, Scatena M, Giachelli CM. Src kinase activity is required for integrin α V β 3 -mediated activation of nuclear factor-κB. J Biol Chem [Internet]. 2005 [accessed 2018 Apr 25];280:12145–51. http://www.ncbi.nlm.nih.gov/pubmed/15695822.
- Scatena M, Almeida M, Chaisson ML, Fausto N, Nicosia RF, Giachelli CM. NF-kappaB mediates alphavbeta3 integrin-induced endothelial cell survival. J Cell Biol [Internet]. 1998 [accessed 2018 Apr 25];141:1083–93. http://www.ncbi.nlm.nih.gov/pubmed/9585425.
- Aoudjit F, Vuori K. Integrin signaling inhibits paclitaxel-induced apoptosis in breast cancer cells. Oncogene [Internet]. 2001 [accessed 2018 Apr 25];20:4995–5004. http://www.ncbi.nlm.nih.gov/pubmed/11526484.
- Bao W, Strömblad S. Integrin αv-mediated inactivation of p53 controls a MEK1-dependent melanoma cell survival pathway in three-dimensional collagen. J Cell Biol [Internet]. 2004 [accessed 2018 Apr 25];167:745–56. http://www.ncbi.nlm.nih.gov/pubmed/15557124.
- Seguin L, Desgrosellier JS, Weis SM, Cheresh DA. Integrins and cancer: regulators of cancer stemness, metastasis, and drug resistance. Trends Cell Biol [Internet]. 2015 [accessed 2016 Feb 1];25:234–40.http://www.ncbi.nlm.nih.gov/pubmed/25572304.
- Rathinam R, Alahari SK. Important role of integrins in the cancer biology. Cancer Metastasis Rev. 2010;29:223–37. doi:https://doi.org/10.1007/s10555-010-9211-x.
- Pulkka O-P, Mpindi J-P, Tynninen O, Nilsson B, Kallioniemi O, Sihto H, Joensuu H. Clinical relevance of integrin alpha 4 in gastrointestinal stromal tumours. J Cell Mol Med [Internet]. 2018 [accessed 2018 Apr 25];22:2220–30. doi:https://doi.org/10.1111/jcmm.13502.
- Yao ES, Zhang H, Chen -Y-Y, Lee B, Chew K, Moore D, Park C. Increased beta1 integrin is associated with decreased survival in invasive breast cancer. Cancer Res [Internet]. 2007 [accessed 2018 Apr 25];67:659–64. http://www.ncbi.nlm.nih.gov/pubmed/17234776.
- Graff JR, Deddens JA, Konicek BW, Colligan BM, Hurst BM, Carter HW, Carter JH, Li G. Integrin-linked kinase expression increases with prostate tumor grade. Clin Cancer Res [Internet]. 2001 [accessed 2018 Apr 25];7:1987–91. http://www.ncbi.nlm.nih.gov/pubmed/11448915.
- Wehrle-Haller B. Assembly and disassembly of cell matrix adhesions. Curr Opin Cell Biol [Internet]. 2012;24:569–81. doi:https://doi.org/10.1016/j.ceb.2012.06.010.
- Silva R, D’Amico G, Hodivala-Dilke KM, Reynolds LE. Integrins: the keys to unlocking angiogenesis. Arterioscler Thromb Vasc Biol [Internet]. 2008 [accessed 2016 Feb 24];28:1703–13. http://www.ncbi.nlm.nih.gov/pubmed/18658045.
- De Wever O, Mareel M. Role of tissue stroma in cancer cell invasion. J Pathol [Internet]. 2003 [accessed 2017 Oct 23];200:429–47. http://www.ncbi.nlm.nih.gov/pubmed/12845611.
- Lewis MP, Lygoe KA, Nystrom ML, Anderson WP, Speight PM, Marshall JF, Thomas GJ. Tumour-derived TGF-beta1 modulates myofibroblast differentiation and promotes HGF/SF-dependent invasion of squamous carcinoma cells. Br J Cancer [Internet]. 2004 [accessed 2017 Oct 23];90:822–32. http://www.ncbi.nlm.nih.gov/pubmed/14970860.
- Pietras K, Östman A. Hallmarks of cancer: interactions with the tumor stroma. Exp Cell Res [Internet]. 2010;316:1324–31. doi:https://doi.org/10.1016/j.yexcr.2010.02.045.
- Parajuli H, Teh MT, Abrahamsen S, Christoffersen I, Neppelberg E, Lybak S, Osman T, Johannessen AC, Gullberg D, Skarstein K, et al. Integrin A11 is overexpressed by tumour stroma of head and neck squamous cell carcinoma and correlates positively with alpha smooth muscle actin expression. J Oral Pathol Med. 2017;46:267–75. doi:https://doi.org/10.1111/jop.12493.
- Carracedo S, Lu N, Popova SN, Jonsson R, Eckes B, Gullberg D. The fibroblast integrin α11β1 is induced in a mechanosensitive manner involving activin A and regulates myofibroblast differentiation. J Biol Chem. 2010;285:10434–45. doi:https://doi.org/10.1074/jbc.M109.078766.
- Westcott JM, Prechtl AM, Maine EA, Dang TT, Esparza MA, Sun H, Zhou Y, Xie Y, Pearson GW. An epigenetically distinct breast cancer cell subpopulation promotes collective invasion. J Clin Invest. [Internet] 2015; 125:1927–43. http://www.jci.org/articles/view/77767.
- Zheng W, Jiang C, Li R. Integrin and gene network analysis reveals that ITGA5 and ITGB1 are prognostic in non-small-cell lung cancer. Onco Targets Ther. 2016;9:2317–27. doi:https://doi.org/10.2147/OTT.
- Livingstone C. IGF2 and cancer. Endocr Relat Cancer [Internet]. 2013 [accessed 2017 Oct 23];20:R321–39. http://www.ncbi.nlm.nih.gov/pubmed/24080445.
- Tominaga K, Shimamura T, Kimura N, Murayama T, Matsubara D, Kanauchi H, Niida A, Shimizu S, Nishioka K, Tsuji E, et al. Addiction to the IGF2-ID1-IGF2 circuit for maintenance of the breast cancer stem-like cells. Oncogene [Internet]. 2017 [accessed 2017 Oct 23];36:1276–86. doi:https://doi.org/10.1038/onc.2016.293.
- Zhu C-Q, Popova SN, Brown ERS, Barsyte-Lovejoy D, Navab R, Shih W, Li M, Lu M, Jurisica I, Penn LZ, et al. Integrin alpha 11 regulates IGF2 expression in fibroblasts to enhance tumorigenicity of human non-small-cell lung cancer cells. Proc Natl Acad Sci USA [Internet]. 2007 [accessed 2016 Feb 24];104:11754–59. http://www.pnas.org/content/104/28/11754.full.
- Navab R, Strumpf D, To C, Pasko E, Kim KS, Park CJ, Hai J, Liu J, Jonkman J, Barczyk M, et al. Integrin α11β1 regulates cancer stromal stiffness and promotes tumorigenicity and metastasis in non-small cell lung cancer. Oncogene [Internet]. 2015;1–10. doi:https://doi.org/10.1038/onc.2015.254.
- Scott AM, Wolchok JD, Old LJ. Antibody therapy of cancer. Nat Rev Cancer [Internet] 2012 [accessed 2017 Oct 23];12:278–87. doi:https://doi.org/10.1038/nrc3236.
- Weiner LM, Surana R, Wang S. Monoclonal antibodies: versatile platforms for cancer immunotherapy. Nat Rev Immunol [Internet]. 2010 [accessed 2017 Oct 23];10:317–27. doi:https://doi.org/10.1038/nri2744.
- Pandey M, Mahadevan D. Monoclonal antibodies as therapeutics in human malignancies. Future Oncol [Internet]. 2014 [accessed 2016 Feb 20];10:609–36. http://www.ncbi.nlm.nih.gov/pubmed/24754592.
- Xiao T, Takagi J, Coller BS, Wang J-H, Springer TA. Structural basis for allostery in integrins and binding to fibrinogen-mimetic therapeutics. Nature [Internet]. 2004 [accessed 2017 Oct 23];432:59–67. doi:https://doi.org/10.1038/nature02976.
- Moore TI, Aaron J, Chew T-L, Springer TA. Measuring integrin conformational change on the cell surface with super-resolution microscopy. Cell Rep [Internet] 2018 [accessed 2018 June 4];22:1903–12. https://www.sciencedirect.com/science/article/pii/S2211124718301116.
- Shimaoka M, Takagi J, Springer TA. Conformational regulation of integrin structure and function. Annu Rev Biophys Biomol Struct [Internet]. 2002 [accessed 2017 Oct 23];31:485–516. doi:https://doi.org/10.1146/annurev.biophys.31.101101.140922.
- Nelson B, Sidhu SS. Synthetic antibody libraries [Internet]. Totowa (NJ): Humana Press; 2012 [accessed 2017 Oct 23]. p. 27–41. doi:https://doi.org/10.1007/978-1-61779-921-1_2.
- Luo B-H, Carman CV, Springer TA. Structural basis of integrin regulation and signaling. Annu Rev Immunol [Internet]. 2007 [accessed 2017 Oct 23];25:619–47. doi:https://doi.org/10.1146/annurev.immunol.25.022106.141618.
- Persson H, Ye W, Wernimont A, Adams JJ, Koide A, Koide S, Lam R, Sidhu SS. CDR-H3 diversity is not required for antigen recognition by synthetic antibodies. J Mol Biol [Internet]. 2013 [accessed 2016 Feb 12];425:803–11. doi:https://doi.org/10.1016/j.jmb.2012.11.037.
- Fellouse FA, Esaki K, Birtalan S, Raptis D, Cancasci VJ, Koide A, Jhurani P, Vasser M, Wiesmann C, Kossiakoff AA, et al. High-throughput generation of synthetic antibodies from highly functional minimalist phage-displayed libraries. J Mol Biol. 2007;373:924–40. doi:https://doi.org/10.1016/j.jmb.2007.08.005.
- Lefranc M-P, Pommié C, Ruiz M, Giudicelli V, Foulquier E, Truong L, Thouvenin-Contet V, Lefranc G. IMGT unique numbering for immunoglobulin and T cell receptor variable domains and Ig superfamily V-like domains. Dev Comp Immunol [Internet]. 2003 [accessed 2018 Dec 17]; 27:55–77. http://www.ncbi.nlm.nih.gov/pubmed/12477501.
- Bell E, Ivarsson B, Merrill C. Production of a tissue-like structure by contraction of collagen lattices by human fibroblasts of different proliferative potential in vitro. Proc Natl Acad Sci USA [Internet]. 1979 [accessed 2018 Nov 12];76:1274–78. http://www.ncbi.nlm.nih.gov/pubmed/286310.
- Jin T, Li L, Siow RCM, Liu -K-K. A novel collagen gel-based measurement technique for quantitation of cell contraction force. J R Soc Interface [Internet]. 2015 [accessed 2018 Nov 12];12:20141365–20141365. doi:https://doi.org/10.1098/rsif.2014.1365.
- Byron A, Humphries JD, Askari JA, Craig SE, Mould AP, Humphries MJ. Anti-integrin monoclonal antibodies. J Cell Sci [Internet]. 2009;122:4009–11. doi:https://doi.org/10.1242/jcs.056770.
- Mateo J, Berlin J, de Bono JS, Cohen RB, Keedy V, Mugundu G, Zhang L, Abbattista A, Davis C, Gallo Stampino C, et al. A first-in-human study of the anti-α5β1 integrin monoclonal antibody PF-04605412 administered intravenously to patients with advanced solid tumors. Cancer Chemother Pharmacol [Internet]. 2014 [accessed 2019 Sept 6];74:1039–46. doi:https://doi.org/10.1007/s00280-014-2576-8.
- McNeel DG. Phase I trial of a monoclonal antibody specific for v 3 Integrin (MEDI-522) in patients with advanced malignancies, including an assessment of effect on tumor perfusion. Clin Cancer Res [Internet]. 2005 [accessed 2019 Sept 6];11:7851–60. doi:https://doi.org/10.1158/1078-0432.CCR-05-0262.
- Hussain M, Le Moulec S, Gimmi C, Bruns R, Straub J, Miller K. Differential effect on bone lesions of targeting integrins: randomized phase II trial of abituzumab in patients with metastatic castration-resistant prostate cancer. Clin Cancer Res [Internet]. 2016 [accessed 2019 Sept 6];22:3192–200. doi:https://doi.org/10.1158/1078-0432.CCR-15-2512.
- Bell-McGuinn KM, Matthews CM, Ho SN, Barve M, Gilbert L, Penson RT, Lengyel E, Palaparthy R, Gilder K, Vassos A, et al. A phase II, single-arm study of the anti-α5β1 integrin antibody volociximab as monotherapy in patients with platinum-resistant advanced epithelial ovarian or primary peritoneal cancer. Gynecol Oncol [Internet]. 2011 [accessed 2019 Sept 6];121:273–79. https://linkinghub.elsevier.com/retrieve/pii/S0090825810012692.
- Chen G, Gorelik L, Simon KJ, Pavlenco A, Cheung A, Brickelmaier M, Chen LL, Jin P, Weinreb PH, Sidhu SS. Synthetic antibodies and peptides recognizing progressive multifocal leukoencephalopathyspecific point mutations in polyomavirus JC capsid viral protein 1. MAbs [Internet] 2015 [accessed 2017 Oct 23];7:681–92. doi:https://doi.org/10.1080/19420862.2015.1038447.
- Koellhoffer JF, Chen G, Sandesara RG, Bale S, Ollmann Saphire E, Chandran K, Sidhu SS, Lai JR. Two synthetic antibodies that recognize and neutralize distinct proteolytic forms of the ebola virus envelope glycoprotein. ChemBioChem. 2012;13:2549–57. doi:https://doi.org/10.1002/cbic.201200493.
- Miersch S, Maruthachalam BV, Geyer CR, Sidhu SS. Structure-directed and tailored diversity synthetic antibody libraries yield novel anti-EGFR antagonists. ACS Chem Biol [Internet]. 2017 [accessed 2017 Oct 23];12:1381–89. http://www.ncbi.nlm.nih.gov/pubmed/28375604.
- Searle BC. Scaffold: a bioinformatic tool for validating MS/MS-based proteomic studies. Proteomics [Internet]. 2010 [accessed 2018 Dec 17];10:1265–69. doi:https://doi.org/10.1002/pmic.200900437.
- Minoche AE, Dohm JC, Himmelbauer H. Evaluation of genomic high-throughput sequencing data generated on illumina HiSeq and genome analyzer systems. Genome Biol [Internet]. 2011 [accessed 2018 June 4];12:R112. doi:https://doi.org/10.1186/gb-2011-12-11-r112.
- Kelil A, Wang S, Brzezinski R. CLUSS2: an alignment-independent algorithm for clustering protein families with multiple biological functions. Int J Comput Biol Drug Des [Internet]. 2008 [accessed 2019 Mar 28];1:122–40. http://www.ncbi.nlm.nih.gov/pubmed/20058485.