
ABSTRACT
Recently, cation exchange chromatography (CEX) using aqueous volatile buffers was directly coupled with mass spectrometry (MS) and applied for intact analysis of therapeutic proteins and antibodies. In our study, chemical modifications responsible for charge variants were identified by CEX-UV-MS for a monoclonal antibody (mAb), a bispecific antibody, and an Fc-fusion protein. We also report post-CEX column addition of organic solvent and acid followed by mixing at elevated temperatures, which unfolded proteins, increased ion intensity (sensitivity) and facilitated top-down analysis. mAb stressed by hydrogen peroxide oxidation was used as a model system, which produced additional CEX peaks. The on-line CEX-UV-MS top-down analysis produced gas-phase fragments containing one or two methionine residues. Oxidation of some methionine residues contributed to earlier (acidic), some to later (basic) eluting peaks, while oxidation of other residues did not change CEX elution. The abundance of the oxidized and non-oxidized fragment ions also allowed estimation of the oxidation percentage of different methionine residues in stressed mAb. CEX-UV-MS measurement revealed a new intact antibody proteoform at 5% that eluted as a basic peak and included paired modifications: high-mannose glycosylation and remaining C-terminal lysine residue (M5/M5 + K). This finding was confirmed by peptide mapping and on-column disulfide reduction coupled with reversed-phase liquid chromatography – top-down MS analysis of the collected basic peak. Overall, our results demonstrate the utility of the on-line method in providing site-specific structural information of charge modifications without fraction collection and laborious peptide mapping.
Introduction
Antibody-based molecules, including recombinant monoclonal antibodies (mAbs), bispecific antibodies, antibody fragments, and Fc-fusion proteins, constitute an important class of therapeutic proteins. They are heterogeneous in their biochemical and biophysical properties due to multiple enzymatic and chemical post-translational modifications (PTMs) that occur during the manufacturing process.Citation1 Many of these modifications lead to changes in surface-exposed charged residues or modify the acid dissociation constant,Citation2 which changes the overall surface charge distribution of the antibody.Citation3 Compared with the major constituents, species with a lower apparent isoelectric point (pI) are considered acidic species,Citation4,Citation5 while basic peaks refer to species with a higher pI value.Citation6-Citation8 Methyl-glyoxal of arginine residues,Citation9 deamidation of asparagine residues,Citation6,Citation10 glycation,Citation11 or the presence of sialic acid and trisulfide bonds typically yield acidic variants.Citation12 Modifications that form basic variants include C-terminal lysine,Citation12,Citation13 N-terminal glutamine,Citation14 C-terminal amidation,Citation15 and the formation of succinimide from isomerization of aspartate residues.Citation16-Citation18 The existence of certain variants may affect the immunogenicity, half-life, bioactivity, and stability of the therapeutic antibodies.Citation19 Regulatory authorities require in-depth characterization and detailed quality control of charge variants in biopharmaceuticals to demonstrate similarity of the drug substance between manufactured batches, throughout the production continuum.Citation20 This can also guide the development of process control strategies to remove or reduce the undesired charge variants.Citation21 Furthermore, elucidation of new and existing modifications contributing to charge heterogeneity can extend our knowledge on antibody charge variant characteristics.Citation7
As a conventional and nondenaturing technique, ion-exchange chromatography (IEX) has been widely used to separate and isolate protein charge variants during protein purification and for subsequent characterization.Citation22-Citation24 Upon the separation of charge variants by IEX, current strategies to determine the effects of modifications on specific charge variant peak involve isolating the peak of interest followed by various mass spectrometric analyses, such as intact mass analysis, peptide mapping, and glycan analysis.Citation10,Citation25 In addition to being limited by time and resources, this two-step approach may overlook the minor species that do not exhibit distinctive UV peaks and introduce artifacts because of the lengthy sample preparation processes.Citation26 Therefore, the ability to directly couple IEX to high-resolution mass spectrometry (MS) is highly desirable to enable sensitive MS detection, which can significantly improve efficiency for charge heterogeneity characterization.
Online combination of IEX and MS has been limited due to the inherent incompatibility between the conventional, nonvolatile IEX buffers and direct desolvation in MS analysis. Online two-dimensional liquid chromatography coupled to MS (2D-LC-MS) was applied to address the solvent incompatibility issue and was first demonstrated by Alvarez et al.,Citation11 which enabled the rapid characterization of mAb charge and size variants.Citation27,Citation28 In that approach, the mass measurement of each charge variant separated by IEX (first dimension) is achieved by an online desalting step and subsequent reversed-phase (RP) LC-MS analysis (second dimension). A strategy for the direct coupling of MS with IEX involved the application of a pH gradient using volatile salts.Citation23,Citation24,Citation29-Citation31 Online weak cation exchange (WCX)-MS has been reported for analyzing IgG2 mAbs by using an ammonium hydroxide-based pH gradient.Citation32 Characterization of digested mAbs and proteins with molecular weights below ~30 kDa has also been described by utilizing an ammonium formate and ammonium acetate-based pH and salt gradient.Citation29,Citation33 Yan et al. recently developed a method that combines a generic strong cation exchange (SCX) chromatography step with ultrasensitive online native MS analysis optimized for mAb separation and detection.Citation34 Bailey et al. demonstrated the online WCX-MS analysis of an mAb using a method that incorporates a well-controlled pH gradient with high mass resolution and lower adduct formation.Citation35
Here, we describe increasing sensitivity and the addition of top-down to CEX-MS to achieve site-specific structural information of charge modifications. Unlike a bottom-up workflow, which is typically more laborious, lengthy, and with sample preparation that can cause erroneous modifications,Citation36 top-down strategies,Citation37-Citation39 in which mAbs are left intact, can largely overcome these artifacts.Citation40-Citation44 Additionally, CEX has greater resolving power as compared to RP LC and allows complete separation of intact antibody molecules even with one charged modification or a modification leading to partial net charge change.Citation7,Citation10,Citation23,Citation29,Citation35 With a few exceptions,Citation45 RP separation of protein charge variants with one modification is typically relatively poor,Citation46,Citation47 but RP LC-MS is sensitive and easily amenable to top-down analysis.Citation43,Citation48-Citation51 This is because proteins elute in the RP mobile phase in an unfolded and highly charged state,Citation52 which enables ionization prior to entering the mass analyzer.Citation53,Citation54 RP LC-MS has therefore been widely used for the characterization of therapeutic proteins and antibodies.Citation50,Citation55-Citation58
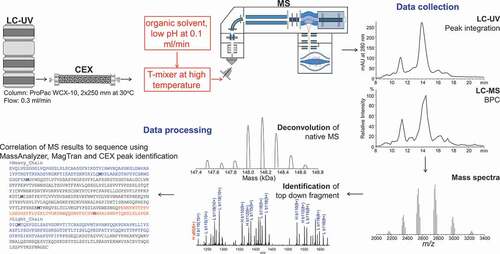
To increase the sensitivity of CEX-MS, we introduced a post-column addition that facilitates the top-down analysis of mAbs (). We used a canonical full-length antibody, bispecific antibody, and Fc-fusion protein to demonstrate the capability of the optimized CEX-MS methods. Additionally, CEX-MS top-down analysis of oxidized antibody determined the oxidation site, elution profile of the oxidized species, and estimated oxidation percentage. These findings agree with peptide mapping data of the oxidized mAb.Citation59 A new proteoform in the basic peak was uncovered using our online CEX-UV-MS approach, and this result was confirmed by peptide mapping, online RP LC-top-down-MS, and LC-MS/MS analysis.
Figure 1. The workflow for online CEX-UV-MS and top-down analyses. CEX provides separation and isolation of protein charge variants. The mass measurement of each charge variant separated by CEX can be achieved by online MS analysis. A post-column addition is introduced to increase the sensitivity of CEX-MS and to facilitate top-down analysis of mAbs. The LC-UV and LC-MS elution profiles of the charge variants, accurate mass, and top-down fragmentation facilitated site-specific structural analysis. See text for details
Results
Method optimization
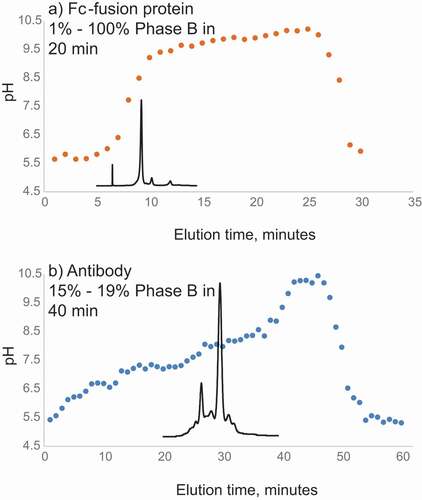
The CEX conditions using aqueous ammonium acetate at pH 5–9.5 produced a relatively low ion signal when delivered directly to MS. When online CEX-UV-MS analysis was performed to obtain intact mass, only ~30 µg of antibody was used to obtain mass spectra of the main CEX peak and several isoforms with high resolution. In several studies, as little as 2 µg was used to accurately determine the mass of main CEX peak of 50 kDa Fc-fusion protein. Relatively large (100 µg) sample loads were required for the high MS resolution needed for top-down MS analysis. Acetonitrile (ACN) was added to the aqueous CEX buffers at 10% but did not produce significant increases in the charge state and ion signal. Adding 20% of organic solvent resulted in the appearance of additional CEX peaks, indicating that partial in-solution or on-column unfolding was taking place. As the additional peaks often appeared as acidic peaks with the presence of organic solvents, we suspected that oxidation with high hydrogen peroxide (see below) was also leading to partial unfolding and appeared as acidic species. The charge variants of the Fc-fusion protein and mAb were eluted within the approximately linear region of pH gradient (). The buffer pH during the protein elution agreed with pI values of the Fc-fusion protein (pI 8.0) and mAb (8.5). A salt concentration gradient from 20 mM to 200 mM ammonium acetate was evaluated at constant pH, which was one pH unit below the pI of an Fc-fusion protein of interest. Although the protein eluted from the column and mass was successfully measured, separation of acidic and basic fractions was inferior, as compared to the pH gradient (data not shown). In our setup, pH gradient showed better results than ammonium acetate salt concentration gradient.
Figure 2. (a) Measured pH values of the collected 0.3 mL fractions eluting every minute from the CEX column during theoretical linear pH gradient of pH 5–9.5 (1%-100% B) between 1 and 19 min used for analysis of the Fc-fusion protein (with theoretical pI 8.5). (b) Measured pH values of the collected 0.3 mL fractions eluting every minute from the CEX column during linear pH gradient of pH 5.77–5.95 (15%-19% of pH 5–9.5 B) between 1 and 40 minutes used for analysis of the mAb (with theoretical pI 8.0). CEX profile of the antibody is overlaid. Buffer A: 50 mM ammonium acetate adjusted with acetic acid, pH 5. Buffer B: 50 mM ammonium acetate adjusted with ammonium hydroxide, pH 9.5
Using mAb as a model, optimization of the CEX method was performed by T-mixing the organic solvent and acid with the CEX solution at elevated temperatures (). Upon electrospraying from the aqueous CEX buffer at a flow rate of 0.3 mL/min (), the charge state distribution of the antibody ions ranged from 24+ to 30+, with intensity of the mass spectrum at 5.5E4. The aqueous CEX at 0.3 ml/min was then mixed post-column with the organic-containing, acidic solvent at 0.1 ml/min (, middle panels). The percentages of the post-column solvent components, therefore, need to be divided by 4 to obtain percentages of the components in the final solution. When the nondenaturing aqueous solution was T-mixed with 90% ACN, 8% water, and 2% formic acid (FA) at room temperature, the charge states of the antibody ions shifted to a region with the 37+ charged ions at the highest intensity. Additionally, the intensity of the acquired mass spectrum increased to 9.9E4 compared to the native aqueous CEX condition. In the next experiment, the native CEX solution was mixed with 70% isopropanol (IPA), 5% water, and 25% FA online, and the mixer temperature was set as 90ºC. The intensity of the mass spectrum was increased to 1.6E5. The 39+ ions of the antibody became the most abundant ions, and the ion intensity was improved to 1.6E5, indicating increased unfolding, charging, and better electrospray. Further increase of the mixer temperature from 90ºC to 110ºC led to only a slight increase in charge state and ion intensity. The average charge state of antibody ions increased to 41+, and ion intensity increased to 2.8E5. Similar charge state increase was observed for the Fc-fusion proteins. However, signal intensity did not increase for all of the Fc-fusion proteins.
Figure 3. (a) Top-down fragmentation mass spectra after in-source collision induced dissociation of the multiply charged antibody ions. Ion intensities are on the top right corners. Aqueous CEX eluent at 0.3 ml/min electrosprayed directly (top panel) and post-column T-mixed with the organic-containing, acidic solvent at 0.1 ml/min (middle to bottom panels). Top-down analysis was performed by increasing in-source voltage and fragmenting all entering multiply charged protein ions. The column was at room temperature, unless specified on the figure. (b) Electrospray ionization mass spectra including multiply charged ions of an intact antibody from native aqueous CEX condition (top), different post-CEX conditions (middle), offline direct infusion (bottom), and RP LC-UV-MS (bottom). Ion intensity values are on the top right corners. The numbers with plus sign indicate charge states. Other conditions are shown in the figure
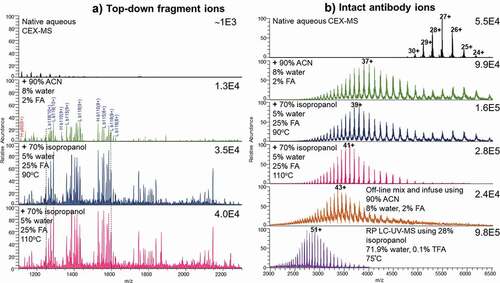
Our data suggest that post-column addition of the organic solvent (IPA), acid (FA), and elevated temperature (90–110ºC) resulted in unfolding of the antibody and protein molecules, increasing average charge state and ion intensity of aqueous CEX prior to entering the electrospray ionization (ESI) interface. The results of online T-mixing were compared with the direct infusion of 0.1 g/L antibody at a flow rate of 0.4 mL/min. With direct infusion from 90% ACN, 8% water, and 2% FA (, bottom), mAb showed a similar charge distribution to that of the CEX solution T-mixed with IPA, water, and FA at 110ºC. However, using T-mixer to combine the CEX solution with the unfolding solution did not reach the same m/z region as that obtained from RP LC-MS. In RP LC-MS experiments, the ions of antibody generated from the column eluent including 28% IPA, 71.9% water, and 0.1% TFA at 75ºC appear to be mainly in m/z 2000–4000 region (, bottom). Although RP buffer conditions were similar to CEX after T-mixing, RP LC-MS of the same antibody produced on average 51+ charged ions and even higher ion intensity with only 5 µg injected, suggesting that interaction with RP stationary phase may provide additional unfolding.
For different solution conditions, top-down analysis was performed by increasing in-source voltage and fragmenting all entering multiply charged protein ions. The top-down fragmentation of the ions obtained from aqueous CEX solution led to an ion intensity of ~1E3 in the mass spectrum (). When the CEX solution (at 0.3 mL/min) was T-mixed with different organic, acidic solutions (at 0.1 mL/min), the intensity of the fragment ions improves significantly (, middle to bottom panels). The addition of IPA and FA increased the intensity of top-down fragments by 10-fold, and adding heat increased abundance by more than threefold. Our findings suggest that the strongest intensity of the top-down fragment ions can be obtained by T-mixing the native CEX solution with IPA, water, and FA at 110ºC. As reduced protein produces higher sequence coverage by top-down, online oxidation-reduction of disulfide bonds with volatile performic acidCitation60,Citation61 was attempted by T-mixing, but without success. Online electrochemical reduction of disulfide bonds (like in references 73, 74) would be another approach to explore in future method optimization.
Example of CEX-UV-MS for bispecific antibody and Fc-fusion protein
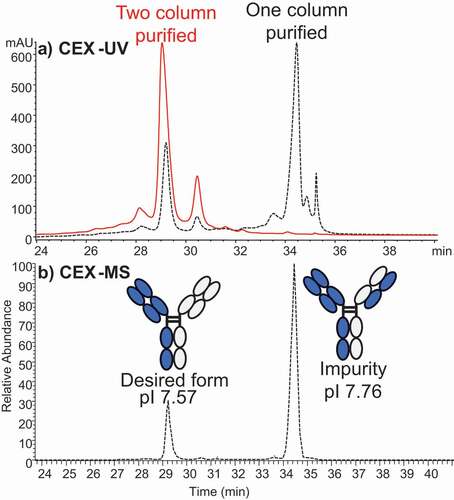
Using the method optimized for antibodies, we conducted online CEX-MS studies of one bispecific antibody and one Fc-fusion protein by adjusting the pH gradient. First column (Protein A) purification of a bispecific antibody produced two main species surrounded by minor satellite peaks (). Based on the measured mass, the smaller species with abundance of only ~20% was identified as the desired bispecific antibody, while the predominant variant contained a mispaired light chain (LC). This finding was useful in guiding the following purification step, which enriched the desired bispecific antibody. The observed CEX elution order agreed with the theoretical pI values of the bispecific antibody (pI 7.57) and the mispaired variant (pI 7.76). Our results are also similar to the measurements reported by Phung et al.Citation62
Figure 4. (a) CEX-UV profile of a bispecific antibody from two samples that have different degrees of purification before CEX-UV-MS analysis. The UV profile of antibody after only one-column (protein A column) purification is shown in dash line, and the UV profile of antibody after two-column purification is displayed in solid line. (b) CEX-MS profile of the bispecific antibody after only one-column purification. The desired form and impurity were identified based on MS measurement
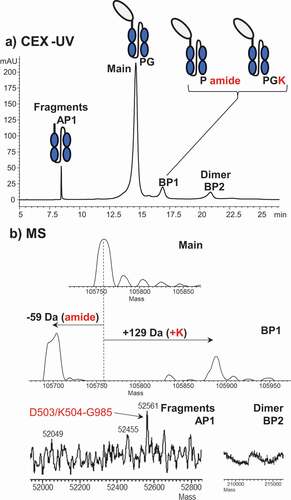
CEX-UV-MS analysis of an Fc-fusion protein () identified earlier eluting acidic peak 1 (AP1) as an Fc fragment below the hinge, and later eluting basic peak 1 (BP1) as containing residual C-terminal lysine residue or C-terminal amidation. The most basic peak, BP2, was identified as the dimer of the main product, but its percentage was significantly higher than dimer measured by size exclusion chromatography (data not shown). The dimer was thought to result from on-column concentration and partial unfolding of the protein bound to the CEX resin. We noted that only some proteins are susceptible to suspected on-column aggregation. This effect can be addressed by changing the buffer system or column.
Figure 5. (a) CEX-UV profile of an Fc-fusion protein and (b) deconvoluted mass spectra of each peak in the CEX-UV profile of the Fc-fusion protein. In panel (a), the cartoon of the Fc-fusion protein represents the assignment of each peak based on MS measurement
In these examples, accurate mass measurements were sufficient to establish the identity of the charge variants and guide the further process development. In the following study, however, the top-down analysis was needed to obtain site-specific structural information of stressed antibody.
CEX-UV-top-down MS of oxidized antibody
The hydrogen peroxide stress resulted in the appearance of new CEX-UV peaks and the need to identify the oxidized antibody species (proteoforms) under each peak ( and Figure S1). The newly developed method was used to compare the unmodified and stressed antibody. CEX-UV-top-down MS analysis of the antibody sample stressed by hydrogen peroxide was performed as follows (). CEX separation followed by the T-mixing and in-source top-down fragmentation resulted in several large gas-phase fragment ions containing one and several methionine residues. Approximate percentages of oxidation of different methionine residues were deduced from abundances of the oxidized and non-oxidized fragment ions. Native aqueous CEX at 0.3 ml/min was mixed post-column with the organic-containing, acidic solvent at 0.1 ml/min with the mixer heated to 110ºC. After the mixer, the solution was delivered to MS for intact and top-down analyses. The intact analysis showed a mass increase by ~16 Da for the lowest hydrogen peroxide level, and higher mass additions for higher hydrogen peroxide levels, indicating oxidation.
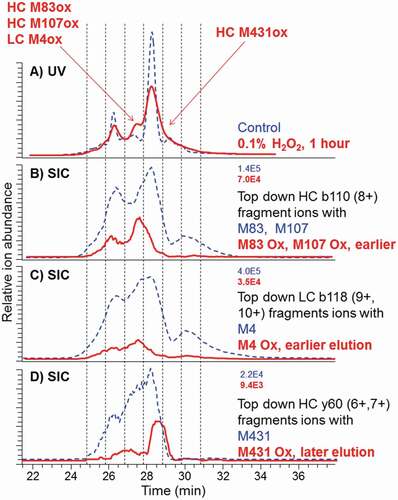
Figure 6. CEX-UV profiles with detection at 280 nm and CEX selected ion chromatograms (SIC) for top-down fragments of the control antibody (dash) and after 1-h stress by 0.1% hydrogen peroxide (bold solid line). Maximum ion intensities are shown at the top right of SEC plots. SIC of M4 Ox was elevated (not to scale) to better visualize the elution time. Ion intensity should be used for quantitation
We used hydrogen peroxide as an oxidant reagent because it is a common component of cleaning reagents that are widely used for biopharmaceutical production, purification, and fill/finish equipment and facilities. If not completely removed after cleaning, hydrogen peroxide may cause oxidation in the produced protein. Previous studies have demonstrated that hydrogen peroxide specifically oxidizes methionine.Citation63,Citation64 A comparison of the CEX-UV profiles of the control and different oxidized antibody samples shows that, upon oxidation by 0.01% and 0.1% hydrogen peroxide for 1 h at room temperature, the proteoform distribution of the oxidized antibody appears to be similar to that of the control sample (Figure S1). Six main peaks were observed, with Peak 4 considered the main product. At the highest concentration of hydrogen peroxide of 1%, however, the entire CEX profile of the oxidized antibody shifted to a lower retention time region. This was consistent with the previous studies suggesting that the oxidized protein variants may elute earlier as acidic species.Citation65-Citation67
The antibody oxidized by 0.1% hydrogen peroxide was selected as a model system because the change was moderate, the area of new peaks was below the original peaks (unlike the case of 1% hydrogen peroxide), and produced detectable amounts of oxidized antibody species. We found that the oxidation at different sites had different effects on the elution pattern of oxidized antibody species (-). Oxidation on M83 and M107 of heavy chain (HC) caused an earlier elution compared to the control sample (). The fragment ions from HC b110 (8+) containing M83 and M107 were the most abundant among all the identified fragment ions of antibody. Antibody molecules with oxidation on M4 of the LC represented by LC b118 fragments displayed a relatively low intensity and eluted slightly earlier than the control sample (). The oxidation on Met 431 of HC produces peaks with later elution, indicating that the oxidation on Met 431 of HC results in more basic species of the antibody (). In this setting, top-down fragments containing regular and oxidized M255 and M361 were not monitored.
Examples of top-down mass spectra of oxidized antibody are shown in Figure S2. The fragment ion abundancies representing the unmodified and oxidized species from Figure S2 were used for plotting selected ion chromatograms in . The percentage of oxidation in the CEX peaks and specified methionine residues can be estimated from the peak areas of selected ion chromatograms of the 0.1% hydrogen peroxide (oxidized) and control sample. For example, top-down mass spectrum containing fragment b110 (8+), including 110 residues from the HC N-terminus (entire VH1 region including M83 in folded frame 3 and M107 in solvent-exposed complementary-determining region 3 (CDR3)), showed ~40% oxidation (Figure S2B). In addition, HC M431 oxidation in CEX post-main is ~50% (Figure S2, panel C), while LC M4 oxidation in CEX main peak or another peak is minor (<5%, Figure S2, panel B). On the other hand, top-down mass spectrum containing fragment y114 (6+), including 114 residues from the HC C-terminus (entire CH3 region including M361, M431), showed little oxidation <3% (Figure S3). This implies that oxidation is not in CH3, including M361 and M431, but contains high abundance of most likely M107 oxidation from HC CDR3. These are examples of structural information of CEX peaks provided by top-down fragmentation.
Selected ion chromatogram for top-down fragments HC y60 (6+,7+) indicated the presence of antibody species with open disulfide Cys370-Cys428 in the CH3 region that eluted under the main peak(s) (Figure S2A). This result indicates that open disulfide does not lead to later elution in CEX. The CH3 domain contains a single buried disulfide bond. Prior studies showed that the secondary and tertiary structures of reduced and oxidized CH3 dimer were similar, and differences were observed only under >1 M guanidine, extremes of pH and temperature.Citation68 This is not the case for the aqueous CEX performed under near physiological pH condition. Our experiment indicated that the structure and CEX elution are the same for antibody species with reduced and oxidized CH3, as suspected from findings by McAuley et al.Citation68 Contrary to CEX, in RP LC, the open disulfide leads to later elution due to more complete unfolding in the low-pH, organic buffer and stronger adsorption to the resin (data are not shown here). The oxidized top-down fragment HC y60 (6+, 7+) eluted later (), suggesting that M431 oxidation increased a more basic antibody species. There is no evidence for the correlation between HC Met 431 oxidation and the open disulfide, suggesting that HC y60 (6+, 7+) fragment ions can be used for quantitation. Our top-down approach enables a quick and direct analysis of oxidation percentage in therapeutic proteins without the introduction of artifacts.
mAb new peak characterization by CEX-UV-MS of intact and on-column reduction followed by top-down
The online CEX-UV-MS analysis of the main peak and acidic peaks of the mAb agreed with the previous work by Harris et al. and Bailey et al. ().Citation35,Citation59 Characterization of the mAb from lot M58268 revealed a basic peak (peak 6) at ~5%. Accurate mass measurements indicated that the CEX peak contained intact antibody proteoform including high-mannose glycosylation and remaining C-terminal lysine residue (M5/M5 + K) paired in one molecule (Figure S4). We also analyzed several other batches of the antibody using the described method ( and S5). For the antibody samples from lots 3044033 and 3072991, the basic peak appeared at lower percentage (~3%) compared with the lot M58268 that we used throughout this study. Improved sensitivity of the described method allowed detection of the antibody proteoform with pairing of high-mannose glycosylation and C-terminal lysine residue (M5/M5 + K). Pairing of oligosaccharides in the Fc region of IgG antibodies was described before,Citation69 including M5/M5 pairing.Citation70
Figure 7. (a) CEX-UV profile and peak assignment of mAb. Different colors are used to represent different batches of mAb: black bold lotM586268; red lot3072991; and green lot3044033. Each CEX-UV peak is assigned based on the MS measurement, and the peak assignment is summarized in the table below. In the table, Asp isomerization represents the isomerization of Asp into isoaspartic acid. The table also compares the peak assignment in this work with the previous results from Harris et al. A cartoon of the antibody proteoform with high mannose and C-terminal K (M5/M5 + K) represents CEX peak 6. (b) peptide mapping results of each CEX-UV peak of mAb. Percentages of main modifications in each CEX-UV peak are shown as bar graph
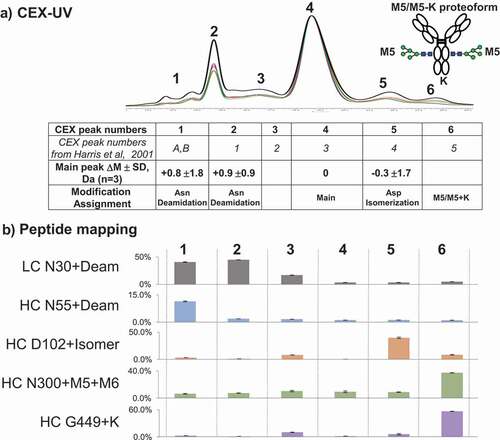
On-column reduction, described in detail elsewhere,Citation71-Citation73 followed by top-down analysis also revealed high percentages of C-terminal K and mannose 5 and 6 species (M5, M6) in mAb. On-column reduction of antibody by tris(2-carboxyethyl)phosphine (TCEP) injection was performed to reduce disulfide bonds before RP LC-UV-MS and top-down (Figure S6). Examples of the application of on-column reduction for identification of CEX main peak (peak 4) and basic peak (peak 6) of the antibody are provided in Figure S7 and S8. Top-down mass spectra and selected ion chromatograms of fragment y60 (5+) demonstrate the addition of lysine in the basic peak (peak 6). After triplicate CEX-UV-MS analysis, the acidic peaks were identified as containing intact deamidated antibody species from the increase of average mass by ~1 Da with useful standard deviation (). However, low isotope abundance of the top-down fragments did not allow calculation of average mass increase by 1 Da with high confidence (not shown here). Additionally, proteoform assignment by online CEX-UV-MS is consistent with the peptide mapping of each collected CEX fraction from the antibody (). Peptide mapping of collected CEX fractions confirmed C-terminal lysine and mannose 5, 6 species (M5, M6). This approach highlights the utility of CEX-MS in identifying proteoforms with nonrandom distribution of modifications.
Discussion
Here, we describe increasing sensitivity and addition of top-down to CEX-MS in an effort to obtain site-specific structural information of charge modifications, performed without peptide mapping. The post-CEX column addition of the organic solvent (isopropanol), acid (FA), and elevated temperature (110ºC) before the ESI source results in unfolding of the antibody and protein molecules, increasing average charge state and intensity of intact and top-down fragment ions. Examples, including a canonical monoclonal antibody, a bispecific antibody, and an Fc-fusion protein were provided to demonstrate the capability of the online CEX-UV-MS method with enhanced sensitivity.
Top-down analysis was further performed by employing elevated in-source voltage and fragmenting all entering multiply charged protein ions. Using ion selection in the region of the multiply charged ions (for example, m/z 6000 for native aqueous top panel) for top-down fragmentation instead of in-source fragmentation of all entering ions was considered, but showed lower ion intensity. We have not undertaken significant optimization efforts for top-down after ion selection. Increasing charge state (moving to the left on the m/z scale) and increasing ion intensity by adding organic and temperature in combination with in-source fragmentation appeared to be the optimal condition and combination. Although the method does not provide opportunity for the proteoform selection by m/z for top-down analysis, it enables chromatographic separation of pure proteoforms followed by in-source fragmentation.
By combining CEX-MS with top-down to analyze the oxidized antibody, we obtain top-down fragments containing one and several methionine residues. Selected ion chromatograms of the oxidized and non-oxidized fragment ions were utilized to determine approximate percentages of oxidation and elution profiles of different methionine residues without peptide mapping. No evidence was found for the oxidation of tryptophan in this work. Oxidation by hydrogen peroxide at 1% induced oxidation of all methionine residues in an IgG antibody: over 90% oxidation in 3 methionine residues HC M258, M364, M434 and over 4% in the remaining 3 residues of an IgG1 antibody.Citation74 In contrast, the observed oxidation of tryptophan residues was below 0.8%.Citation74 This trend is also supported by peptide mapping of our test antibody, indicating only minor oxidation of tryptophan residues after 0.1% hydrogen peroxide.
Complexity of top-down mass spectra is typically a challenge across the field when a large number of fragment ions are generated: (a) during direct infusion for a long time, (b) while using more efficient top-down fragmentation techniques (ECD, ETD, UVPD), and (c) on reduced protein. However, in our case the complexity of top-down fragmentation was not high, because of the following: (a) HPLC separation of the individual proteoforms leading to relatively short top-down analysis time for each eluting species, (b) less-efficient CID, and (c) intact antibody with disulfides. At this time, low sequence coverage was probably a more significant issue than complexity. For example, the oxidation percentages of M255 and M361 were not assessable in the presented setting. Future work, such as the use of different top-down fragmentation techniques (ECD, ETD, UVPD) and possible on-line reduction of disulfide bond could improve sequence coverage including the internal residues. In addition, a new basic peak of mAb was characterized by CEX-UV-MS of intact molecules and after on-column reduction followed by top-down and peptide mapping. These studies show that post-CEX column addition of organic solvent, low pH and elevated temperature unfolded proteins, increases sensitivity and facilitates top-down fragmentation, providing detailed and direct structural information of therapeutic proteins.
Materials and methods
Materials and sample preparation
A ProPac WCX-10 column (5 µm particle size, 2.0 × 250 mm) was purchased from Thermo Fisher Scientific (Waltham, MA) for CEX separation. Ammonium acetate (99.999% trace metals basis), acetic acid (99.99% trace metals basis), and hydrogen peroxide solution (≥30%, for trace metals basis) were purchased from Sigma Aldrich (St. Louis, MO). Ammonium hydroxide solution (≥25% in water, for trace analysis) was purchased from Honeywell (Muskegon, MI). Trypsin from bovine pancreas (sequencing grade) was from Roche Biochemical Reagents, Sigma Aldrich (St. Louis, MO). Unless specified, other reagents were purchased from Fisher Scientific (Pittsburgh, PA).
The mAb used in this study (described earlier in Ref. Citation35 and Citation59) was purchased from Genentech (San Francisco, CA) and dissolved in water to reach a final concentration of 20 mg/mL. Unless specified, the antibody samples in this work were from lot M58268. Two other batches, lot 3044033 and 3072991, were also studied to demonstrate the presence of the additional basic peak. Several Fc-fusion proteins and a full-length bispecific antibody used in this study were obtained in house, i.e., from Amgen. Stressed antibody was prepared by incubating the antibody solution with 0.1% hydrogen peroxide in the dark for 1 h at room temperature.
CEX separation coupled with MS analysis
All the CEX experiments were performed on Agilent 1290 coupled with a Thermo Q Exactive Biopharma mass spectrometer equipped with high energy collision dissociation (HCD). The CEX method was optimized using a pH-gradient system of phase A (ammonium acetate, pH 5.0) and B (ammonium acetate, pH 9.5) delivered through a ProPac WCX-10 column at 0.3 mL/min. Upon the injection of an aliquot (40–100 µg) of the protein samples, the gradient was held at 100% phase A for 1 min followed by an increase to 16% phase B in 2 min. Then, the gradient was increased to 18% phase B linearly in 40 min. The gradient was further increased to 100% phase B in 2 min and held at 100% phase B for 4 min. The gradient returned to 100% phase A in 2 min and was held at 100% phase A for 10 min to recondition the column. Resolving power of 70,000 was used for native and top-down MS, and in-source energy was set to maximum allowed 200 eV. In the protein unfolding and top-down experiments, the solution of 70% isopropanol, 25% FA, and 5% water at a flow rate of 0.1 mL/min was T-mixed with the CEX eluent, followed by 1-min exposure to a mixer at elevated temperature before delivering to ESI source. Agilent 1100 static solvent mixer part number G1312-87330 with a volume of 420 µl was maintained at temperatures up to 110ºC in a thermostated column compartment of Agilent 1290 II HPLC system. The specified mixer temperatures were setup temperatures of the column compartments.
Data analysis of intact MS and top-down MS data
Qual Browser (Xcalibur 4.0) software was used for creating and integrating the extracted ion chromatogram (XIC) trace of CEX chromatography. Deconvolution was achieved on MassAnalyzerCitation75,Citation76 (also available from Thermo Scientific as a part of Biopharma Finder). As described previously,Citation37,Citation38 top-down analysis was also carried out automatically by MassAnalyzer, and each fragment was inspected manually.
Fraction collection and peptide mapping
For LC-MS/MS analysis, three runs of 100 µg of the antibody were separated and fractionated into six main regions based on UV (280 nm) CEX chromatogram using identical conditions (column, gradient, and buffers). Corresponding fractions from two runs were collected manually on 500 µL Microcon filter (30 kDa MWCO, Sigma-Aldrich, St. Louis, MO), resulting in duplicate analysis for each fraction. Detailed digestion and LC-MS/MS analysis procedures have been described elsewhere.Citation77 One hundred µL denature solution containing 6 M guanidine hydrochloride, 0.2 M Tris, 2 mM EDTA, and 20 mM methionine (pH 3.5) was present on the top of the filter while the fraction was collected to minimize artificial oxidation caused by collection. Fraction was dried by spinning for 15 min at 14,000 × g and then dissolved in the denature solution with 10 mM dithiothreitol for reduction at 37ºC for 30 min, followed by alkylation (10 mM iodoacetamide) in dark at room temperature for 30 min. The filter of each fraction was further washed with digestion solution (0.1 M Tris, 20 mM methionine, and 5% ACN) three times to remove the residual denature solution. Then, the solution was digested for 1 h with trypsin at a 1:20 enzyme:substrate ratio at 37ºC. Digestions were quenched with 20% FA and washed with 80 µL quench solution (6 M guanidine hydrochloride, 2 mM EDTA, and 20 mM methionine, pH 5.0). The flow-through was collected using a new centrifuge tube.
Tryptic peptides were injected via an auto-sampler onto a Varian Polaris Ether C18 column (Agilent, 2.1 × 250 mm, 3.0 μm particle size, 180 Å pore size) at a flow rate of 0.2 mL/min using Agilent 1290 system. A linear gradient from 100% phase A (water with 0.1% trifluoroacetic acid) to 50% phase B (10% water and 90% ACN with 0.1% trifluoroacetic acid) was applied for 190 min. Tryptic peptides were analyzed online using a Q Exactive Biopharma mass spectrometer (Thermo-Fisher Scientific). Data were collected in data-dependent mode with HCD fragmentation. Data were searched against the mAb HC and LC using MassAnalyzer. Extracted ion chromatograms corresponding to the peptides of interest were obtained through Qual Browser (Xcalibur 4.0) software.
RP LC-MS with online reduction and top-down analysis
The RP LC-MS experiments were performed on Agilent 1290 Infinity II coupled with a Thermo Q Exactive Biopharma (Figure S6) by following previously established protocols.Citation71–Citation73 A solution of TCEP hydrochloride was prepared in water and 0.1% FA at a concentration of 30 mg/mL. For two runs of 100 µg of mAb, the main peak and additional basic peak were separately collected into two Zorbax 300SB-C8 trap columns (Agilent, 1.0 × 50 mm, 3.5 micron) based on UV (280 nm) CEX chromatogram using identical conditions (column, gradient, and buffers). The C8 trap column was washed with RP solvent A and connected in front of the Zorbax 300SB-C8 column (Agilent, 1.0 × 50 mm, 3.5 micron). In RP LC-MS experiments of each peak, 40 µL of TECP solution was loaded on the C8 trap column to conduct online reduction. The eluting solution was further separated on the C8 analytical column. In-source energy was set to maximum (200 eV) to carry out top-down analysis. Qual Browser (Xcalibur 4.0) software was used for creating and integrating the XIC trace of CEX chromatography. Top-down data analysis was conducted using MassAnalyzer, and each fragment was inspected manually.
Disclosure of potential conflicts of interest
No potential conflicts of interest were disclosed.
Supplemental Material
Download MS Word (963.5 KB)Acknowledgments
We gratefully acknowledge Aaron O. Bailey for his help in optimizing the Q-Exactive Biopharma parameters and other useful suggestions. We also thank Zhongqi Zhang for optimizing MassAnalyzer software for deconvolution of the ESI mass spectra; Kate Hutterer and Agatha Wieczorek for providing the samples of mAb and bispecific antibody and related discussions. John Harrahy, Colleen Steinmeyer, Haly Raharimampionona, Stella Song, Heather Franey, Christian DuBose, Steve Brych, Lindsay Dominguez, Sreekanth Suravajjala, Tom Wrona, and Greg Zinkl for providing the Fc-fusion protein and several other protein samples for evaluation of the developed method and related discussions; Patrick Swann for fruitful discussions of proteoforms; and Rohini Deshpande, Chetan Goudar for support of the project. This research was supported by Amgen Inc.
Supplemental material
Supplemental data for this article can be accessed on the publisher’s website.
References
- Houde D, Peng Y, Berkowitz SA, Engen JR. Post-translational modifications differentially affect IgG1 conformation and receptor binding. Molecul Cell Proteomics. 2010;9:1716. doi:https://doi.org/10.1074/mcp.M900540-MCP200.
- Vlasak J, Bussat MC, Wang S, Wagner-Rousset E, Schaefer M, Klinguer-Hamour C, Kirchmeier M, Corvaïa N, Ionescu R, Beck A. Identification and characterization of asparagine deamidation in the light chain CDR1 of a humanized IgG1 antibody. Anal Biochem. 2009;392:145–12. doi:https://doi.org/10.1016/j.ab.2009.05.043.
- Talebi M, Nordborg A, Gaspar A, Lacher NA, Wang Q, He XZ, Haddad PR, Hilder EF. Charge heterogeneity profiling of monoclonal antibodies using low ionic strength ion-exchange chromatography and well-controlled pH gradients on monolithic columns. J Chromatogr A. 2013;1317:148–54. doi:https://doi.org/10.1016/j.chroma.2013.08.061.
- Neill A, Nowak C, Patel R, Ponniah G, Gonzalez N, Miano D, Liu H. Characterization of recombinant monoclonal antibody charge variants using OFFGEL fractionation, weak anion exchange chromatography, and mass spectrometry. Anal Chem. 2015;87:6204–11. doi:https://doi.org/10.1021/acs.analchem.5b01452.
- Vlasak J, Ionescu R. Heterogeneity of monoclonal antibodies revealed by charge-sensitive methods. Curr Pharm Biotechnol. 2008;9:468–81. doi:https://doi.org/10.2174/138920108786786402.
- Gandhi S, Ren D, Xiao G, Bondarenko P, Sloey C, Ricci MS, Krishnan S. Elucidation of degradants in acidic peak of cation exchange chromatography in an IgG1 monoclonal antibody formed on long-term storage in a liquid formulation. Pharm Res. 2012;29:209–24. doi:https://doi.org/10.1007/s11095-011-0536-0.
- Chen XN, Nguyen M, Jacobson F, Ouyang J. Charge-based analysis of antibodies with engineered cysteines: from multiple peaks to a single main peak. MAbs. 2009;1:563–71. doi:https://doi.org/10.4161/mabs.1.6.10058.
- Perkins M, Theiler R, Lunte S, Jeschke M. Determination of the origin of charge heterogeneity in a murine monoclonal antibody. Pharm Res. 2000;17:1110–17. doi:https://doi.org/10.1023/A:1026461830617.
- Chumsae C, Gifford K, Lian W, Liu H, Radziejewski CH, Zhou ZS. Arginine modifications by methylglyoxal: discovery in a recombinant monoclonal antibody and contribution to acidic species. Anal Chem. 2013;85:11401–09. doi:https://doi.org/10.1021/ac402384y.
- Griaud F, Denefeld B, Lang M, Hensinger H, Haberl P, Berg M. Unbiased in-depth characterization of CEX fractions from a stressed monoclonal antibody by mass spectrometry. mAbs. 2017;9:820–30. doi:https://doi.org/10.1080/19420862.2017.1313367.
- Alvarez M, Tremintin G, Wang J, Eng M, Y-H K, Jeong J, Ling VT, Borisov OV. On-line characterization of monoclonal antibody variants by liquid chromatography–mass spectrometry operating in a two-dimensional format. Anal Biochem. 2011;419:17–25. doi:https://doi.org/10.1016/j.ab.2011.07.033.
- Pristatsky P, Cohen SL, Krantz D, Acevedo J, Ionescu R, Vlasak J. Evidence for trisulfide bonds in a recombinant variant of a human IgG2 monoclonal antibody. Anal Chem. 2009;81:6148–55. doi:https://doi.org/10.1021/ac9006254.
- Battersby JE, Snedecor B, Chen C, Champion KM, Riddle L, Vanderlaan M. Affinity–reversed-phase liquid chromatography assay to quantitate recombinant antibodies and antibody fragments in fermentation broth. J Chromatogr A. 2001;927:61–76. doi:https://doi.org/10.1016/S0021-9673(01)01108-6.
- Beck A, Bussat M-C, Zorn N, Robillard V, Klinguer-Hamour C, Chenu S, Goetsch L, Corvaïa N, Van Dorsselaer A, Haeuw J-F. Characterization by liquid chromatography combined with mass spectrometry of monoclonal anti-IGF-1 receptor antibodies produced in CHO and NS0 cells. J Chromatogr B. 2005;819:203–18. doi:https://doi.org/10.1016/j.jchromb.2004.06.052.
- Johnson KA, Paisley-Flango K, Tangarone BS, Porter TJ, Rouse JC. Cation exchange–HPLC and mass spectrometry reveal C-terminal amidation of an IgG1 heavy chain. Anal Biochem. 2007;360:75–83. doi:https://doi.org/10.1016/j.ab.2006.10.012.
- Sreedhara A, Cordoba A, Zhu Q, Kwong J, Liu J. Characterization of the isomerization products of aspartate residues at two different sites in a monoclonal antibody. Pharm Res. 2012;29:187–97. doi:https://doi.org/10.1007/s11095-011-0534-2.
- Xiao G, Bondarenko PV, Jacob J, Chu GC, Chelius D. 18O labeling method for identification and quantification of succinimide in proteins. Anal Chem. 2007;79:2714–21. doi:https://doi.org/10.1021/ac0617870.
- Chu GC, Chelius D, Xiao G, Khor HK, Coulibaly S, Bondarenko PV. Accumulation of succinimide in a recombinant monoclonal antibody in mildly acidic buffers under elevated temperatures. Pharm Res. 2007;24:1145–56. doi:https://doi.org/10.1007/s11095-007-9241-4.
- Liu H, Ponniah G, Zhang H-M, Nowak C, Neill A, Gonzalez-Lopez N, Patel R, Cheng G, Kita AZ, Andrien B. In vitro and in vivo modifications of recombinant and human IgG antibodies. mAbs. 2014;6:1145–54. doi:https://doi.org/10.4161/mabs.29883.
- Berkowitz SA, Engen JR, Mazzeo JR, Jones GB. Analytical tools for characterizing biopharmaceuticals and the implications for biosimilars. Nat Rev Drug Discovery. 2012;11:527. doi:https://doi.org/10.1038/nrd3746.
- Kang X, Kutzko JP, Hayes ML, Frey DD. Monoclonal antibody heterogeneity analysis and deamidation monitoring with high-performance cation-exchange chromatofocusing using simple, two component buffer systems. J Chromatogr A. 2013;1283:89–97. doi:https://doi.org/10.1016/j.chroma.2013.01.101.
- Farsang E, Murisier A, Horváth K, Beck A, Kormány R, Guillarme D, Fekete S. Tuning selectivity in cation-exchange chromatography applied for monoclonal antibody separations, part 1: alternative mobile phases and fine tuning of the separation. J Pharm Biomed Anal. 2019;168:138–47. doi:https://doi.org/10.1016/j.jpba.2019.02.024.
- Trappe A, Fussl F, Carillo S, Zaborowska I, Meleady P, Bones J. Rapid charge variant analysis of monoclonal antibodies to support lead candidate biopharmaceutical development. J Chromatogr B Analyt Technol Biomed Life Sci. 2018;1095:166–76. doi:https://doi.org/10.1016/j.jchromb.2018.07.037.
- Sankaran PK, Kabadi PG, Honnappa CG, Subbarao M, Pai HV, Adhikary L, Palanivelu DV. Identification and quantification of product-related quality attributes in bio-therapeutic monoclonal antibody via a simple, and robust cation-exchange HPLC method compatible with direct online detection of UV and native ESI-QTOF-MS analysis. J Chromatogr B Analyt Technol Biomed Life Sci. 2018;1102–1103:83–95. doi:https://doi.org/10.1016/j.jchromb.2018.10.019.
- Sandra K, Steenbeke M, Vandenheede I, Vanhoenacker G, Sandra P. The versatility of heart-cutting and comprehensive two-dimensional liquid chromatography in monoclonal antibody clone selection. J Chromatogr A. 2017;1523:283–92. doi:https://doi.org/10.1016/j.chroma.2017.06.052.
- Zhang H, Cui W, Gross ML. Mass spectrometry for the biophysical characterization of therapeutic monoclonal antibodies. FEBS Lett. 2014;588:308–17. doi:https://doi.org/10.1016/j.febslet.2013.11.027.
- Stoll DR, Harmes DC, Danforth J, Wagner E, Guillarme D, Fekete S, Beck A. Direct identification of rituximab main isoforms and subunit analysis by online selective comprehensive two-dimensional liquid chromatography–mass spectrometry. Anal Chem. 2015;87:8307–15. doi:https://doi.org/10.1021/acs.analchem.5b01578.
- Sorensen M, Harmes DC, Stoll DR, Staples GO, Fekete S, Guillarme D, Beck A. Comparison of originator and biosimilar therapeutic monoclonal antibodies using comprehensive two-dimensional liquid chromatography coupled with time-of-flight mass spectrometry. mAbs. 2016;8:1224–34. doi:https://doi.org/10.1080/19420862.2016.1203497.
- Fussl F, Cook K, Scheffler K, Farrell A, Mittermayr S, Bones J. Charge variant analysis of monoclonal antibodies using direct coupled pH gradient cation exchange chromatography to high-resolution native mass spectrometry. Anal Chem. 2018;90:4669–76. doi:https://doi.org/10.1021/acs.analchem.7b05241.
- Miao S, Xie P, Zou M, Fan L, Liu X, Zhou Y, Zhao L, Ding D, Wang H, Tan WS. Identification of multiple sources of the acidic charge variants in an IgG1 monoclonal antibody. Appl Microbiol Biotechnol. 2017;101:5627–38. doi:https://doi.org/10.1007/s00253-017-8301-x.
- Guo J, Creasy AD, Barker G, Carta G. Surface induced three-peak elution behavior of a monoclonal antibody during cation exchange chromatography. J Chromatogr A. 2016;1474:85–94. doi:https://doi.org/10.1016/j.chroma.2016.10.061.
- Leblanc Y, Ramon C, Bihoreau N, Chevreux G. Charge variants characterization of a monoclonal antibody by ion exchange chromatography coupled on-line to native mass spectrometry: case study after a long-term storage at +5°C. J Chromatography B. 2017;1048:130–39. doi:https://doi.org/10.1016/j.jchromb.2017.02.017.
- Muneeruddin K, Nazzaro M, Kaltashov IA. Characterization of intact protein conjugates and biopharmaceuticals using ion-exchange chromatography with online detection by native electrospray ionization mass spectrometry and top-down tandem mass spectrometry. Anal Chem. 2015;87:10138–45. doi:https://doi.org/10.1021/acs.analchem.5b02982.
- Yan Y, Liu AP, Wang S, Daly TJ, Li N. Ultrasensitive characterization of charge heterogeneity of therapeutic monoclonal antibodies using strong cation exchange chromatography coupled to native mass spectrometry. Anal Chem. 2018;90:13013–20. doi:https://doi.org/10.1021/acs.analchem.8b03773.
- Bailey AO, Han G, Phung W, Gazis P, Sutton J, Josephs JL, Sandoval W. Charge variant native mass spectrometry benefits mass precision and dynamic range of monoclonal antibody intact mass analysis. MAbs. 2018;10:1214–25. doi:https://doi.org/10.1080/19420862.2018.1521131.
- Beck A, D’Atri V, Ehkirch A, Fekete S, Hernandez-Alba O, Gahoual R, Leize-Wagner E, François Y, Guillarme D, Cianférani S. Cutting-edge multi-level analytical and structural characterization of antibody-drug conjugates: present and future. Expert Rev Proteomics. 2019;16:337–62. doi:https://doi.org/10.1080/14789450.2019.1578215.
- Bondarenko PV, Second TP, Zabrouskov V, Makarov AA, Zhang Z. Mass measurement and top-down HPLC/MS analysis of intact monoclonal antibodies on a hybrid linear quadrupole ion trap-Orbitrap mass spectrometer. J Am Soc Mass Spectrom. 2009;20:1415–24. doi:https://doi.org/10.1016/j.jasms.2009.03.020.
- Zhang Z, Shah B. Characterization of variable regions of monoclonal antibodies by top-down mass spectrometry. Anal Chem. 2007;79:5723–29. doi:https://doi.org/10.1021/ac070483q.
- Chait BT. Mass spectrometry: bottom-up or top-down? Science. 2006;314:65. doi:https://doi.org/10.1126/science.1133987.
- Oyler BL, Khan MM, Smith DF, Harberts EM, Kilgour DPA, Ernst RK, Cross AS, Goodlett DR. Top down tandem mass spectrometric analysis of a chemically modified rough-type lipopolysaccharide vaccine candidate. J Am Soc Mass Spectrom. 2018;29:1221–29. doi:https://doi.org/10.1007/s13361-018-1897-y.
- Nedelkov D, Niederkofler EE, Oran PE, Peterman S, Nelson RW. Top-down mass spectrometric immunoassay for human insulin and its therapeutic analogs. J Proteomics. 2018;175:27–33. doi:https://doi.org/10.1016/j.jprot.2017.08.001.
- Fornelli L, Srzentic K, Huguet R, Mullen C, Sharma S, Zabrouskov V, Fellers RT, Durbin KR, Compton PD, Kelleher NL. Accurate sequence analysis of a monoclonal antibody by top-down and middle-down orbitrap mass spectrometry applying multiple ion activation techniques. Anal Chem. 2018;90:8421–29. doi:https://doi.org/10.1021/acs.analchem.8b00984.
- He L, Anderson LC, Barnidge DR, Murray DL, Hendrickson CL, Marshall AG. Analysis of monoclonal antibodies in human serum as a model for clinical monoclonal gammopathy by use of 21 tesla FT-ICR top-down and middle-down MS/MS. J Am Soc Mass Spectrom. 2017;28:827–38. doi:https://doi.org/10.1007/s13361-017-1602-6.
- Bogdanov B, Smith RD. Proteomics by FTICR mass spectrometry: top down and bottom up. Mass Spectrom Rev. 2005;24:168–200. doi:https://doi.org/10.1002/mas.20015.
- Dillon TM, Bondarenko PV, Speed Ricci M. Development of an analytical reversed-phase high-performance liquid chromatography-electrospray ionization mass spectrometry method for characterization of recombinant antibodies. J Chromatogr A. 2004;1053:299–305. doi:https://doi.org/10.1016/S0021-9673(04)01410-4.
- Chelius D, Huff Wimer ME, Bondarenko PV. Reversed-phase liquid chromatography in-line with negative ionization electrospray mass spectrometry for the characterization of the disulfide-linkages of an immunoglobulin gamma antibody. J Am Soc Mass Spectrom. 2006;17:1590–98. doi:https://doi.org/10.1016/j.jasms.2006.07.008.
- Le JC, Bondarenko PV. Trap for MAbs: characterization of intact monoclonal antibodies using reversed-phase HPLC on-line with ion-trap mass spectrometry. J Am Soc Mass Spectrom. 2005;16:307–11. doi:https://doi.org/10.1016/j.jasms.2004.11.004.
- Zhang L, Vasicek LA, Hsieh S, Zhang S, Bateman KP, Henion J. Top-down LC-MS quantitation of intact denatured and native monoclonal antibodies in biological samples. Bioanalysis. 2018;10:1039–54. doi:https://doi.org/10.4155/bio-2017-0282.
- Srzentic K, Nagornov KO, Fornelli L, Lobas AA, Ayoub D, Kozhinov AN, Gasilova N, Menin L, Beck A, Gorshkov MV, et al. Multiplexed middle-down mass spectrometry as a method for revealing light and heavy chain connectivity in a monoclonal antibody. Anal Chem. 2018;90:12527–35. doi:https://doi.org/10.1021/acs.analchem.8b02398.
- Beck A, Debaene F, Diemer H, Wagner-Rousset E, Colas O, Van Dorsselaer A, Cianferani S. Cutting-edge mass spectrometry characterization of originator, biosimilar and biobetter antibodies. J Mass Spectrom. 2015;50:285–97. doi:https://doi.org/10.1002/jms.3554.
- Dekker L, Wu S, Vanduijn M, Tolic N, Stingl C, Zhao R, Luider T, Pasa-Tolic L. An integrated top-down and bottom-up proteomic approach to characterize the antigen-binding fragment of antibodies. Proteomics. 2014;14:1239–48. doi:https://doi.org/10.1002/pmic.201300366.
- Dillon TM, Bondarenko PV, Rehder DS, Pipes GD, Kleemann GR, Ricci MS. Optimization of a reversed-phase high-performance liquid chromatography/mass spectrometry method for characterizing recombinant antibody heterogeneity and stability. J Chromatogr A. 2006;1120:112–20. doi:https://doi.org/10.1016/j.chroma.2006.01.016.
- Konermann L, Rodriguez AD, Liu J. On the formation of highly charged gaseous ions from unfolded proteins by electrospray ionization. Anal Chem. 2012;84:6798–804. doi:https://doi.org/10.1021/ac301298g.
- Goswami D, Zhang J, Bondarenko PV, Zhang Z. MS-based conformation analysis of recombinant proteins in design, optimization and development of biopharmaceuticals. Methods. 2018;144:134–51. doi:https://doi.org/10.1016/j.ymeth.2018.04.011.
- Karnoup AS, Kuppannan K, Young SA. A novel HPLC-UV-MS method for quantitative analysis of protein glycosylation. J Chromatogr B Analyt Technol Biomed Life Sci. 2007;859:178–91. doi:https://doi.org/10.1016/j.jchromb.2007.09.030.
- Wagner-Rousset E, Janin-Bussat MC, Colas O, Excoffier M, Ayoub D, Haeuw JF, Rilatt I, Perez M, Corvaia N, Beck A. Antibody-drug conjugate model fast characterization by LC-MS following IdeS proteolytic digestion. MAbs. 2014;6:173–84. doi:https://doi.org/10.4161/mabs.26773.
- Vanhoenacker G, Vandenheede I, David F, Sandra P, Sandra K. Comprehensive two-dimensional liquid chromatography of therapeutic monoclonal antibody digests. Anal Bioanal Chem. 2015;407:355–66. doi:https://doi.org/10.1007/s00216-014-8299-1.
- Wiggins B, Liu-Shin L, Yamaguchi H, Ratnaswamy G. Characterization of cysteine-linked conjugation profiles of immunoglobulin G1 and immunoglobulin G2 antibody-drug conjugates. J Pharm Sci. 2015;104:1362–72. doi:https://doi.org/10.1002/jps.24338.
- Harris RJ, Kabakoff B, Macchi FD, Shen FJ, Kwong M, Andya JD, Shire SJ, Bjork N, Totpal K, Chen AB. Identification of multiple sources of charge heterogeneity in a recombinant antibody. J Chromatogr B Biomed Sci Appl. 2001;752:233–45. doi:https://doi.org/10.1016/S0378-4347(00)00548-X.
- Sun Y, Smith DL. Identification of disulfide-containing peptides by performic acid oxidation and mass spectrometry. Anal Biochem. 1988;172:130–38. doi:https://doi.org/10.1016/0003-2697(88)90421-6.
- Bondarenko PV, Chelius D, Shaler TA. Identification and relative quantitation of protein mixtures by enzymatic digestion followed by capillary reversed-phase liquid chromatography-tandem mass spectrometry. Anal Chem. 2002;74:4741–49. doi:https://doi.org/10.1021/ac0256991.
- Phung W, Han G, Polderdijk SGI, Dillon M, Shatz W, Liu P, Wei B, Suresh P, Fischer D, Spiess C, et al. Characterization of bispecific and mispaired IgGs by native charge-variant mass spectrometry. Int J Mass Spectrom. 2019;446:116229. doi:https://doi.org/10.1016/j.ijms.2019.116229.
- Requena JR, Dimitrova MN, Legname G, Teijeira S, Prusiner SB, Levine RL. Oxidation of methionine residues in the prion protein by hydrogen peroxide. Arch Biochem Biophys. 2004;432:188–95. doi:https://doi.org/10.1016/j.abb.2004.09.012.
- Finnegan M, Linley E, Denyer SP, McDonnell G, Simons C, Maillard J-Y. Mode of action of hydrogen peroxide and other oxidizing agents: differences between liquid and gas forms. J Antimicrob Chemother. 2010;65:2108–15. doi:https://doi.org/10.1093/jac/dkq308.
- Yang R, Jain T, Lynaugh H, Nobrega RP, Lu X, Boland T, Burnina I, T S, Caffry I, Brown M, et al. Rapid assessment of oxidation via middle-down LCMS correlates with methionine side-chain solvent-accessible surface area for 121 clinical stage monoclonal antibodies. MAbs. 2017;9:646–53. doi:https://doi.org/10.1080/19420862.2017.1290753.
- Sokolowska I, Mo J, Dong J, Lewis MJ, Hu P. Subunit mass analysis for monitoring antibody oxidation. MAbs. 2017;9:498–505. doi:https://doi.org/10.1080/19420862.2017.1279773.
- Mo J, Yan Q, So CK, Soden T, Lewis MJ, Hu P. Understanding the impact of methionine oxidation on the biological functions of IgG1 antibodies using hydrogen/deuterium exchange mass spectrometry. Anal Chem. 2016;88:9495–502. doi:https://doi.org/10.1021/acs.analchem.6b01958.
- McAuley A, Jacob J, Kolvenbach CG, Westland K, Lee HJ, Brych SR, Rehder D, Kleemann GR, Brems DN, Matsumura M. Contributions of a disulfide bond to the structure, stability, and dimerization of human IgG1 antibody CH3 domain. Protein Sci. 2008;17:95–106. doi:https://doi.org/10.1110/ps.073134408.
- Masuda K, Yamaguchi Y, Kato K, Takahashi N, Shimada I, Arata Y. Pairing of oligosaccharides in the Fc region of immunoglobulin G. FEBS Lett. 2000;473:349–57. doi:https://doi.org/10.1016/S0014-5793(00)01557-X.
- Goetze AM, Liu YD, Zhang Z, Shah B, Lee E, Bondarenko PV, Flynn GC. High-mannose glycans on the Fc region of therapeutic IgG antibodies increase serum clearance in humans. Glycobiology. 2011;21:949–59. doi:https://doi.org/10.1093/glycob/cwr027.
- Rehder DS, Chelius D, McAuley A, Dillon TM, Xiao G, Crouse-Zeineddini J, Vardanyan L, Perico N, Mukku V, Brems DN, et al. Isomerization of a single aspartyl residue of anti-epidermal growth factor receptor immunoglobulin gamma2 antibody highlights the role avidity plays in antibody activity. Biochemistry. 2008;47:2518–30. doi:https://doi.org/10.1021/bi7018223.
- Nicolardi S, Deelder AM, Palmblad M, van der Burgt YE. Structural analysis of an intact monoclonal antibody by online electrochemical reduction of disulfide bonds and fourier transform ion cyclotron resonance mass spectrometry. Anal Chem. 2014;86:5376–82. doi:https://doi.org/10.1021/ac500383c.
- Trabjerg E, Jakobsen RU, Mysling S, Christensen S, Jorgensen TJ, Rand KD. Conformational analysis of large and highly disulfide-stabilized proteins by integrating online electrochemical reduction into an optimized H/D exchange mass spectrometry workflow. Anal Chem. 2015;87:8880–88. doi:https://doi.org/10.1021/acs.analchem.5b01996.
- Folzer E, Diepold K, Bomans K, Finkler C, Schmidt R, Bulau P, Huwyler J, Mahler H-C, Koulov AV. Selective oxidation of methionine and tryptophan residues in a therapeutic IgG1 molecule. J Pharm Sci. 2015;104:2824–31. doi:https://doi.org/10.1002/jps.24509.
- Zhang Z. Large-scale identification and quantification of covalent modifications in therapeutic proteins. Anal Chem. 2009;81:8354–64. doi:https://doi.org/10.1021/ac901193n.
- Zhang Z. Prediction of collision-induced-dissociation spectra of peptides with post-translational or process-induced modifications. Anal Chem. 2011;83:8642–51. doi:https://doi.org/10.1021/ac2020917.
- Ren D, Pipes GD, Liu D, Shih LY, Nichols AC, Treuheit MJ, Brems DN, Bondarenko PV. An improved trypsin digestion method minimizes digestion-induced modifications on proteins. Anal Biochem. 2009;392:12–21. doi:https://doi.org/10.1016/j.ab.2009.05.018.