
ABSTRACT
Glycosylation is a common post-translational modification and critical quality attribute that can modulate the efficacy of therapeutic proteins. In the production of monoclonal antibodies (mAbs), quantifying the glycoform profile is a vital characterization step. Traditional glycan analysis is time consuming and involves steps at extreme temperature or pH, which may alter glycans. Here, we describe a rapid method for glycan analysis in which glycans are released from mAb samples that are bound to protein A columns. Since host cell proteins, which may also contain glycans, were already removed, this step enables analysis of cell culture products. Glycans released from the mAb samples are then derivatized with InstantPC™ labeling agent and analyzed by HILIC-FLD-MS. To illustrate the method, the glycan profiles of six trastuzumab (Herceptin®) antibody lots and four biosimilar developmental lots were analyzed. The results derived from our novel method, which takes less than 90 min, are compared with those from a typical glycan preparation approach.
Introduction
Therapeutic biologics include a range of recombinant proteins such as hormones, growth factors, enzymes, blood products, monoclonal antibody (mAb)-based therapeutics, fusion proteins, and vaccines. Among these, mAb-based therapeutics comprise more than 50% of the overall biotherapeutic market, and global mAb product sales hit 100 USD billion in 2017.Citation1 Herceptin® (trastuzumab) was in the top five best-selling mAbs, with total sales of 7.4 USD billion in 2017.Citation2 As healthcare spending increased to more than 17.9% of the total US gross domestic product in 2017, lowering the cost of medicine is a rapidly growing concern.Citation3 Development of less costly biosimilar mAb therapeutics is a focus for both innovator and generic biopharmaceutical companies.Citation4,Citation5 It is estimated biosimilars will comprise 410% of the global biologics market by 2020, with the US being the biggest markets for biosimilars.Citation6,Citation7 To earn US Food and Drug Administration approval, biosimilars must achieve quality, efficacy and safety that conforms as closely as possible to the innovator drug.Citation8
N-Glycosylation is a common post-translational modification that can affect the function of therapeutic glycoproteins. Though glycans contribute only about 3% of the total protein molecular mass of most mAbs, they have substantial functional relevance on cellular effector functions,Citation9,Citation10 complement activation,Citation11 clearance,Citation12 stability,Citation13 immunogenicity,Citation14 folding,Citation15 and pharmacokinetics.Citation16 In neoadjuvant settings, antibody-dependent cell-mediated cytotoxicity (ADCC) is major mechanism of action for trastuzumab,Citation17 and glycosylation has been shown to affect ADCC. Specifically, mAbs that lack of core fucose from N-glycans demonstrate stronger ADCC at lower concentration with much higher efficacy compared to fucosylated counterparts.Citation18 Glycosylation of manufactured proteins varies with multiple factors, including clonal population and selection, media selection, production system, and glycoengineering strategies.Citation19,Citation20 Glycosylation is thus an important attribute of biopharmaceutical products to monitor from development through production and scale-up. Additionally, regulatory authorities require that the glycan profile be tightly maintained.Citation21 Comparison of the glycan profiles of a generic biotherapeutic with reference to an innovator molecule is one of the necessary ways to demonstrate biosimilarity.Citation22
Recent advances in analytical techniques, particularly liquid chromatography (LC), capillary electrophoresis and mass spectrometry (MS), facilitate the detailed characterization of glycans on biotherapeutic proteins.Citation23–Citation25 However, given their inherent complexity, lack of chromophore, the existence of isoforms (through both position and linkages), and low MS ionization efficiency, glycan analysis remains challenging.Citation26,Citation27 To enable sensitive analytical measurements, the released glycans are usually derivatized by a fluorophore. Various derivatization methods have been reported,Citation28 but 2-aminobenzamide (2-AB) or 2-aminoanthranilic acid (2-AA) have routinely been used in the biopharmaceutical industry to derivatize the glycans via a time-consuming reductive amination reaction followed by fluorescence detection (FLD).Citation29,Citation30 The advantage of this approach is that the relative quantification of different glycoforms is based on fluorescence intensity,Citation31 and the stoichiometric ratio of label molecule and the glycan molecule is one-to-one. However, one of the major disadvantages of 2-AB or 2-AA is poor ionization efficiency, which hampers MS analysis and further identification of glycoforms based on mass-to-charge ratio.Citation32 This has resulted in the introduction of MS-sensitive glycan labeling derivatives that can be used to identify glycoforms using LC-MS without sacrificing the sensitivity of fluorescence detection. Fulfilling these requirements, many derivatives have been reported, including procainamide (4-amino-N-[2-(diethylamino)ethyl] benzamide, ProcA), procaine (4-aminobenzoic acid 2-diethylaminoethyl ester) and Waters’ RapiFluor-MS® labeling agent (RF-MS).Citation26,Citation33,Citation34 A comparison of 2-AB- versus ProcA-labeled glycans from IgG shows comparable hydrophilic interaction chromatography (HILIC) – high performance liquid chromatography (HPLC) separation, and ProcA derivatization results in both higher fluorescence intensity and significantly improved electrospray ionization (ESI) efficiency (up to 30 times that of 2-AB).Citation35 Keserand and coworkers compared 2-AB, ProcA, and RF-MS as derivatizing agents for HILIC-UPLC-FLD-MS of N-glycans and found that ProcA resulted in the highest FLD sensitivity and RF-MS had the highest MS sensitivity.Citation36 Further, in a ProZyme technical note, a comparison of FLD and MS response of glycans labeled with a derivatized version of procaine (IPC), RF-MS, ProcA and 2-AB, it is reported that IPC labeling is superior in FLD and MS response.Citation37
Traditionally in process development, glycan analysis involves two different types of samples: upstream and downstream. Glycan analysis of upstream samples requires the removal of host cell proteins and other protein components of cell culture media. Glycan analysis of downstream samples that have already undergone purification traditionally uses a single 10 or 30 kDa molecular weight cutoff (MWCO) filter to separate released glycans from the protein.Citation38 The method developed here involves glycoproteins (Fc containing) binding to protein A (PA), which helps remove host cell proteins and other proteins present in the cell culture media and may allow for the exact same methodology to be applied to all upstream and downstream samples throughout process development.
In this study, we investigated a novel method, PA-IPC, where glycans are released from mAbs while they are bound to PA cartridges, and compare it to traditional methods utilizing MWCO filters (MWCO-IPC). MWCO filters were found to selectively bind certain glycans, and a detergent wash step (sodium deoxycholate, SDC) was added to the method (MWCO-SDC-IPC), which has been shown to be an improvement in filter-aided sample preparation in protein and glycoprotein digestion.Citation39,Citation40 In addition, we used the PA-IPC method, which reliably identifies, quantifies and recovers more glycans, to compare the glycan profiles of innovator Herceptin® antibody products (6 lots, HER1 to HER6; 4 European and 2 US) with internal developmental biosimilar drug substance (scale-up bioreactor runs).
Results
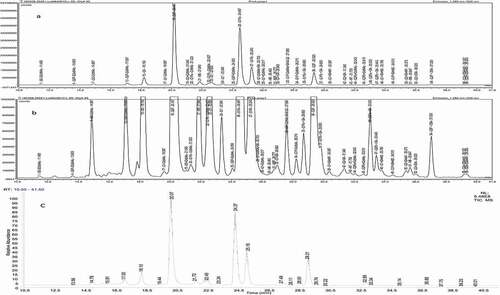
Typically, released glycans are labeled with either 2-AA or 2-AB before liquid chromatography separation and FLD, but identifying low abundance glycoforms present on mAbs is difficult due to the poor MS sensitivity of typical labeling agents. The glycan derivatizing agent used in this study, IPC, has a 15-fold or more fluorescence sensitivity and 60-fold or more MS sensitivity compared to 2-AB, allowing the identification of more low abundance glycoforms present on trastuzumab. Using the PA-IPC method (see the 'Materials and Methods' section), 40 glycoforms (, ) from trastuzumab (Herceptin® antibody lot HER5) were identified using MS, almost twice compared to the total previously identified.Citation8,Citation25 The HILIC separation of released and labeled glycans yields excellent reproducible chromatograms and relative quantification ( and , relative standard deviation (RSD)% for retention time of ≤0.2 min and for relative area of ≤10% for most of the glycoforms). The LC method is unable to separate the glycoforms G1 F-GlcNAc+SA and G2, so they were combined for quantification (, ). G1 and G1ʹ, singly terminal galactosylated glycoforms, are isomers () and differentiated, as they were identified by MS in two different retention times as indicated elsewhere.Citation41 A few peaks at the beginning of LC separation () were not identified by MS, and could be attributed to reagent peaks, modified glycans, or peptides. These unknowns () contributed to only about 0.53% of the total peak area.
Table 1. Trastuzumab (6 preparation of a Herceptin® antibody lot, HER5) glycoforms identified by PA-IPC method
Table 2. Comparison of the quantification of trastuzumab (HER 5) glycoforms using PA-IPC, MWCO-IPC and MWCO-SDC-IPC methods
Figure 1. (a) LC-FLD Chromatogram Profile of Labeled Glycans Released from Trastuzumab Using the Method PA-IPC, (b) Zoomed Profile Showing Low Abundance Glycoforms, (c) TIC Profile from MS
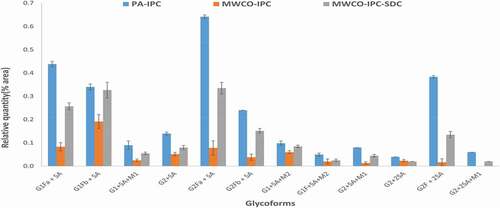
Comparison of PA-IPC to traditional filter-assisted glycan separation (MWCO-IPC, an approach limited to purified protein) of HER5 shows most of the glycans identified by PA-IPC are also identified by MWCO-IPC (). However, the relative abundance of some glycoforms differs across the two methods. In fact, sialylated (SA) glycoforms have a higher recovery from the PA-IPC method compared to the MWCO-IPC method. Notably, G2 + 2SA+M1 is not detected at all by the MWCO-IPC method (, ). To address these low recoveries or missing glycoforms, we introduced the use of SDC, an ionic detergent that could replace negatively charged sialylated glycoforms from the filter membrane, in a third method (MWCO-SDC-IPC). With SDC as a wash, recovery of sialylated glycoforms was improved, but still lower relative to the PA-IPC method (, ). Also, RSD% (relative area) obtained from multiple sample preparation (n = 6) shows that the PA-IPC method yields better precision in relative quantification of glycoforms than the other two approaches (MWCO-IPC and MWCO-SDC-IPC, ).
Figure 2. Relative Quantification of Sialylated Glycoforms Identified from Trastuzumab by PA-IPC, MWCO-IPC and MWCO-IPC-SDC
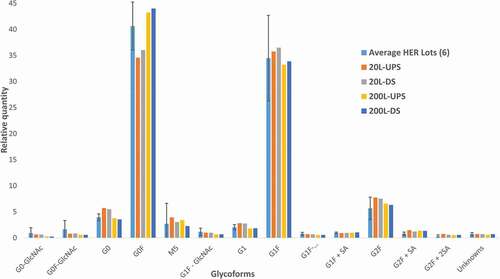
We applied the PA-IPC method to compare the glycan profiles of innovator Herceptin® antibody product (6 lots; 4 European and 2 US) with developmental biosimilar cell culture upstream (UPS) and downstream drug substance (DS) samples from 20- and 200-L batches. The glycan profile among the six innovator lots (HER1 -HER6) is consistent for most glycoforms. However, one of the EU lots (HER 4), has noticeable differences in the relative quantities of the glycoforms G0-GlcNAc, G0, M5, G1 Fa, G1+ SA, M7 and G2+ SA+M1 (). For the biosimilar lots, the glycan profiles remain consistent at each scale (20 or 200 L) between upstream and downstream samples (), indicating that there is no loss or change of any glycoforms during the purification process. However, there is a noticeable difference in glycoforms between the scale-up (20–200 L) developmental biosimilar batches. Specifically, scale-up resulted in a maximum of 2.5 times decrease in some of the agalactosylated glycoforms, such as G0-GlcNAc, G0 F-GlcNAc, and G0, while there were noticeable increases in others, G0 F and G0 F+ GlcNAc (). Comparison of the biosimilar lots with the 6 Herceptin® antibody lots shows that the quantification of all glycoforms in DS batches, other than G0 in the 20 L batches, falls within 2 standard deviations of the Herceptin® antibody lot average (, ). The data included in were collected as part of an extensive glycan improvement study directed toward optimizing biosimilar developmental batches of trastuzumab. Publication of detailed upstream and downstream process information and potential causes for glycoform quantity changes related to the scale-up production system and glycoengineering strategies is planned.
Table 3. Comparison of relative quantification (relative area) of glycoforms from Herceptin® antibody (4 EU and 2 US) and trastuzumab developmental scale-up lots (20 and 200 L) using PA-IPC
Figure 3. Relative Quantification of the Most Abundant Glycoforms from Herceptin® Antibody (Average of Six Lots with 2 Standard Deviations) and Trastuzumab Developmental Scale-up Batches
Discussion
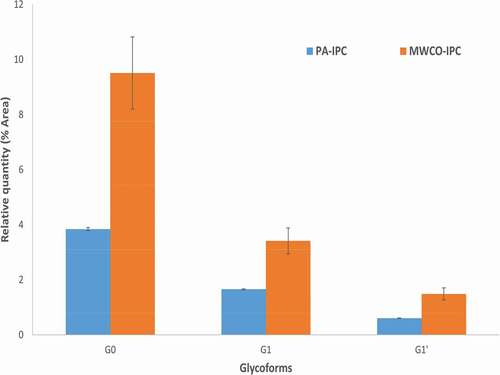
The novel PA-IPC method for glycan purification improves upon more traditional MWCO-based methodology, which generally involves extended elevated temperatures and pH. Fewer fucosylated forms of non-galactosylated (G0) and galactosylated (G1) glycoforms were observed in the MWCO-IPC method ( and ), possibly due to partial degradation (peeling off) of fucose during the sample drying step.Citation42 To further investigate this, we performed a duplicate MWCO-IPC sample preparation using a freeze-dry concentration step to mitigate the time and temperature at high pH, and found that G0 and G1 decreased under these conditions to align with the PA-IPC method quantification (supplementary figure, Figure 5) which clearly shows that the relatively higher number of afucosylated glycoforms observed from filter-assisted glycan separation approaches (MWCO-IPC and MWCO-SDC-IPC) is due to sample preparation conditions used for those approaches.
Figure 4. Relative Quantification of Afucosylated form of Non-galactosylated (G0) and Galactosylated Glycoforms (G1) Obtained on Trastuzumab by PA-IPC and MWCO-IPC
Although the addition of an SDC wash step with the traditional MWCO-methodology improves the recovery of sialylated glycoforms that would otherwise remain bound to the MWCO membrane, the PA-IPC method gives the highest recovery of sialylated glycoforms by avoiding interactions with a membrane. By decreasing total sample prep time (~1.5 h PA-IPC versus ~4 h MWCO-IPC) and utilizing mild reaction conditions, the PA-IPC method provides a sample preparation step that can be used without additional purification of all UPS and DS samples throughout a biosimilar development campaign, while the other MWCO approaches cannot be applied for UPS samples. Once glycoforms have been successfully identified on a reproducible HILIC-FLD-MS chromatogram, samples can be routinely run on HILIC-FLD alone to decrease sample run and analysis time even further.
The PA-IPC method used in this report identified twice as many glycoforms from trastuzumab as previously published, including several hybrids, mannosylated fucose, and bisected glycoforms. In a practical application of the methodology, we compared six commercial Herceptin® antibody lots, discovering one outlier, and four biosimilar development lots. This technique will allow rapid and accurate analysis of glycoforms on any Fc-containing therapeutics, including mAbs and fusion proteins. Hence, this rapid method allows the exact same methodology to be applied to all upstream and downstream samples throughout process development. This approach is very helpful in the developmental of biosimilar products, which requires comparison of the glycan profiles of a generic biotherapeutic with a reference molecule as one of the necessary ways to demonstrate biosimilarity. In addition, this method is very handy in process characterization, where process parameters are monitored with glycan profile being a critical quality attribute.
Materials and methods
Materials
AssayMap® PA50 antibody purification module (protein A cartridges and purification wash buffer), PNGase F digestion set (N-glycanase and 25X digestion buffer) and InstantPC labeling module (IPC, modified procaine and dye solvent) were purchased from ProZyme (Hayward, CA). Sodium deoxycholate (SDC), formic acid (puriss), ammonia solution (~26%) and acetonitrile (HPLC grade) were purchased from Sigma (St. Louis, MO). Acetone (99.8%) was purchased from Acros Organics (Fisher Scientific). The analytical column (Waters AQUITY UPLC® BEH Amide, 1.7 µm, 2.1 × 150 mm) was purchased from Waters (Milford, MA). And, 0.2-mL PCR tubes and centrifuge capable of holding 96-well plates were purchased from Eppendorf (Germany). Amicon® ultra centrifugal 30 kDa membrane filter, UFC503096 (30-kDa MWCO filter) was purchased from Millipore (Burlington, MA). Six Herceptin® antibody lots were used as innovator lots, 4 EU (Europe) and 2 US (United States); the samples were donated by a collaborator.
Sample preparation, glycan release, and glycan labeling
PA-IPC
One hundred micrograms of trastuzumab (HER 5) was first captured onto a PA cartridge by centrifuging at 50 g for 10 min and then washed off the matrix using washing buffer. Then, on the cartridge, N-linked glycans were released from the glycoprotein using 10 µL PNGase F solution (2 µL of PNGase F and 8 uL of digestion buffer) at 45°C for 45 min. About 30 µL of digestion buffer was added to the cartridge and the released glycans were collected into a 0.2-mL Eppendorf vial by centrifuging at 300 g for 3 min. Next, the glycans were conjugated with IPC (5 µL) at room temperature for 5–10 min. The conjugated glycans were purified from the excess dye using acetone precipitation; 950 µL of acetone was added to the sample (~50 µL), vortexed well, and centrifuged at 18,000 g for 5 min. The supernatant was then discarded without disturbing the pellet and this process was repeated twice. The sample pellet was dried using vacufuge. The sample was reconstituted in 25 µL of water by vortexing and 75 µL acetonitrile was added. LC-FLD or LC-MS were then run.
MWCO-IPC
One hundred micrograms of trastuzumab, HER 5 (~4 µL of protein) was added to 4 µL of 2× digestion buffer and 2 µL of PNGase F in a 0.2-mL Eppendorf vial and incubated at 45°C for 45 min. The sample was then transferred to a 30-kDa MWCO filter (Amicon ultra centrifugal filter) with collection tube; 200 µL of water was used to wash the reaction vial and transferred to the 30-kDa MWCO filter before it was centrifuged at 14,000 g for 10 min. The water wash was repeated. The glycan containing solution was transferred to a 1.5-mL Eppendorf tube and concentrated using a Vacufuge to about 40 µL. The glycans were then conjugated with IPC (5 µL) at room temperature for 5–10 min. The excess reagent was removed via acetone precipitation and the sample was reconstituted as described above (PA-IPC).
MWCO-SDC-IPC
The protocol for MWCO-IPC was followed as described above, except that instead of water, 200 µL of 0.5% SDC was added when centrifuging the glycans away from protein and repeated once to wash the membrane. The glycan concentration, conjugation, excess reagent removal by acetone precipitation, and sample reconstitution were performed as described above (MWCO-IPC).
Instrumentation
Thermo Scientific™ Ultimate™ 3000 UPLC systems were used with AQUITY UPLC BEH Amide column and fluorescence detector (excitation at 285 nm and emission at 345 nm). The labeled glycans were identified using LC-MS (Thermo Scientific™ Q Exactive™ Plus Orbitrap).
Liquid chromatography
A 63-min LC method was used for the separation of labeled glycans at a flow rate of 0.5 mL/min. Mobile phase A was 100 mM ammonium formate, pH 4.4; mobile phase B was 100% acetonitrile. The separation of labeled glycans was achieved using a shallow LC elution gradient of 23–39% solvent A over 48 min (0–2 min stay at 23% A, 48 min of shallow gradient from 23% to 39% of A, 1 min of rapid gradient to reach 90% of A, remaining 90% A for 5 min, 1 min rapid gradient to reach original 23% of A and then remain 23% of A for 6 min giving total LC run time of 63 min). During the separation, the column compartment temperature was maintained at 60°C, and a fluorescence detector was used. Relative quantification of each glycoforms (including unknown) is calculated by dividing each area of glycoform peaks by total area of peaks fall approximately between 11 and 40 min.
Mass spectrometry
The Thermo Scientific Q Exactive Plus Orbitrap mass spectrometer was operated in positive ion mode with ESI voltage set to 3.5 kV and capillary temperature set to 325°C. Full MS was operated at 70,000 resolution and the scan range was set to 500–2500 m/z. An AGC target for MS was 3e6 and maximum injection time (IT) was 100 ms. The sheath gas flow rate was set to 25 mL/min while auxiliary gas flow rate was set to 10 mL/min (temperature, 250°C). MS identification of glycoforms was performed manually by mass-to-charge ratio and assigned to the HPLC-HILIC-FLD profile based on retention time.
Disclosure of potential conflicts of interest
The studies reported in this publication were supported by Catalent Biologics, Bloomington, IN. The terms of this publication have been reviewed and approved by Catalent in accordance with its policy on objectivity in research.
Supplemental Material
Download MS Word (134.4 KB)Supplementary material
Supplemental data for this article can be accessed on the publisher’s website.
References
- Kalorama Information Report. Global Monoclonal Antibodies market Hit $100 Billion in 2017: report; 2018 [accessed 2018 Feb 21]. https://www.prnewswire.com/news-releases/global-monoclonal-antibodies-market-hit-100-billion-in-2017-report-300599684.html.
- Maggon K. Best selling blockbuster monoclonal antibodies; 2017 [accessed 2018 April 26]. https://www.scoop.it/topic/victrelis-boceprevir-merck-fda-review-approval.
- Martin AB, Hartman M, Washington B, Catlin A. National health care spending in 2017: growth slows to post-great recession rates; share of GDP stabilizes. Health Aff (Millwood). 2019;38(1):101377hlthaff201805085. doi:https://doi.org/10.1377/hlthaff.2018.05085.
- Xie H, Chakraborty A, Ahn J, Yu YQ, Dakshinamoorthy DP, Gilar M, Chen W, Skilton S, Mazzeo JR. Rapid comparison of a candidate biosimilar to an innovator monoclonal antibody with advanced liquid chromatography and mass spectrometry technologies. MAbs. 2010;2:379–10. doi:https://doi.org/10.4161/mabs.11986.
- Ecker DM, Jones SD, Levine HL. The therapeutic monoclonal antibody market. mAbs. 2015;7:9–14. doi:https://doi.org/10.4161/19420862.2015.989042.
- Hajba L, Szekrényes A, Borza B, Guttman A. On the glycosylation aspects of biosimilarity. Drug Discov Today. 2018;23:616–25. doi:https://doi.org/10.1016/j.drudis.2018.01.009.
- Singh SC, Bagnato KM. The economic implications of biosimilars. Am J Manag Care. 2015;21:331–40.
- Sanchez-De Melo I, Grassi P, Ochoa F, Bolivar J, García-Cózar FJ, Durán-Ruiz C. N-glycosylation profile analysis of trastuzumab biosimilar candidates by normal phase liquid chromatography and MALDI-TOF MS approaches. J Proteom. 2015;127:225–33. doi:https://doi.org/10.1016/j.jprot.2015.04.012.
- Shields RL, Lai J, Keck R, O’Connell LY, Hong K, Meng YG, Weikert SHA, Presta LG. Lack of fucose on human IgG1 N-linked oligosaccharide improves binding to human Fcƴ RIII and antibody-dependent cellular toxicity. J Biol Chem. 2002;277:26733–40. doi:https://doi.org/10.1074/jbc.M202069200.
- Natsume A, Niwa R, Satoh M. Improving effector functions of antibodies for cancer treatment: enhancing ADCC and CDC. Drug Des Dev Ther. 2009;3:7–16.
- Jefferis R, Lund J, Pound JD. IgG-Fc-mediated effector functions: molecular definition of interaction sites for effector ligands and the role of glycosylation. Immunol Rev. 1998;163:59–76. doi:https://doi.org/10.1111/j.1600-065X.1998.tb01188.x.
- Wright A, Morrison SL. Effect of C2-associated carbohydrate structure on Ig effector function: studies with chimeric mouse-human IgG1 antibodies in glycosylation mutants of chinese hamster ovary cells. J Immunol. 1998;160:3393–02.
- Higel F, Seidl S, Sörgel F, Friess W. N-glycosylation heterogeneity and the influence on structure, function and pharmacokinetics of monoclonal antibodies and Fc fusion proteins. Eur J Pharm Biopharm. 2016;100:94–100. doi:https://doi.org/10.1016/j.ejpb.2016.01.005.
- Kaneko Y, Nimmerjahn F, Ravetch JV. Anti-inflammatory activity of immunoglobulin G resulting from Fc sialylation. Science. 2006;313:670–73. doi:https://doi.org/10.1126/science.1129594.
- Ohtsubo K, Marth JD. Glycosylation in cellular mechanisms of health and Disease. Cell. 2006;126:855–67. doi:https://doi.org/10.1016/j.cell.2006.08.019.
- Jones AJ, Papac DI, Chin EH, Keck R, Baughman SA, Lin YS, Kneer J, Battersby JE. Selective clearance of glycoforms of a complex glycoprotein pharmaceutical caused by terminal N-acetylglucosamine is similar in humans and cynomolgus monkeys. Glycobiology. 2007;17:529–40. doi:https://doi.org/10.1093/glycob/cwm017.
- Petricevic B, Laengle J, Singer J, Sachet M, Fazekas J, Steger G, Bartch R, Jensen-Jarolim E, Bergmann M. Trastuzumab mediates antibody-dependent cell-mediated cytotoxicity and phagocytosis to the same extent in both adjuvant and metastatic HER2/neu breast cancer patients. J Transl Med. 2013;11:307–17. doi:https://doi.org/10.1186/1479-5876-11-307.
- Yamane-Ohnuki N, Satoh M. Production of therapeutic antibodies with controlled fucosylation. mAbs. 2009;1:230–36. doi:https://doi.org/10.4161/mabs.1.3.8328.
- Lalonde M, Durocher Y. Therapeutic glycoprotein production in mammalian cells. J Biotechnol. 2017;251:128–40. doi:https://doi.org/10.1016/j.jbiotec.2017.04.028.
- Beck A, Wagner-Rousset E, Bussat MC, Lokteff M, Klinguer-Hamour C, Haeuw JF, Wurch T, Dorsselaer AV, Covaia N. Trends in glycosylation, glycoanalysis and glycoengineering of therapeutic antibodies and Fc-fusion proteins. Curr Pharm Biotechnol. 2008;9:482–01. doi:https://doi.org/10.2174/138920108786786411.
- Walsh G, Jefferis R. Post-translational modifications in the context of therapeutic proteins. Nat Biotechnol. 2006;24:1241–52. doi:https://doi.org/10.1038/nbt1252.
- Beck A, Sanglier-Cianferani S, Van Dorsselaer A. Biosimilar, biobetter, and next generation antibody characterization by mass spectrometry. Anal Chem. 2012;84:4637–46. doi:https://doi.org/10.1021/ac3002885.
- Fang J, Doneanu CE, Alley WR, Yu YQ, Beck A, Chen W. Advanced assessment of the physicochemical characteristics of Remicade and Inflectra by sensitive LC/MS techniques. MAbs. 2016;8:1021–34. doi:https://doi.org/10.1080/19420862.2016.1193661.
- Nakano M, Higo D, Arai E, Nakagawa T, Kakehi K, Taniguchi N, Kondo A. Capillary electrophoresis-electrospray ionization mass spectrometry for rapid and sensitive N-glycan analysis of glycoproteins as 9-fluorenylmethyl derivatives. Glycobiology. 2009;19:135–43. doi:https://doi.org/10.1093/glycob/cwn115.
- Jayo RG, Thaysen-Andersen M, Lindenburg PW, Haselberg R, Hankemeier T, Ramautar R, Chen DDY. Simple capillary electrophoresis−mass spectrometry method for complex glycan analysis using a flow-through microvial interface. Anal Chem. 2014;86:6479–86. doi:https://doi.org/10.1021/ac5010212.
- Domann PJ, Pardos-Pardos techniques. MAbs. 2016;8:1021–34. doi:https://doi.org/10.1080/19420862.2016.1193661.
- Nakano M, Higo D, Arai E, Nakagawa T, Kakehi K, Taniguchi N, Kondo A. Capillary electrophoresis-electrospray ionization mass spectrometry for rapid and sensitive N-glycan analysis of glycoproteins as 9-fluorenylmethyl derivatives. Glycobiology. 2009;19:135–43. doi:https://doi.org/10.1093/glycob/cwn115.
- Jayo RG, Thaysen-Andersen M, Lindenburg PW, Haselberg R, Hankemeier T, Ramautar R, Chen DDY. Simple capillary electrophoresis−mass spectrometry method for complex glycan analysis using a flow-through microvial interface. Anal Chem. 2014;86:6479–86. doi:https://doi.org/10.1021/ac5010212.
- Domann PJ, Pardos-Pardos AC, Fernandes DL, Spencer DI, Radcliffe CM, Royle L, Dwek RA, Rudd PM. Separation-based glycoprofiling approaches using fluorescent labels. Proteomics. 2007;7:70–76. doi:https://doi.org/10.1002/pmic.200700640.
- Zhang P, Woen S, Wang T, Liau B, Zhao S, Chen C, Yang Y, Song Z, Wormald MR, Yu C, et al. Challenges of glycosylation analysis and control: an integrated approach to producing optimal and consistent therapeutic drugs. Drug Discov Today. 2016;21:740–65. doi:https://doi.org/10.1016/j.drudis.2016.01.006.
- Pabst M, Kolarich D, Pöltl G, Dalik T, Lubec G, Hofinger A, Altmann F. Comparison of fluorescent labels for oligosaccharides and introduction of a new postlabeling purification method. Anal Biochem. 2009;384:263–73. doi:https://doi.org/10.1016/j.ab.2008.09.041.
- Bigge JC, Patel TP, Bruce JA, Goulding PN, Charles SM, Parekh RB. Nonselective and efficient fluorescent labeling of glycans using 2-amino benzamide and anthranilic acid. Anal Biochem. 1995;230:229–38. doi:https://doi.org/10.1006/abio.1995.1468.
- Higel F, Demelbauer U, Seidl A, Friess W, Sörgel F. Reversed-phase liquid-chromatographic mass spectrometric N-glycan analysis of biopharmaceuticals. Anal Bioanal Chem. 2013;405:2481–93. doi:https://doi.org/10.1007/s00216-012-6690-3.
- Ruhaak LR, Zauner G, Huhn C, Bruggink C, Deelder AM, Wuhrer M. Glycan labeling strategies and their use in identification and quantification. Ana Bioanal Chem. 2010;397:3457–81. doi:https://doi.org/10.1007/s00216-010-3532-z.
- Harvey DJ. Electrospray mass spectrometry and fragmentation of N-linked carbohydrates derivatized at the reducing terminus. J Am Soc Mass Spectrom. 2000;11:900–15. doi:https://doi.org/10.1016/S1044-0305(00)00156-2.
- Takao T, Tambara Y, Nakamura A, Yoshino K, Fukuda H, Fukuda M, Shimonishi Y. Sensitive analysis of oligosaccharides derivatized with 4-aminobenzoic acid 2-(diethylamino)ethyl ester by matrix-assisted laser desorption/ionization mass spectrometry. Rapid Commun Mass Spectrom. 1996;10:637–40. doi:https://doi.org/10.1002/(SICI)1097-0231(199604)10:6<637::AID-RCM544>3.0.CO;2-9.
- Lauber MA, Yu Y-Q, Brousmiche DW, Hua Z, Koza SM, Magnelli P. Rapid preparation of released N-glycans for HILIC analysis using a labeling reagent that facilitates sensitive fluorescence and ESI-MS detection. Anal Chem. 2015;87:5401–09. doi:https://doi.org/10.1021/acs.analchem.5b00758.
- Kozak RP, Tortosa CB, Fernandes DL, Spencer DIR. Comparison of procainamide and 2-aminobenzamide labeling for profiling and identification of glycans by liquid chromatography with fluorescence detection coupled to electrospray ionization–mass spectrometry. Anal Biochem. 2015;486:38–40. doi:https://doi.org/10.1016/j.ab.2015.06.006.
- Keser T, Pavić T, Lauc G, Gornik O. Comparison of 2-aminobenzamide, procainamide and RapiFluor-MS as derivatizing agents for high-throughput HILIC-UPLC-FLR-MS N-glycan analysis. Front Chem. 2018;6(article):324. doi:https://doi.org/10.3389/fchem.2018.00324.
- Kimzey M, Szabo Z, Sharma V, Gyenes A, Tep S, Taylor A, Jones A, Hyche J, Haxo T, Vlasenko S. Development of an instant glycan labeling dye for high throughput analysis by mass spectrometry. Prozyme technical note. [accessed 2015 Oct 5]. https://www.europa-bioproducts.com/pdf/IPC_Glycan-Labeling-Dye-2015_handout_v3_r2.pdf.
- Zhou H, Froehlich JW, Briscoe AC, Lee RS. The GlycoFilter: A simple and comprehensive sample preparation platform for proteomics, N-glycomics and glycosylation sites assignment. Mol Cell Proteomics. 2013;12:2981–91. doi:https://doi.org/10.1074/mcp.M113.027953.
- Peng W, Zhang Y, Zhu R, Mechref Y. Comparative membrane proteomics analyses of breast cancer cell lines to understand the molecular mechanism of breast cancer brain metastasis. Electrophoresis. 2017;38:212434.
- Zhu R, Zhou S, Peng W, Huang Y, Mirzaei P, Donohoo K, Mechref Y. Enhanced quantitative LC-MS/MS analysis of N‑linked glycans derived from glycoproteins using sodium deoxycholate detergent. J Proteome Res. 2018;17:266878.
- Shantha Raju T, Briggs JB, Borge SM, Jones AJS. Species-specific variation in glycosylation of IgG: evidence for the species-specific sialylation and branch-specific galactosylation and importance for engineering recombinant glycoprotein therapeutics. Glycobiology. 2000;10:477–86. doi:https://doi.org/10.1093/glycob/10.5.477.
- Walker SH, Lilley LM, Enamorado MF, Comins DL, Muddiman DC. Hydrophobic derivatization of N-linked glycans for increased Ion abundance in electrospray Ionization mass spectrometry. J Am Soc Mass Spectrom. 2011;22:1309–17. doi:https://doi.org/10.1007/s13361-011-0140-x.