
 ?Mathematical formulae have been encoded as MathML and are displayed in this HTML version using MathJax in order to improve their display. Uncheck the box to turn MathJax off. This feature requires Javascript. Click on a formula to zoom.
ABSTRACT
Biologics have the potential to induce an immune response when used therapeutically. A number of in vitro assays are currently used preclinically to predict the risk of immunogenicity, but the validation of these preclinical tools suffers from the relatively small number of accessible immunogenic molecules and the limited understanding of the mechanisms underlying the immunogenicity of biologics. Here, we present the post-hoc analysis of three monoclonal antibodies with high immunogenicity in the clinic. Two of the three antibodies elicited a CD4 T cell proliferative response in multiple donors in a peripheral blood mononuclear cell assay, but required different experimental conditions to induce these responses. The third antibody did not trigger any T cell response in this assay. These distinct capacities to promote CD4 T cell responses in vitro were mirrored by different capacities to stimulate innate immune cells. Only one of the three antibodies was capable of inducing human dendritic cell (DC) maturation; the second antibody promoted monocyte activation while the third one did not induce any innate cell activation in vitro. All three antibodies exhibited a moderate to high internalization by human DCs and MHC-associated peptide proteomics analysis revealed the presence of potential T cell epitopes that were confirmed by a T-cell proliferation assay. Collectively, these findings highlight the existence of distinct immune stimulatory mechanisms for immunogenic antibodies. These findings have implications for the preclinical immunogenicity risk assessment of biologics.
Introduction
Therapeutic monoclonal antibodies (mAbs) represent an increasing percentage of new drugs approved to treat a variety of chronic inflammatory diseases and cancers. They combine several distinctive advantages over small molecules, such as longer half-life, higher specificity, and generally low toxicity. However, therapeutic mAbs can trigger the formation of anti-drug antibodies (ADA) that can negatively affect drug pharmacokinetics/pharmacodynamics, safety, and efficacy. Efforts to reduce mAb immunogenicity by either reducing non-human amino acids during mAb humanization or by developing fully human mAb have not resolved the issue, probably because of the remaining non-germline residues in the complementarity-determining regions (CDR).Citation1 Therefore, developing preclinical assays to assess the immunogenicity risk has been an intense area of research for pharmaceutical companies.
Because of their essential role in the generation of isotype-switched and affinity-matured antibodies, CD4 T helper cells are the primary drivers of the ADA response to biologics in the clinic and thus the focus of most the preclinical immunogenicity risk assessment.Citation2 While measurement of CD4 T cell proliferation following incubation of peripheral blood mononuclear cells (PBMC) from healthy donors with biotherapeutics is the most common methods used to predict the immunogenicity risk,Citation3–Citation6 several recent studies have measured cellular events that precede CD4 T cell activation, such as the capture and processing of antibodies by dendritic cells (DC),Citation7,Citation8 antibody-mediated activation of DC,Citation7 and presentation of peptide by human leukocyte antigen (HLA) class II molecules by DC using MHC-associated peptide proteomics (MAPPS).Citation7,Citation9 However, an integrated comprehensive characterization of the CD4 and DC responses of diverse immunogenic antibodies is still absent.
In this study, we used a panel of in vitro immune cell-based assays to assess the response of mAbs with known clinical immunogenicity rates. We observed marked differences in the capacity of immunogenic mAbs to elicit CD4 T helper cell proliferation and activate antigen-presenting cells. A novel approach combining the analysis of DC uptake of antibody, MAPPS and confirmatory CD4 T cell proliferation assay using MAPPS-derived peptides is proposed to fully mitigate the immunogenicity risk of biologics that do not trigger a robust T cell response or DC activation.
Results
Immunogenic mAbs differ in their capacity to elicit a CD4 T cell proliferative response in vitro
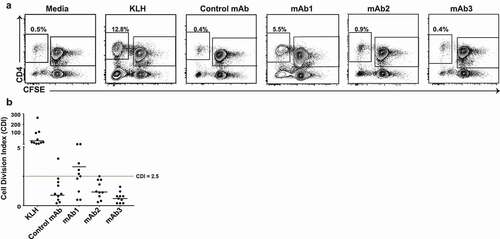
To assess whether a PBMC proliferation assay could be used as a predictive tool of clinical immunogenicity, we initially compared the responses of 10 healthy HLA-typed donors to four different therapeutic mAbs with various levels of clinical immunogenicity (). mAb1 is a humanized IgG4 targeting a membrane protein constitutively expressed in a variety of human cancers and immune cells that elicited ADA in 65% of healthy subjects in a Phase 1 study. mAb2 and mAb3, which are humanized IgG1s that act on the same non-membrane-bound protein target, were predicted to have a low immunogenicity risk based on in silico prediction of CD4 T cell epitope (EpiMatrix analysis, Epivax), but triggered ADA in 90% of subjects in Phase 1 studies. For all three mAbs, the presence of ADA was associated with changes in pharmacokinetics. The fourth antibody, referred to as control mAb, is a humanized IgG4 that recognizes a soluble protein produced by nonimmune cells and elicited low ADA (1%) after administration of a single dose in healthy human subjects. The CD4 T cell proliferative response to the mAbs was analyzed by flow cytometry after 7 days incubation using carboxyfluorescein diacetate succinimidyl ester (CFSE) ().Citation10 Individual responses to an antigen were considered positive when the cell division index (CDI) was ≥ 2.5. Using this criterion, the assay positive control, keyhole limpet hemocyanin (KLH), triggered a positive response in all healthy donors while 6 of 10 donors had a positive response to mAb1. The mean intensity of the proliferative response to mAb1 (median CDI: 3.3) was, however, significantly weaker than the response elicited by KLH (median CDI: 37.8) (). In contrast, 1 of 10 donors mounted a proliferative response to the control mAb and to mAb2 and no donors mounted a response to mAb3 (). Taken together, these findings suggest that the CD4 T cell proliferation assay using human PBMCs has a limited capacity to predict clinical immunogenicity.
Table 1. Therapeutic mAb rates of clinical immunogenicity
Figure 1. Human CD4 T cell proliferative response to three immunogenic monoclonal antibodies in PBMC assay. (a) Representative plots showing flow cytometric analysis of CD4 T cell proliferative response from PBMC 7 days after incubation with media only, KLH, Control mAb, mAb1, mAb2, or mAb3. PBMCs were labeled with CFSE prior to incubation with test articles. Cells in plots were gated from DAPI−CD14−CD19−CD3+. (b) Scatter plot summarizing the CDI data from 10 donors incubated with the indicated test antigens. Horizontal black lines represent the median values and the dotted line indicates CDI ≥ 2.5, which is the threshold value for a positive response
CD8 T cells regulate human CD4 T cell responses to immunogenic mAbs
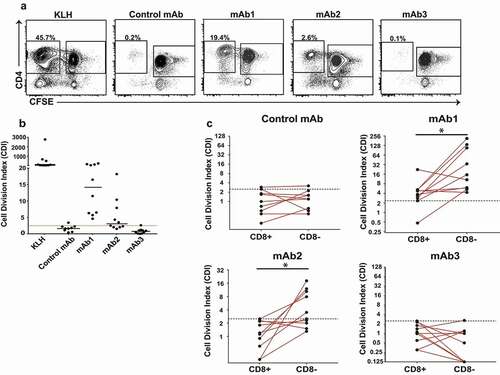
CD8 suppressor T cells have been shown to regulate the proliferative response of human CD4 T cells to autoantigen.Citation11 To investigate the impact of CD8 T cells on CD4 T cell response to immunogenic mAbs, we depleted CD8 T cells from PBMC prior to CFSE labeling and repeated the CD4 T cell proliferative responses to the four mAbs described in in the same 10 healthy donors. In the absence of CD8 T cells, all the donors mounted a positive response to mAb1 and 5 of 10 donors responded to mAb2 (, B). In nearly all donors, CD8 T cell depletion increased the CD4 T cell proliferative response to immunogenic mAbs (4.2 and 2.5-fold increase in median CDI for mAb1 and mAb2, respectively) but minimally altered the response to the control mAb (). Despite this increased sensitivity, no CD4 T cell response to mAb3 was observed even after CD8 T cell depletion. These results suggest that CD8 T cell suppressor cells modulate the CD4 T cell response to immunogenic antibodies.
Figure 2. Impact of CD8 T cells depletion on human CD4 T cell responses to immunogenic monoclonal antibodies. (a) Representative plots showing flow cytometric analysis of CD4 T cell proliferative response from CD8 T cell depleted PBMC 7 days after incubation with KLH, Control mAb, mAb1, mAb2, or mAb3. CD8 T cell depleted PBMCs were labeled with CFSE prior to incubation with test articles. Cells in plots were gated from DAPI−CD14−CD19−CD3+. (b) Scatter plot summarizing the CDI data from 10 healthy donors incubated with the indicated test antigens. Horizontal black lines represent the median values and the red dotted line indicates CDI ≥ 2.5, which is the threshold value for a positive response. (c) Scatter plot summarizing the log (CDI) data from PBMCs of 10 healthy donors with (CD8+) or without (CD8-) CD4 T cell proliferation. P-values generated by one-way paired t-tests for comparisons of responses obtained of PBMC tested with or without CD8 T cell depletion, (*p < .05). No significant difference was seen in Control mAb and mAb3 under these conditions
The response of CD4 T cells in the CD8 T cell-depleted PBMC assay agrees with the rate of clinical immunogenicity
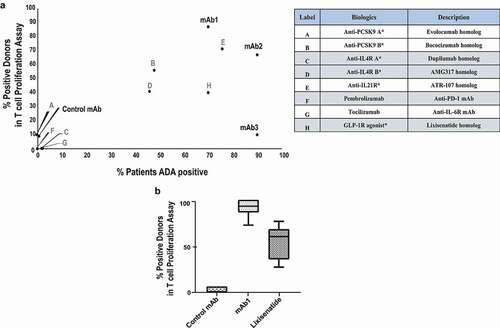
Previous studies have established that the CD8-depleted CD4 T cell assays can help predict the immunogenicity risk of biotherapeutics.Citation12,Citation13 In order to further validate the CD4 T cell proliferation assay with CD8-depleted PBMC as an effective in vitro tool for assessing the relative risk of immunogenicity in the clinic, eight additional biologics with known rates of clinical immunogenicity were tested for their ability to elicit a CD4 T cell proliferative response (). With the exception of mAb3, the response of CD8-depleted PBMC to biologics agrees with the observed rate of clinical immunogenicity (). To assess the reproducibility of the results, the CD4 T cell proliferative response to three representative biologics (mAb1, lixisenatide homolog, and control mAb) was tested on different days and with different sets of 10 donors. Remarkably, the percentage of donors mounting a response to mAb1, lixisenatide and control mAb was minimally altered between experiments (), suggesting that the CD4 T cell proliferative assay using CD8 T cell-depleted PBMC is a reasonable approach for immunogenicity risk evaluation.
Figure 3. The response of CD4 T-cells in the CD8 T cell-depleted PBMC assay agrees with the rate of clinical immunogenicity. (a) Therapeutic proteins and peptides with known clinical immunogenicity were tested in the CD8 T cell-depleted PBMC proliferation assay in 10 healthy donor cohorts. The percent of donor positive in this assay correlates with the percent ADA observed in clinic for all of the therapeutic antibodies tested, except for mAb3. (b) Control mAb, mAb1 and Lixisenatide were tested multiple times in the CD8 T cell-depleted PBMC proliferation assay using different cohorts of 10 healthy donors. Box and whisker plots show the percent of positive donors observed following treatment with Control mAb (n = 5), mAb1 (n = 20), or Lixisenatide (n = 14)
Immunogenic mAbs differ in their capacity to promote antigen-presenting cells activation
The remarkable differences in the abilities of immunogenic mAbs to induce CD4 T cell proliferative responses with human PBMC led us to further characterize the immune responses directed against these biologics. Activation of antigen-presenting cells, such as monocytes and DCs, is a key step in priming an unwanted immune response that may ultimately lead to ADA production.Citation14,Citation15 To determine the effect of control mAb, mAb1, mAb2, and mAb3 on DC activation, immature DCs derived from CD14+ monocytes from healthy donors were incubated with 100 µg/ml of the test antibodies for 48 hours. Maturation was determined by the upregulation of membrane-associated marker CD83 and the co-stimulatory markers CD80 and CD86 relative to media control. Modulation of the expression levels of these DC surface receptors was illustrated by changes in median fluorescence intensity (MFI). As shown in , treatment of DC with lipopolysaccharide (LPS) or with mAb1 resulted in a significant upregulation of CD80, CD83, and CD86 in all tested donors when compared to the media control. In contrast, control mAb, mAb2, and mAb3 did not elicit DC activation ().
Figure 4. Immunogenic monoclonal antibodies differ in their capacity to promote DC activation. Immature DCs were treated with media, LPS, Control mAb, mAb1, mAb2, or mAb3 for 48 hours. (a) Flow cytometric analysis of percentage of activated DCs as measured by CD80, CD83, or CD86 expression. Results are expressed as the percent of marker expression. Results from 3 independent experiments are shown, individual points representing the mean of individual donor responses. (b) Analysis of cytokine release by DCs after treatment with the indicated test antigens. Results are expressed as fold change over media only control. The response of eight cytokines was measured by a multiplex cytokine analysis. Bar Graphs represent the mean ± SEM fold-change in cytokine levels to media control. P values were generated by a one-way ANOVA followed by a paired T-test of log10 transformed concentrations of each test article versus media. A response was considered positive if the fold change (p < .05) was >2-fold above media control (***p < .0005, **p < .005, and *p < .05)
The release of proinflammatory cytokines is another important hallmark of activated DC that potentiate adaptive immune response. To evaluate if proinflammatory cytokines and chemokines were differentially secreted, the levels of four interleukins (IL) (IL-1β, IL-6, IL-8, and IL-12p70), tumor necrosis factor (TNF), monocyte chemoattractant protein-1 (MCP-1), and two macrophage inflammatory proteins ((MIP); MIP-1α and MIP-1β) were measured in the supernatants of DC cultures 48 hours after incubation with control mAb, mAb1, mAb2, and mAb3. Consistent with the results from the activation markers, mAb1 induced the significant release of 5 of the 8 cytokines tested (IL-1β, IL-8, TNF, MIP-1α, and MIP-1β) (). The remaining 3 cytokines were not affected (data not shown). In contrast, no significant increase in any cytokines tested was observed following DC incubation with control mAb, mAb2, or mAb3. Altogether, of the three immunogenic mAbs investigated in these studies, only one, mAb1, triggered human DC maturation in vitro.
Monocyte activation and the release of monocyte-specific cytokines have also been associated with immunogenic antibodies and aggregates.Citation16,Citation17 To assess the capacity of therapeutic antibodies to stimulate human monocytes, CD14+ monocytes purified from healthy donors were incubated with 100 µg/ml of the test antibodies for 48 hours and the levels of 8 cytokines were measured by multiplex cytokine analysis. In contrast to what was observed with human DC, mAb2 was able to trigger human monocyte activation and the release of 4 of the 8 cytokines tested (TNF, MCP-1, MIP-1α and MIP-1β) (). The remaining 4 cytokines were not affected (data not shown). However, mAb1 was again found to have the greatest capacity to stimulate cytokine release while control mAb and mAb3 failed to elicit any cytokine from human monocytes. Overall, immunogenic therapeutic antibodies differ in their capacity to promote the activation of human antigen-presenting cells.
Figure 5. Immunogenic monoclonal antibodies differ in their capacity to promote monocyte activation. Isolated CD14+ monocytes from 4 donors were cultured with Control mAb, mAb1, mAb2, or mAb3. After 48 hours incubation at 37̊C, supernatants were collected and analyzed by multiplex cytokine analysis. Bars represent the mean ± SEM. P values were generated by a one-way ANOVA followed by a paired T-test of log10 transformed concentrations of each test article versus media. A response was considered positive if the fold change (p < .05) was >2-fold above media control (***p < .0005, **p < .005, and *p < .05)
Enhanced DC antigen uptake and processing by immunogenic mAbs
Recent studies have suggested that the immunogenicity observed with some antibodies could be attributed to an enhanced antigen uptake and processing by DC.Citation7,Citation8 To evaluate mAbs internalization and degradation, DC from 13 individual donors were incubated with mAbs in the presence of an activatable fluorescence-quencher probe consisting of goat-anti-human IgG antigen-binding fragments (Fabs) conjugated with the tetramethylrhodamine (TAMRA) (fluorophore)–QSY7 (quencher) pair.Citation18,Citation19 In this assay, TAMRA fluorescence only appears following DC internalization of the antibody/probe complex and subsequent degradation to separate the dye and the quencher. After 24-hours incubation, TAMRA fluorescence was detected in DCs that had been incubated with mAb1, mAb2, mAb3 and control mAb (). However, DC internalization was more efficient with immunogenic mAbs (44.8, 29.3 and 22.7% TAMRA+ for mAb1, mAb2 and mAb3, respectively) than with the non-immunogenic control mAb (15.8% TAMRA+) or isotype control antibody (hIgG1-EN) (,b). Collectively, these data suggest that immunogenic mAbs are more efficiently internalized and degraded than nonimmunogenic mAbs without necessarily promoting DC activation.
Figure 6. Enhanced DC antigen uptake and processing by immunogenic mAbs. CD14+ monocyte-derived dendritic cells from 13 healthy individual donors were incubated with the therapeutic antibodies and the matched isotype control antibody (hIgG1-EN) in the presence of an activatable fluorescence-quencher probe consisting of goat-anti-human IgG Fab-fragments conjugated with the TAMRA (fluorophore)–QSY7 (quencher) pair. Endocytosis of the internalized antibody was measured by an increase in % TAMRA by flow cytometry. (a) Representative flow plots are gated on live single cells. (b) Scatter plot summarizing the %TAMRA+ from 13 donors incubated with the test antigens, hIgG1-EN, Control mAb, mAb1, mAb2, and mAb3
Immunogenic mAbs contain higher numbers of potential CD4 T cell epitopes
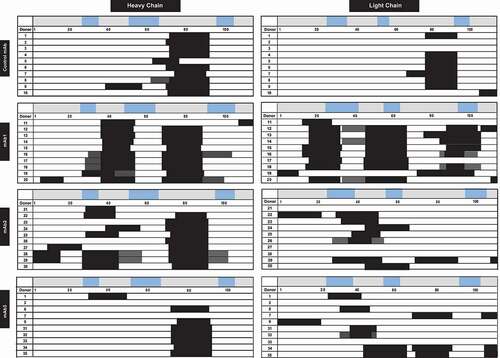
To determine which mAb sequences are likely to be processed and presented, DCs from 10 HLA-typed healthy donors were pulsed with test biotherapeutics and the HLA-DR/DP/DQ-associated peptides were identified using a MAPPS assay. Numerous peptides were identified in the tested mAbs clustering in several regions along the antibody sequence. The most common clusters observed in all mAbs and in most donors were derived from the framework region 3 (FRW3) of the heavy and light chains. The prevalent display of FRW3 peptides with germline sequence has been noticed in most therapeutic mAbs irrespective of their clinical immunogenicityCitation20 and in intravenous immunoglobulin.Citation21 In contrast, marked differences in the number of clusters overlapping CDR regions that displayed the highest sequence diversity were observed between the non-immunogenic control mAb and immunogenic mAbs. While only one cluster overlapping the CDR2 region of the heavy chain was observed in the control mAb, multiple clusters overlapping CDR1, CDR2, or CDR3 regions were found in the heavy and light chains of mAb1, mAb2 and mAb3 (). Altogether, these data suggest immunogenic mAbs contain higher number of potential CD4 T cell epitopes.
Figure 7. Immunogenic monoclonal antibodies contain higher number of potential CD4 T cell epitopes. MAPPS cluster map of HLA-DR/DP/DQ associated peptides produced by 5 × 10⁶ DCs from 10 different donors exposed to control mAb, mAb1, mAb2, or mAb3. CDRs are indicated as the blue boxes along the sequence of heavy chain (left) and light chain (right) for each monoclonal antibody. Peptide clusters are indicated by black boxes for each donor, consist of 14-mers to 25-mer peptide sequences are indicated
CD4 T cell proliferation assay with MAPPS peptides identify helper T cell epitope in mAb3
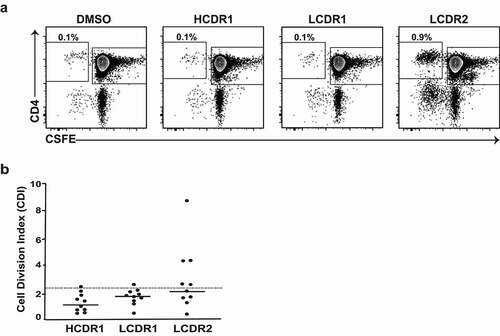
The identification of three potential CD4 T cell epitopes in mAb3 (located in heavy chain CDR1 region, light chain CDR1 and CDR2 regions) by the MAPPS assay suggested an explanation for the high clinical immunogenicity of this mAb. However, foreign peptide binding to HLA class II constitutes a necessary, but not sufficient, condition for the development of ADAs. To further assess the potential for a T cell response of the different peptide clusters observed in mAb3, representative peptides from the MAPPS assay were synthetized and each cluster was tested independently in the CD8 T cell-depleted PBMC proliferation assay using PBMCs from 10 healthy donors. Unlike peptides from the CDR1 regions of the heavy and light chains that triggered a weak positive response in one of the 10 donors tested, peptides encompassing the light chain CDR2 regions of mAb3, which were not predicted by in silico algorithms, triggered a CD4 T cell response in half of the donors tested (), suggesting that this immunodominant T cell epitope could be responsible for the high immunogenicity of mAb3.
Figure 8. Identification of a single immunodominant T cell epitope in mAb3. (a) Representative plots showing flow cytometric analysis of CD4 T cell proliferative response from CD8 T cell depleted PBMC 7 days after incubation with the indicated MAPPS peptides derived from mAb3 or DMSO-containing buffer. CD8 T cell depleted PBMCs were labeled with CFSE prior to incubation with test articles. Cells in plots were gated from DAPI−CD14−CD19−CD3+. (b) Scatter plot summarizing the CDI data from 10 donors incubated with the indicated MAPPS peptides from mAb3. The dotted line indicates CDI ≥ 2.5, which is the threshold value for a positive response
Discussion
Despite efforts to reduce non-human amino acid content during mAb humanization, immunogenicity is still a significant issue for the development of biologics. The three therapeutic mAbs evaluated in this manuscript triggered high ADA in their Phase 1 clinical development. Our post-hoc analysis reveal that these mAbs have distinct capacity to induce innate and adaptive immune responses in vitro, highlighting the importance of combining different in vitro assays to better predict the immunogenicity risk.
We initially evaluated the capacity of the immunogenic mAbs to induce CD4 T cell proliferation upon incubation with PBMC from healthy donors, the most common assay used by pharmaceutical companies to predict preclinical immunogenicity.Citation15 While the PBMC assay correctly predicted the immunogenicity of mAb1, it failed to predict the immunogenicity of mAb2 or mAb3 and, overall, the magnitude of the CD4 T cell responses triggered by the assay positive controls (KLH, mAb1) was low. Interestingly, CD8 T cell depletion enhanced the CD4 T cell proliferative response to most biologics with high immunogenicity (KLH, mAb1, and mAb2) without increasing the response to negative control mAb, suggesting that CD8 T cells in vitro hinder human CD4 T cell responses to immunogenic antibodies. Regulatory CD8 T cells have been shown to modulate in vitro the human CD4 T cell responses to autoantigens,Citation11 alloantigens,Citation22 and xenoantigens.Citation23 This is the first time, to our knowledge, that CD8 T cells have been shown to inhibit the human CD4 T cell responses to therapeutic mAbs. These results provide an important rationale for the use of CD8-depleted CD4 T-cell assays that are available commercially from multiple companies to predict immunogenicity. The CD4 T cell responses observed in the CD8-depleted PBMC assay were not only more robust than in the PBMC assay, but also agreed with the relative clinical responses of the eight mAbs tested. The assay can therefore help select therapeutic biologics with the least potential to be immune activating in the clinic based on their ability to drive a T-cell functional response in vitro.
Although the CD8 T cell-depleted PBMC assay is useful for relative risk ranking and candidate selection, the lack of response to mAb3, an antibody not predicted to modulate CD4 T cell responses, suggests that it is not sufficient to correctly predict the immunogenicity risk of all biotherapeutics. One key component of immunogenicity is the uptake and processing of the biotherapeutic by antigen-presenting cells and the subsequent presentation of peptides bound by MHC class II proteins to T cells. DCs are believed to be the main antigen-presenting cells initiating CD4 T cell responses in secondary lymphoid organs in vivo.Citation14 Since DCs are found low in numbers in whole blood, we used monocyte-derived DC to better characterize the response of human DCs to immunogenic therapeutic mAbs.
Previous studies have shown that immunogenic antibodiesCitation7 as well as antibody aggregatesCitation24,Citation25 can induce DC maturation. This is consistent with the concept that the immune system responds to molecules that enter the body and cause the release of immune-stimulating alarm signals.Citation26 However, in our study, only mAb1 triggered DC maturation, as indicated by CD86/CD83 expression and the release of proinflammatory cytokines. mAb2 and mAb3 did not trigger DC maturation. Interestingly, mAb2, unlike mAb3, triggered the production of proinflammatory cytokines from purified human monocytes. mAb2 and mAb3 differ by 3 amino acid residues in regions of the heavy chain CDRs. There was no apparent difference in the conformational stability, as measured by melting temperature determined via differential scanning calorimetry, and aggregation potential, as measured in a stability study by size exclusion chromatography analysis. However, mAb2 showed higher surface charge, leading to increased nonspecific interactions of mAb2 to cell surfaces or other proteins, including human serum albumin. The increased nonspecific interaction of mAb2 likely contributed to the weak monocyte activation and increased T cell proliferation compared to mAb3. The weak innate response triggered by mAb2 may also explain why CD8 T cell depletion was required to measure CD4 T cell proliferation in the PBMC assay. Altogether, these results suggest that the three distinct capacities of mAb1, mAb2, and mAb3 to stimulate CD4 T cell responses correlated with their different capacities to stimulate antigen-presenting cells.
Recent studies have emphasized that immunogenic therapeutics are associated with increased internalization and processing by DC.Citation7,Citation8 When we compared the internalization and processing of mAb1, mAb2, and mAb3, it was clear that immunogenic mAbs are internalized and processed more efficiently than isotype control and non-immunogenic mAbs. While the increased internalization and processing could be explained for mAb1 by DC expression of the target antigen, DC did not express the target for mAb2 and mAb3, suggesting that other mAbs properties, such as charge distribution,Citation27 may contribute to their ability to be processed by DC.
The increased internalization and processing observed with the immunogenic mAbs tested led us to characterize the peptides presented by individual HLA-DR alleles on DCs using the MAPPS assay. MAPPs assays have been used successfully to identify potential T cell epitopes in recent mechanistic studies to understand the immunogenicity of several therapeutics.Citation9,Citation28,Citation29 In our studies, numerous peptides were identified in the tested mAbs clustering in several regions along the antibody sequence. While clusters overlapping the framework region FRW3 of the heavy and light chains were present in most therapeutic mAbs irrespective of their clinical immunogenicity, clusters overlapping CDR1 and CDR2 regions were more abundant in immunogenic humanized mAbs. Since not all the residues within the CDRs of humanized mAbs can be reverted to the germline sequence of the human antibody scaffold, clusters derived from these regions represent potential T cell epitopes.Citation1 Since none of the assays previously described were able to predict the high clinical immunogenicity of mAb3, we compared the capacity of the MAPPS peptides derived from mAb3 to induce CD4 T cell response in the CD8 T cell-depleted PBMC assay. In contrast to the whole antibody mAb3, which did not trigger any response in this assay, MAPPS peptides encompassing the light chain CDR2 region of mAb3 triggered a robust response in five donors, suggesting that it is a dominant T cell epitope in this humanized antibody. Remarkably, a recent study using PBMC from two patients uncovered a single immunodominant T cell epitope in the light chain CDR2 region of natalizumab,Citation29 raising the question of the importance of the light chain CDR2 region in the immunogenicity issues encountered with humanized antibodies.
Based on these results, we propose a decision tree that integrates DC-based assays (internalization; MAPPS) and T-cell proliferation assays in support of mAb immunogenicity risk prediction in early preclinical drug development (). Consistent with previous studies,Citation4,Citation12 strong response in the CD8 T cell-depleted PBMC proliferation assay is predictive of a high immunogenicity risk. However, additional assays are required to increase the confidence that molecules with a weak or negative response in the CD8 T cell-depleted PBMC proliferation assay have a low risk of immunogenicity. This decision tree has its own limitation. Immunomodulatory mAbs (e.g., TNF blockers) that are known to interfere with the T-cell proliferation assay are best evaluated directly in the DC-based assays. Also, this early immunogenicity risk assessment does not take into account treatment-related factors (e.g., dose, route, frequency) and patient-related factors (e.g., disease state, concurrent medication) that are known to influence the immunogenicity risk in the clinic.
Figure 9. Proposed decision tree in support of mAb immunogenicity risk prediction. The number of donors used in each assay is indicated and correspond, for the T cell proliferation and DC internalization assays, to the minimal number of donors necessary to provide a consistent response with the assay positive and negative controls. For the MAPPS assay, a typical 10 donor panel samples >12 HLA-DR alleles and represent ~ 60% of the U.S. allele frequency
Materials and methods
Monoclonal antibodies and peptides
The immunogenic positive antigen, KLH (ImjectTM mcKLH; Thermo Fisher Scientific) was reconstituted with 2 mL of ultrapure water. The final assay concentration for KLH was 100 µg/ml. Control mAb, mAb1, mAb2, and mAb3 are proprietary antibodies and were supplied by Eli Lilly and Co. The variable chain genes for evolocumab, bocoizumab, dupilumab, AMG317and ATR-107 homologs were synthesized based upon the published sequences described by the World Health Organization’s International Nonproprietary Names for Pharmaceutical Substances or U.S. patents. The VH and VL genes were subcloned into vectors encoding whole antibody heavy and light chains, respectively. The generic versions of the biologics of interest were produced by transfection into Chinese hamster ovary (CHO-GS/Lipase KO(2F9) cells (Lonza, Basel, Switzerland)) cells. The harvested cell culture fluid for the antibodies was purified using Protein-A affinity chromatography (MabSelect SuRe; GE Healthcare Bio-Sciences, AB, Uppsala, Sweden) and Strong Cation Exchange (SCX/SEC) chromatography (Poros50 HS SCX (Thermo Scientific Cat#1335906, GE Healthcare cat#28922937). Pembrolizumab (25 mg/ml; Merck and Company, NDC code 0006–3026-02) and tocilizumab (20 mg/ml; Genentech, NDC code 50242–136-01) were obtained through Lilly Commercial Product Sourcing (Eli Lilly and Company, Indianapolis, IN). The concentration of mAbs used in the assay was 50 µg/ml (0.33 µM). MAPPS-derived peptides and lixisenatide homolog were synthesized by Chinese Peptide Company (CPC, Zhejiang, China) and Midwest Biotech, Inc (Fishers, IN). Peptide purity determined by liquid chromatography (LC) to be greater than 90% and molecular weights were validated by mass spectrometry. MAPPS-derived Peptides were tested at 10 µM.
T cell proliferation assay
Cryopreserved PMBCs were purchased from Cellular Technology Limited (Cellular Technology Limited; cat# CTL-CP1). For studies using CD4+ CD8- PBMCs, CD8 + T cells were depleted from the PBMCs by immunomagnetic sorting using CD8 Microbeads, human (Miltenyi Biotec, cat # 130–045-201) using an AutoMACS Pro separator (Miltenyi Biotec) according to the manufacturer’s protocol. PBMCs were prepared and labeled with 1 µM CFSE (Molecular probes, C1157) from a cohort of 10 healthy donors. PBMCs were seeded in a 24-well plate at 4 × 10⁶ cells/ml/well in AIM-V media (Life Technologies, cat# 12055–083) containing 5% CTSTM Immune Cell SR (Gibco, cat# A2596101), tested in triplicate in 2.0 mL media control, KLH, Control mAb, mAb1, mAb2, and mAb3 at 0.33 µM. Cultures were incubated for 7 days at 37°C with 5% CO2. On day 7, samples were stained with the following cell surface markers: anti-CD3 (BioLegend, cat# 300424), anti-CD4 (BioLegend, cat# 300530), anti-CD14 (BD BioSciences, cat#563743), anti-CD19 (BD BioSciences, cat#562440) and DAPI (BD Pharmigen, cat#564907) for viability detection and analyzed by flow cytometry using a BD LSRFortessaTM, equipped with a High Throughput Sampler. Data was analyzed using FlowJo® Software (FlowJo, LLC, TreeStar). For data analysis, the CDI was calculated as previously described.Citation10
MAPPS
Fresh buffy coats, obtained from 10 informed consent healthy donors (Indiana Blood Center or The American Red Cross) according to local ethical practice, were spun through a Ficoll-PaqueTM (GE Healthcare, cat# 17544203) gradient to obtain the PBMCs. CD14+ cells were separated from the PBMCs by use of an autoMACS instrument with anti-CD14 magnetic beads (Miltenyi Biotech, cat#130-050-201). After viability determination with Trypan Blue (Coulter), purified CD14+ mononuclear cells were resuspended in complete RPMI Media (RPMI 1640; 10% heat-inactivated fetal bovine serum (FBS), 1% L-glutamine, 1% HEPES, 1% nonessential amino acids, 1% penicillin/streptomycin, 1% sodium pyruvate with β-mercaptoethanol) containing 40 ng/ml granulocyte monocyte-colony stimulating factor (human GM-CSF; Sargramostim, Sanofi-Aventis, NDC code 0024–5843-05) and 20 ng/mL IL-4 (R&D Systems, cat # 204-IL) to a density of 1 × 10⁶ cells/ml and were differentiated into immature DCs in 6-well cell culture dishes (5 mL final culture volume) at 37°C and 5% CO2. On day 4, immature DCs were loaded with the therapeutic antibodies, Control mAb, mAb1, mAb2, and mAb3, and were incubated for 24 hours. DCs were matured by adding LPS (1 µg/mL final concentration; Sigma-Aldrich, L5886) to the media. The cells were lysed with RIPA lysis and extraction buffer (ThermoFisher Scientific, cat # 89900) containing DNase (Sigma Aldrich, cat # 4716728001) and protease inhibitors (Sigma-Aldrich, cat # 11836170001).
An Agilent AssayMAP robot was used to isolate the MHC-II molecules with biotinylated anti-pan MHC II antibody coupled to streptavidin tips. Duplicate treated wells were pooled, and the eluted peptides were passed over a 10 k molecular weight cutoff spin filter treated with bovine serum albumin and angiotensin I peptide. The filtered material was loaded in a 96-well PCR plate for analysis via mass spectrometry.
The samples were analyzed with a Thermo QE-HFX mass spectrometer using a Thermo easy LC-HPLC system. The separation was carried out with a 75 µm x 7 cm C18 column (New Objectives) coupled to a custom nanospray interface. Data was analyzed with the Lilly proteomics pipeline (database searches done with X! Tandem, OMSSA, and ProteinPilot with a database consisting of the therapeutic antibody sequence, common proteins seen in Raji and dendritic cells on MHC-II from human and bovine origin). The output was analyzed using KNIME 3.3.
DC internalization and activation study
PBMCs, derived from whole blood obtained from healthy donors (San Diego Blood Bank, San Diego, CA) after informed consent according to local ethical practice, were spun through a Ficoll-PaqueTM (GE Healthcare, cat# 17544203) gradient. CD14+ monocytes were isolated using LS columns (Miltenyi Biotec, #130-042-401) according to the manufacturer’s instructions and cultured in complete RPMI media containing 179 ng/ml GM-CSF (human GM-CSF, Sanofi-Aventis, NDC code 0024–5843-05) and 20 ng/ml human IL-4 (Syngene for Eli Lilly and Company). Media was changed twice on day 2 and day 5. On day 6, cells were harvested and used for DC internalization and activation studies. For the DC internalization studies, a fluorescently labeled F(ab’)2 targeting human Ig Fcγ fragment was used as a probe to track internalization as previously described.Citation17 The therapeutic antibodies, Control mAb, mAb1, mAb2, and mAb3, were incubated with the fluorescent probe to form a Fab-TAMRA-QSY7 complex. DCs were resuspended at 4 x 10⁶/ml in complete RPMI media and seeded at 50 µL per well in a 96-well round-bottom plate at 37°C and 5% CO2. After 24 hours, cells were washed twice with staining buffer (2% FBS in phosphate-buffered saline) and resuspended in staining buffer containing SYTOXTM Green Nucleic Acid Stain (Invitrogen, cat# S7020) for viability determination. Data was collected on a BD LSRFortessaTM X-20 and was analyzed using FlowJo® Software (FlowJo, LLC, TreeStar).
For DC activation, immature DCs were seeded in 96-well plates as described above. An equal volume of therapeutic antibody solution was added to each well for final concentrations of 100 µg/mL and 50 µg/ml. LPS was used as a positive control. Cells were incubated for 48 h at 37°C and 5% CO2. Then, cells were centrifuged, and the supernatants were collected and stored at −80 for cytokine analysis. Cells were washed once with staining buffer, and multicolor immunofluorescence was performed using the following panel: anti-CD14 (Biolegend cat#325628), anti-CD80 (Biolegend cat# 305220), anti-CD83 (Biolegend cat# 305330), and anti-CD86 (Biolegend cat#305442). After 30 minutes incubation on ice, cells were then washed twice and resuspended in staining buffer with a viability dye (SYTOX Green, Invitrogen, cat# S7020). Data was collected on a BD LSRFortessaTM X-20 and was analyzed in Flowjo®.
The supernatants were measured in duplicate for cytokines (IL-1β, IL-6, IL-8, IL-12p70, TNF, MCP-1, MIP-1α, and MIP-1β) using a customized Human Cytokine/Chemokine Magnetic Bead Panel (Millipore, cat# HCTOMAG-60 K) following the miniature DropArrayTM-96 plate protocol on a LT-MX washer from Curiox or a customized MSD U-Plex kit from Meso Scale Discovery (cat# K15067 L), following the manufacturer’s instructions. Data was collected and analyzed using the BioRad Bio-Plex 200 system or MSD Discovery Workbench 4.0 software.
Statistical analysis
All analyses were performed using excel or GraphPad Prism (version 10). The specific statistical tests used are indicated in the figure legends or in the Results section.
Disclosure of potential conflicts of interest
During the execution of this work, all authors were employees and own stocks or stock options of Eli Lilly and Company. The authors have no other conflicts of interest or subject matter of materials discussed in this manuscript to be disclosed.
Abbreviations
| ADA | = | Anti-drug antibody |
| CDR | = | Complementarity-determining region |
| CDI | = | Cell Division Index |
| CFSE | = | Carboxyfluorescein diacetate succinimidyl ester |
| DCs | = | Dendritic cells |
| HLA | = | Human leukocyte antigen |
| KLH | = | Keyhole limpet hemocyanin |
| LPS | = | lipopolysaccharide |
| MHC II | = | Major histocompatibility complex class II |
| MAPPS | = | MHC-associated peptide proteomics |
| mAb | = | Monoclonal antibody |
| PBMC | = | Peripheral blood mononuclear cell |
| FRW3 | = | Framework region 3 |
Acknowledgments
The authors would like to thank Sarah Labra for excellent technical assistance, as well as Nada Alakhras for guidance on figure design. We also thank Lukasz Chlewicki for helpful discussion.
References
- Harding FA, Stickler MM, Razo J, DuBridge RB. The immunogenicity of humanized and fully human antibodies: residual immunogenicity resides in the CDR regions. MAbs. 2010;2(3):256–13. doi:https://doi.org/10.4161/mabs.2.3.11641.
- Crotty S. T follicular helper cell differentiation, function, and roles in disease. Immunity. 2014;41(4):529–42. doi:https://doi.org/10.1016/j.immuni.2014.10.004.
- Jawa V, Cousens LP, Awwad M, Wakshull E, Kropshofer H, De Groot AS. T-cell dependent immunogenicity of protein therapeutics: preclinical assessment and mitigation. Clin Immunol. 2013;149(3):534–55. doi:https://doi.org/10.1016/j.clim.2013.09.006.
- Joubert MK, Deshpande M, Yang J, Reynolds H, Bryson C, Fogg M, Baker MP, Herskovitz J, Goletz TJ, Zhou L, et al. Use of in vitro assays to assess immunogenicity risk of antibody-based biotherapeutics. PLoS One. 2016;11(8):e0159328. doi:https://doi.org/10.1371/journal.pone.0159328.
- Schultz HS, Reedtz-Runge SL, Backstrom BT, Lamberth K, Pedersen CR, Kvarnhammar AM, Akatsuka Y. Quantitative analysis of the CD4+ T cell response to therapeutic antibodies in healthy donors using a novel T cell: pBMCassay. PLoS One. 2017;12(5):e0178544. doi:https://doi.org/10.1371/journal.pone.0178544.
- Ito S, Ikuno T, Mishima M, Yano M, Hara T, Kuramochi T, Sampei Z, Wakabayashi T, Tabo M, Chiba S, et al. In vitro human helper T-cell assay to screen antibody drug candidates for immunogenicity. J Immunotoxicol. 2019;16(1):125–32. doi:https://doi.org/10.1080/1547691X.2019.1604586.
- Xue L, Hickling T, Song R, Nowak J, Rup B. Contribution of enhanced engagement of antigen presentation machinery to the clinical immunogenicity of a human interleukin (IL)-21 receptor-blocking therapeutic antibody. Clin Exp Immunol. 2016;183(1):102–13. doi:https://doi.org/10.1111/cei.12711.
- Deora A, Hegde S, Lee J, Choi CH, Chang Q, Lee C, Eaton L, Tang H, Wang D, Lee D, et al. Transmembrane TNF-dependent uptake of anti-TNF antibodies. MAbs. 2017;9(4):680–95. doi:https://doi.org/10.1080/19420862.2017.1304869.
- Hamze M, Meunier S, Karle A, Gdoura A, Goudet A, Szely N, Pallardy M, Carbonnel F, Spindeldreher S, Mariette X, et al. Characterization of CD4 T cell epitopes of infliximab and rituximab identified from healthy donors. Front Immunol. 2017;8:500. doi:https://doi.org/10.3389/fimmu.2017.00500.
- Mannering SI, Morris JS, Jensen KP, Purcell AW, Honeyman MC, van Endert PM, Harrison LC. A sensitive method for detecting proliferation of rare autoantigen-specific human T cells. J Immunol Methods. 2003;283(12):173–83. doi:https://doi.org/10.1016/j.jim.2003.09.004.
- James EA, Kwok WW. CD8+ suppressor-mediated regulation of human CD4+ T cell responses to glutamic acid decarboxylase 65. Eur J Immunol. 2007;37(1):78–86. doi:https://doi.org/10.1002/eji.200636383.
- Baker MP, Jones TD. Identification and removal of immunogenicity in therapeutic proteins. Curr Opin Drug Discov Devel. 2007;10:219–27.
- Jaber A, Baker MP. Assessment of the immunogenicity of different interferon beta-1a formulations using ex vivo T-cell assays. J Pharm Biomed Anal. 2007;43(3):1256–61. doi:https://doi.org/10.1016/j.jpba.2006.10.023.
- Banchereau J, Steinman RM. Dendritic cells and the control of immunity. Nature. 1998;392(6673):245–52. doi:https://doi.org/10.1038/32588.
- Tourdot S, Hickling TP. Nonclinical immunogenicity risk assessment of therapeutic proteins. Bioanalysis. 2019;11(17):1631–43. doi:https://doi.org/10.4155/bio-2018-0246.
- Ling ZD, Ziltener HJ, Webb BT, Matheson DS. Aggregated immunoglobulin and Fc fragment of IgG induce IL-6 release from human monocytes. Cell Immunol. 1990;129(1):95–103. doi:https://doi.org/10.1016/0008-8749(90)90189-x.
- Moussa EM, Panchal JP, Moorthy BS, Blum JS, Joubert MK, Narhi LO, Topp EM. Immunogenicity of Therapeutic Protein Aggregates. J Pharm Sci. 2016;105(2):417–30. doi:https://doi.org/10.1016/j.xphs.2015.11.002.
- Li Y, Liu PC, Shen Y, Snavely MD, Hiraga K. Cell-based internalization and Degradation assay with an activatable fluorescence-quencher probe as a tool for functional antibody screening. J Biomol Screen. 2015;20(7):869–75. doi:https://doi.org/10.1177/1087057115588511.
- Wen Y, Cahya S, Zeng W, Lin J, Wang X, Liu L, Malherbe L, Siegel R, Ferrante A, Kaliyaperumal A, et al. Development of a FRET-based assay for analyisis of mAbs internalization and processing by dendritic cells in preclinical immunogenicity risk assessment. Aaps J. 2020; 22(3):68. doi:https://doi.org/10.1208/s12248-020-00444-1.
- Karle A, Spindeldreher S, Kolbinger F. Secukinumab, a novel anti-IL-17A antibody, shows low immunogenicity potential in human in vitro assays comparable to other marketed biotherapeutics with low clinical immunogenicity. MAbs. 2016;8(3):536–50. doi:https://doi.org/10.1080/19420862.2015.1136761.
- Sorde L, Spindeldreher S, Palmer E, Karle A. Massive immune response against IVIg interferes with response against other antigens in mice: A new mode of action? PLoS One. 2017;12(10):e0186046. doi:https://doi.org/10.1371/journal.pone.0186046.
- Feng F, Liu Y, Liu G, Zhu P, Zhu M, Zhang H, Lu X, Liu J, Luo X, Yu Y, et al. Human CD8(+)CD28(-) T suppressor cells expanded by IL-15 in vitro suppress in an allospecific and programmed cell death protein 1-dependent manner. Front Immunol. 2018;9:1442. doi:https://doi.org/10.3389/fimmu.2018.01442.
- Ciubotariu R, Colovai AI, Pennesi G, Liu Z, Smith D, Berlocco P, Cortesini R, Suciu-Foca N. Specific suppression of human CD4+ Th cell responses to pig MHC antigens by CD8+CD28- regulatory T cells. J Immunol. 1998;161:5193–202.
- Rombach-Riegraf V, Karle AC, Wolf B, Sorde L, Koepke S, Gottlieb S, Krieg J, Djidja M-C, Baban A, Spindeldreher S, et al. Aggregation of human recombinant monoclonal antibodies influences the capacity of dendritic cells to stimulate adaptive T-cell responses in vitro. PLoS One. 2014;9(1):e86322. doi:https://doi.org/10.1371/journal.pone.0086322.
- Morgan H, Tseng SY, Gallais Y, Leineweber M, Buchmann P, Riccardi S, Nabhan M, Lo J, Gani Z, Szely N, et al. Evaluation of in vitro assays to assess the modulation of dendritic cells functions by therapeutic antibodies and aggregates. Front Immunol. 2019;10:601. doi:https://doi.org/10.3389/fimmu.2019.00601.
- Matzinger P. The danger model: a renewed sense of self. Science. 2002;296(5566):301–05. doi:https://doi.org/10.1126/science.1071059.
- Wen Y, Waltman A, Han H, Collier JH. Switching the immunogenicity of peptide assemblies using surface properties. ACS Nano. 2016;10(10):9274–86. doi:https://doi.org/10.1021/acsnano.6b03409.
- Lamberth K, Reedtz-Runge SL, Simon J, Klementyeva K, Pandey GS, Padkjaer SB, Pascal V, León IR, Gudme CN, Buus S, et al. Post hoc assessment of the immunogenicity of bioengineered factor VIIa demonstrates the use of preclinical tools. Sci Transl Med. 2017;9(372):1–11. doi:https://doi.org/10.1126/scitranslmed.aag1286.
- Cassotta A, Mikol V, Bertrand T, Pouzieux S, Le Parc J, Ferrari P, Dumas J, Auer M, Deisenhammer F, Gastaldi M, et al. A single T cell epitope drives the neutralizing anti-drug antibody response to natalizumab in multiple sclerosis patients. Nat Med. 2019;25(9):1402–07. doi:https://doi.org/10.1038/s41591-019-0568-2.