
ABSTRACT
Process intensification has shown great potential to increase productivity and reduce costs in biomanufacturing. This case study describes the evolution of a manufacturing process from a conventional processing scheme at 1000-L scale (Process A, n = 5) to intensified processing schemes at both 1000-L (Process B, n = 8) and 2000-L scales (Process C, n = 3) for the production of a monoclonal antibody by a Chinese hamster ovary cell line. For the upstream part of the process, we implemented an intensified seed culture scheme to enhance cell densities at the seed culture step (N-1) prior to the production bioreactor (N) by using either enriched N-1 seed culture medium for Process B or by operating the N-1 step in perfusion mode for Process C. The increased final cell densities at the N-1 step allowed for much higher inoculation densities in the production bioreactor operated in fed-batch mode and substantially increased titers by 4-fold from Process A to B and 8-fold from Process A to C, while maintaining comparable final product quality. Multiple changes were made to intensify the downstream process to accommodate the increased titers. New high-capacity resins were implemented for the Protein A and anion exchange chromatography (AEX) steps, and the cation exchange chromatography (CEX) step was changed from bind-elute to flow-through mode for the streamlined Process B. Multi-column chromatography was developed for Protein A capture, and an integrated AEX-CEX pool-less polishing steps allowed semi-continuous Process C with increased productivity as well as reductions in resin requirements, buffer consumption, and processing times. A cost-of-goods analysis on consumables showed 6.7–10.1 fold cost reduction from the conventional Process A to the intensified Process C. The hybrid-intensified process described here is easy to implement in manufacturing and lays a good foundation to develop a fully continuous manufacturing with even higher productivity in the future.
Introduction
Improvements in biomanufacturing using mammalian cell culture has increased titers from mg/L to g/L, leading to substantial reductions in the cost-of-goods (COG) over the last 30 years.Citation1 The major strategies for titer improvement include cell line engineering, cell culture medium development, and bioreactor parameter optimization, but desirable and acceptable product quality attributes must be maintained during the process.Citation2-Citation5 Nevertheless, the most recent survey by BioPlan Associates indicates that productivity and yield improvement are still the most important challenge facing the biomanufacturing industry.Citation6 To reduce the manufacturing cost, which would allow wider patient access, process intensification through continuous or semi-continuous biomanufacturing has been extensively studied in both academia and industry.Citation7-Citation11
Process intensification is defined as the adoption of innovative technologies and methods to achieve major process improvements (e.g., productivity), which significantly reduce manufacturing costs and facility footprints. In the chemical industry, process intensification has successfully been implemented for effective manufacturing of commercial commodities with dramatic reductions in costs and plant footprints over the last several decades.Citation12,Citation13 However, it has been more challenging to implement continuous or perfusion operations in the highly regulated biomanufacturing industry, which uses living organisms to produce much more expensive biologics in much smaller production volumes. Perfusion cell culture requires equal volumes of fresh media continuously added and spent media removed, while retaining the cells in the bioreactor by use of perfusion equipment, such as alternating tangential flow (ATF) devices, cross-flow filters, centrifuges, or settlers.Citation14,Citation15 Due to the complexity of process development and automation control, process intensification through perfusion production cell culture has not been widely used in manufacturing of proteins such as monoclonal antibodies (mAbs).Citation6,Citation16-Citation18 A notable exception is in the production of unstable complex proteins/enzymes usually with very low titers. It was reported that the volumetric productivity for an unstable enzyme was improved by 40-fold using perfusion Chinese hamster ovary (CHO) culture over fed-batch culture, but only less than a 5-fold improvement in the volumetric productivity was achieved for a stable mAb.Citation19 The productivity and product quality for unstable proteins have seen much more benefit than stable proteins by implementing perfusion production cell culture,Citation19 leading to its successful application in biomanufacturing of unstable and low titer proteins.Citation20
On the other hand, intensification of fed-batch production processing by applying perfusion operation to the N-1 seed culture step has recently made great progress. In comparison to conventional fed-batch culture with an inoculation seeding density (SD) of approximately 0.5 × 10⁶ cells/mL, the SD can be increased to 2–8 × 10⁶ cells/mL by N-1 perfusion for the inoculum step. This intensified biomanufacturing platform can achieve similar final titers to conventional processes in a shortened cell culture duration, thus leading to significantly improved facility output.Citation21-Citation23 As this strategy requires only minimal changes to existing manufacturing facilities, N-1 seed culture intensification by perfusion has been widely applied in the biopharmaceutical industry.Citation24,Citation25 Furthermore, it has been demonstrated that non-perfusion N-1 seeds (N-1 seed culture generated using either enriched media in batch operation or fed-batch N-1) can be used for the inoculation of the subsequent fed-batch production culture with a SD of 3–6 × 10⁶ cells/mL. As demonstrated with multiple cell lines, processes using non-perfusion N-1 seeds can achieve titers and quality attributes similar to those processes using perfusion N-1 seeds.Citation18 The major advantage of non-perfusion over perfusion N-1 is simpler operation requiring no perfusion device or perfusion medium. More recently the intensified fed-batch platform with a SD of 10–20 × 106 cells/mL by perfusion N-1 in combination with redesigned media has been developed for multiple biologic products.Citation26 This fed-batch strategy can achieve the upper range of the best titers being reported in the current literature.Citation27
In comparison to the magnitude of upstream improvements in fed-batch titers, the overall batch downstream yield has increased, to a lesser extent, from approximately 35% to 70% (although 80% has been reported) in commercial manufacturing for the past decades.Citation1 One common step for mAb capture is Protein A chromatography. Protein A loading capacity has been improved from <40 to 70–80 g/Lresin owing to advances in resin manufacturing technologies.Citation28,Citation29 The polishing chromatography steps have evolved from bind-elute to flow-through mode for streamlined operation and significantly improved throughput.Citation30 Nonetheless, with a substantial increase in upstream titers, the batch downstream operation is still a major productivity bottleneck in bioprocessing, and accounts for a substantial portion of the overall biomanufacturing cost.Citation6,Citation8 Due mainly to its limited loading capacity and high cost, Protein A resins present a throughput challenge to batch downstream operation, especially when upstream titers exceed approximately 10 g/L.Citation28
The need to debottleneck downstream productivity constraints has focused efforts by both academia and industry on downstream process intensification through implementing continuous chromatographyCitation7,Citation31-Citation34 and other technologies, such as continuous viral inactivationCitation35-Citation37 and filtration processes.Citation38,Citation39 In particular, continuous Protein A chromatography, known as multi-column chromatography (MCC), has shown much higher productivity with increased product loading per cycle, significantly reduced buffer consumption and manufacturing facility footprint than for batch capture, while maintaining satisfactory product yield and quality in both laboratory and pilot scales.Citation33,Citation40 In addition, integrated polishing operation of typically two-column steps (e.g., cation exchange chromatography (CEX), anion exchange chromatography (AEX), hydrophobic interaction chromatography) has effectively shortened processing time with elimination of intermediate holding vessels and intermediate pool adjustment steps.Citation30
Although integrating continuous upstream and downstream operation can maximize the benefit of continuous biomanufacturing, reports of such applications have been limited, even in laboratory and pilot scales.Citation7,Citation41-Citation43 Semi-continuous biomanufacturing employing MCC capture and integrated polishing has rarely been implemented in routine GMP manufacturing for mAb production.Citation9,Citation42,Citation44 As integrated continuous biomanufacturing is still largely in the development stage in the industry, hybrid versions may be relatively easy to establish in biomanufacturing, followed by further emergence of fully continuous systems in the future.Citation45
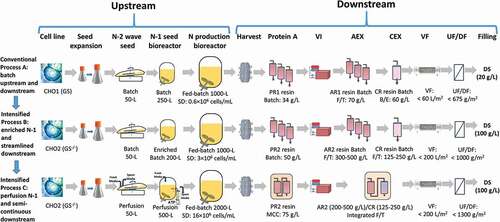
In this case study, we compared three biomanufacturing processes for a mAb produced by CHO cells to demonstrate the evolution from conventional batch process (i.e., Process A) to two commercial-ready-intensified processes (i.e., Processes B and C) (). A hybrid version of integrated upstream and downstream Process C was implemented in biomanufacturing with incorporation of some continuous elements for process intensification. N-1 perfusion was developed in the upstream part of the process for substantially increased fed-batch titer, comparable to the highest titers reported in the literature.Citation27 Two-column MCC Protein A capture and integrated polishing steps were developed for significant downstream productivity improvement. In addition, analytical comparability for final drug substance (DS) and COG analysis on consumables for these different manufacturing processes are presented.
Figure 1. Biomanufacturing diagrams for Process A (conventional fed-batch at 1000-L scale, n = 5), Process B (intensified fed-batch by enriched N-1 at 1000-L scale, n = 8), and Process C (intensified fed-batch by perfusion N-1 at 2000-L scale, n = 3).
Results
Upstream performance
As described in the Materials and Methods section, the major upstream changes from Process A to B to C were cell line, basal and feed media, N-2 (second cell culture step prior to the production bioreactor) and N-1 (cell culture step prior to the production bioreactor) seed culture conditions, and fed-batch production bioreactor (N) conditions (e.g., SD, feeding, and temperature shift) ().
As described in the Methods section, differing N-2 seed culture conditions resulted in different N-2 final viable cell densities (VCDs), e.g., 2.5–5 × 10⁶, 6–10 × 106, and 26–42 × 106 cells/mL for Processes A, B and C, respectively. The N-2 seeds were used to inoculate the N-1 seed bioreactors using different SDs of 0.46 ± 0.09 × 10⁶ cells/mL for Process A (n = 5), 1.05 ± 0.06 × 10⁶ cells/mL (n = 8, p < .0001, compared to Process A) for Process B, and 3.74 ± 0.57 × 10⁶ cells/mL (n = 3, p < .01 compared to Process A, p = .01 compared to Process B) for Process C ()). The final VCD from the N-1 step significantly increased from 4.29 ± 0.23 × 10⁶ cells/mL for Process A using a conventional batch mode, to 14.3 ± 1.5 × 10⁶ cells/mL (p < .0001, compared to Process A) for Process B using enriched batch mode, and to 103 ± 4.6 × 10⁶ cells/mL (p < .001, compared to either Process A or Process B) for Process C using perfusion mode ()). Cell viability in the N-1 seed stage was well maintained for Processes A and B, while the cell viability for Process C dropped to about 94% in the end ()). Nonetheless, the lower final cell viability of the perfusion N-1 for Process C did not have any negative impact on the subsequent fed-batch production culture performance, as described below.
Figure 2. N-1 seed culture profiles (a) VCD; (b) cell viability and fed-batch production culture performance profiles; (c) VCD; (d) cell viability; (e) normalized titer; (f) normalized cell-specific productivity in the mAb biomanufacturing using Process A (n = 5), Process B (n = 8), and Process C (n = 3). Values are reported as average ± standard deviation.
For the fed-batch production stage, the initial SDs were intensified from 0.5 ± 0.01 × 10⁶ cells/mL for Process A, to 3.22 ± 0.11 × 10⁶ cells/mL (p < .0001, compared to Process A) for Process B, and to 16.9 ± 1.12 × 10⁶ cells/mL (p < .01, compared to either Process A or Process B) for Process C ()). The peak VCD for Process A was 9.0 ± 0.94 × 10⁶ cells/mL on day 7 and the final VCD was 4.7 ± 0.36 × 10⁶ cells/mL on day 19–20. Compared to Process A, Process B had a much higher peak VCD of 23.9 ± 0.93 × 10⁶ cells/mL (p < .0001, compared to Process A) on day 5 and a higher final VCD of 15.1 ± 0.93 × 10⁶ cells/mL (p < .0001, compared to Process A) on day 14. Among the three processes, Process C achieved the highest peak VCD of 29.3 ± 2.19 × 10⁶ cells/mL (p < .01, compared to either Process A or Process B) on day 4 and the highest final VCD at 20.2 ± 1.72 × 10⁶ cells/mL (p < .01 compared to Process A, p < .001 compared to Process B) ()). For Processes B and C, cell cultures were harvested on day 14. Process A had a longer duration with the harvest criteria of either the viability <70% or day 20, whichever was met first. For cell viability profile, both Process B and C were maintained very well above 98% (p = .36, comparing Process B and Process C) for the entire run, while for Process A, cell viability dropped to about 66% (p < .0001 compared to Process B, p < .0001 compared to Process C) toward the end of run ()). The lower cell viability for Process A may be attributed to the different CHO cell line, media, bioreactor process parameters, and harvest criteria, as described in the Methods section.
When the biomanufacturing process evolved from conventional to intensified (), the final normalized titer substantially improved from 0.12 ± 0.0 for Process A, to 0.50 ± 0.02 (p < .0001, compared to Process A) for Process B, to 1.00 ± 0.09 (p < .01 compared to Process A, p = .01 compared to Process B) for Process C ()). The normalized cell-specific productivities for Process C were maintained between 0.9 and 1.0, significantly higher than 0.66–0.76 for Process B ()). The final-normalized cell-specific productivity for Process C (0.99 ± 0.02) was significantly higher than that for Process B (0.71 ± 0.05, p < .0001, compared to Process C). Process A had similar cell-specific productivity to Process B on days 6 and 7. However, the cell-specific productivity decreased linearly thereafter, reaching a final-normalized cell-specific productivity of 0.31 ± 0.02 (p < .0001, compared to either Process B or Process C) on day 20 ()).
The substantial SD increase in fed-batch stage from Process A to B to C ()) was one of the major factors enabling the upstream process to evolve from conventional to intensified fed-batch with substantial productivity improvement. The significant increase in titer here (e)) was attributed to both higher VCD ()) and a higher cell-specific productivity ()). In addition, general fed-batch improvement strategies, such as cell line engineering, medium development, and bioreactor operation optimization, were applied in this study. The 4-fold increase in titer from Process A to B was attributed to a 6-fold increase in SD, cell line change from CHO1 with an endogenous glutamine synthetase (GS) gene to CHO2 with GS knockout (GS−/-), medium improvement, and process parameter optimizations such as temperature shift. It has been reported that CHO GS cell lines can produce higher titer after knockout of the GS genes.Citation46,Citation47 We have reported that the titer can be improved by 25% after the temperature is shifted from 36.5°C to 32.0°C using the same CHO2 and Process B for the mAb production.Citation48 The doubled titer from Process B to C was attributed mainly to the more than 5-fold increase in SD, redesigned basal and feed media, feeding more nutrients, and an earlier temperature shift. Among all these factors, the most important one was SD. The low SD at 0.5 × 10⁶ cells/mL for Process A and 3 × 10⁶ cells/mL for Process B could not achieve as high of a titer as Process C with SD at 16 × 106 cells/mL, even after intensive process development using common medium development and bioreactor optimization strategies.Citation26
Although Processes B and C had much higher VCD profiles than Process A ()), there were no major scale-up issues (laboratory data not shown) using the simple strategy with constant agitation and bottom air flow rate during the entire culture duration for Processes B and C, as described in the Methods section. Oxygen demand was <25 liters per minute (LPM) for Process B at 1000-L scale, while oxygen demand was <40 LPM for Process C at 2000-L scale. The cell viability at harvest was above 98% for Processes B and C ()). The major inhibitory metabolites (e.g., lactate, ammonium, CO2) and osmolality were maintained at relatively lower levels over the entire bioreactor duration for both Processes B and C. In contrast, lactate and osmolality for Process A were considerably higher toward the end of cell culture (). This indicated that there might be some process and scale-up issues for Process A, even at the low SD of 0.5 × 10⁶ cells/mL, which could be due to the much longer culture duration. The higher CO2 levels for Processes B and C may be due to the higher cell respiration from much higher VCD compared to Process A ()). Nonetheless, <100 mmHg CO2 has been commonly observed in large-scale cell culture processes and is generally considered to have no negative impact on cell culture, which is in agreement with another report.Citation49
Figure 3. Scale-up related metabolites and parameters: (a) lactate; (b) NH4; (c) CO2; (d) osmolality; for fed-batch production Process A (n = 3), Process B (n = 8) and Process C (n = 3). There are only triplicate data available for lactate, CO2, and osmolality out of five Process A batches, while no NH4 data available for Process A. Values are reported as average ± standard deviation.
Downstream performance and in-process quality attributes
As described in the Materials and Methods section and shown in , the major downstream changes from Process A to B to C were the operating conditions of the three-chromatography steps, i.e., Protein A, AEX and CEX, and the protein concentration of final formulated DS.
For the Protein A step, the loading capacity limit of Protein A resin 1 (PR1) used in Process A was 34 g/Lresin, but increased to 50 g/Lresin for Protein A resin 2 (PR2), which was used in Process B (both processes using batch capture mode). The loading capacity limit further increased to 75 g/Lresin for Process C using PR2 in semi-continuous 2-column MCC mode (). Flow-through mode was used for the first polishing step, AEX, for all three processes. The loading capability limit using AEX resin 1 (AR1) was 70 g/Lresin for Process A, increasing to 300–500 g/Lresin for Process B using AEX resin 2 (AR2), and 200–500 g/Lresin for Process C also using AR2 (). The decision to use resin-based AEX instead of an AEX membrane absorber was driven primarily by technical considerations to address a unique product quality challenge, where AR2 in an optimized flow-through operating condition offered superior performance. The loading capability for the second polishing step, CEX, was 60 g/Lresin operated in bind-elute mode for Process A, but increased to 125–250 g/Lresin using the same CEX resin (CR) when operated in flow-through mode for Processes B and C. Batch operation of the two polishing steps was used for Processes A and B, while integrated AEX-CEX operation with inline pH adjustment was applied to Process C (). In addition, the final formulated DS concentration increased from 20 g/L for Process A to 100 g/L for Processes B and C ().
Depending on the specific conditions used (e.g., load concentration, column size, number of cycles, flow rate), the change from Protein A batch capture for Process B to MCC for Process C led to a 19–52% increase in productivity, a 51–53% increase in resin utilization, a 70–77% decrease in buffer consumption, and an 80% decrease in resin volume. At the same time, the change from batch polishing steps to integrated AEX-CEX operation resulted in an approximately 50% reduction in processing time, and eliminated the need for holding the intermediate AEX pool and additional offline CEX load adjustments, contributing to savings in time and tank/bag usage.
Overall downstream performance was similar between Processes A and B with only minor differences in certain downstream steps considering batch-to-batch and assay variations (). The slightly lower downstream yield for Process C (66 ± 3%, p < .05, compared to either Process A or Process B) than that for Process A (76 ± 5%) and Process B (75 ± 4%, p = .78, compared to Process A) were mainly associated with the two chromatography steps (i.e., MCC, and integrated AEX-CEX). A detailed analysis concluded that the lower yields were not due to the Process C conditions used, but rather due to operation-related reasons during the start-up of the new manufacturing facility where Process C was run. For example, feedback control of pumps with equipped flowmeters required further tuning in order to more accurately dispense load material across column operations. This contributed slightly to lower process yields, with small amounts of feed material being directed to the equipment drain each time a pump was slowed down. Additionally, equipment dead volumes were not accurately determined for new systems, causing column eluate pools to be truncated, and hence lower in volume than intended. These contributing factors were just two that were assessed, and have allowed for more accurate fine-tuning of the automation and distributed control system used for the new manufacturing process. With facility experience and optimization of equipment operating parameters, both MCC and integrated AEX-CEX steps of Process C should achieve the step yield comparable to batch Protein A and the individual polishing steps, as confirmed by small-scale runs in the same conditions (data not shown).
Figure 4. Product yields at different downstream steps in the mAb biomanufacturing using Process A (n = 5), Process B (n = 8), and Process C (n = 3). Values are reported as average ± standard deviation. N/A, not applicable.
The main objective for downstream purification is to remove process and product-related impurities. As shown in , regardless of batch, continuous, or integrated mode, the chromatography steps for all processes were able to remove high molecular weight (HMW) species, host cell proteins (HCP), DNA, and residual Protein A (rProA) to acceptable levels according to the DS specifications. In general, impurity levels at the final ultrafiltration/diafiltration (UF/DF) step were slightly lower for Processes B and C compared to Process A. Notably, despite increasing upstream VCD profiles from Process A to B to C ()), the impurity profiles for the intensified Process C were reliably controlled to be similar to or below that for Processes A and B ().
Figure 5. In-process quality attributes: (a) HMW; (b) HCP; (c) DNA; (d) rProA; at different downstream steps in the mAb biomanufacturing using Process A (n = 3), Process B (n = 3), and Process C (n = 3). *Below detection limit. Values are reported as average ± standard deviation.
Quality attributes for final formulated DS
Charge variant profiles classified as main peak and acidic species (expressed in percentages) are critical quality attributes in the release specifications for final DS. The main peak for final DS batches from Process B (68.0 ± 1.3%) and Process C (69.4 ± 2.6%) were similar (p = .33, comparing Process B and C), and significantly higher than that from Process A at 53.4 ± 2.7% (p < .0001 compared to Process B, p < .001 compared to Process C) (). The acidic species for final DS batches exhibited a slight, but still statistically significant decrease from Process B (24.1 ± 0.7%) to Process C (21.1 ± 0.8%, p < .001 compared to Process B). The Process B and Process C acid species were much lower than that for Process A at 43.0 ± 2.9% (p < .001 compared to Process B, p < .0001 compared to Process C) (). Even though DS batches produced from all three processes met the acceptance criteria for charge variants, Processes B and C have more charge homogeneity than Process A. Unlike the main peak and acidic species, levels for the basic species are not included in the product release specifications, but still monitored as report results only. Although there was an increasing trend from Process A (3.6 ± 0.5%) to Process B (7.9 ± 1.1%, p < .0001, compared to Process A) to Process C (9.5 ± 3.0%, p = .11 compared to Process A, p = .53 compared to Process B), the trend was not consistently statistically significant. Furthermore, basic species from all three processes were considered acceptably low (). Further protein characterization indicated that the basic species were mainly caused by C-terminal variants, which are not a critical quality attribute for this product (data not shown). Therefore, the increase in basic species from Process A to B to C was concluded to be acceptable.
Figure 6. Quality attributes (charge variant species, N-linked glycans, SEC impurities and ELISA potency) for final DS batches manufactured with Process A (n = 5), Process B (n = 8), and Process C (n = 3). Values are reported as average ± standard deviation.
For N-linked glycans, G0F was predominant for Process A (72.3 ± 1.8%), B (76.0 ± 5.8%, p = .16, compared to Process A) and C (77.0 ± 0.5%, p < .01 compared to Process A, p = .66 compared to Process B). A statistically significant difference was detected for G0 F between Process A and Process C. However, the 4.7% difference in average G0F is not expected to have a meaningful impact on product quality. G0 levels for Process A (5.9 ± 0.2%), B (5.0 ± 0.6%, p < .01 compared to Process A) and C (5.7 ± 0.2%, p = .18 compared to Process A, p = .15 compared to Process B) were also similar, as the range was less than 1% (). There was a decreasing trend in G1F from Process A (15.8 ± 1.4%) to B (12.6 ± 4.8%, p = .13 compared to Process A) to C (5.7 ± 0.6%, p < .0001 compared to Process A, p < .01 compared to Process B). There was also a decreasing trend in G2F from Process A (1.3 ± 0.2%) to B (0.8 ± 0.5%, p = .13 compared to Process A) to C (0.3 ± 0.0%, p < .001 compared to Process A, p = .051 compared to Process B). In addition, Man5 increased from Process A (0.9 ± 0.0%) to B (1.6 ± 0.2%, p < .0001 compared to Process A) to C (3.8 ± 0.2%, p < .01 compared to Process A, p < .0001 compared to Process B) (). However, there were no new N-linked glycan species identified with the process changes. G1F (<16%), G2F (<2%), and Man5 (<4%) are low in abundance for all three processes. Goetze et al. reported that mAbs with non-Man5 and 5% Man5 exhibited little difference in half-life in human.Citation50 It should be noted that Man5, G1F, and G2F are not expected to have any effect on the mechanism of action, as antibody-dependent cell-mediated cytotoxicity and complement-dependent cytotoxicity are not involved for this specific mAb. Therefore, changes in glycosylation species for different processes were not expected to affect half-life for this mAb, and N-linked glycan profiles were considered acceptable for process changes from Process A to B to C.
Product purity determined by size exclusion chromatography (SEC) from Process B (99.1 ± 0.1%) and Process C (99.1 ± 0.0%) were similar (p = .33, comparing Process B and Process C), and statistically higher than that from Process A (98.2 ± 0.4%, p < .01 compared to Process B, p = .01 compared to Process C). However, the range for average monomer values (98.2–99.1) indicates that all three processes were similar (). The level of HMW species did not vary significantly between Process A (1.4 ± 0.5%), Process B (0.8 ± 0.1%, p = .06, compared to Process A), and Process C (0.9 ± 0.0%, p = .09 compared to Process A, p = .06 compared to Process B). The level of LMW species was very low among the different processes (<0.2%), and was below the limit of quantitation for several Process A and Process C clinical manufacturing batches. This precludes a thorough statistical comparison. However, the level of LMW species can be considered comparable and low for all processes from the standpoint of product purity.
Potencies as determined by enzyme-linked immunosorbent assay (ELISA) were similar for Process A (102 ± 5.8%), B (96 ± 7.5%), and C (108 ± 3.1%) (). In addition, HCP, DNA, and rProA in final-formulated DS batches by the three different processes were all low and well under the acceptance criteria (). These analytical comparability results support the conclusion that quality attributes conformed to the acceptance criteria in the specifications for DS manufactured by Processes A, B, and C were comparable.
Biomanufacturing COG analysis
To illustrate the benefits for these productivity improvements on process economics, a COG analysis was performed to compare upstream and downstream costs per gram of final DS for Processes A, B, and C. It should be noted that, to compare the benefits of operational efficiency, this COG analysis only considered consumable costs (), while excluding other factors such as capital investment, labor, plant utilities, and validation.
Table 1. Assumptions for COG Analysis.
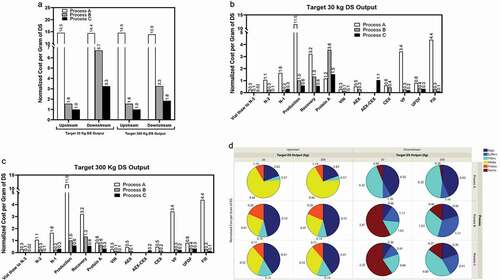
Both the upstream and downstream COG were reduced substantially due to this process evolution and intensification, with the most significant decrease seen from Process A to B ()). Upstream COG reductions were mainly attributed to a more than 4-fold titer increase and more than 2-fold media cost reduction from Process A to B and an additional 2-fold titer increase from Process B to C ()). Downstream COG reductions were mainly attributed to substantially higher bioreactor batch output by increased upstream titer, a more streamlined and intensified chromatography process, higher viral filter loadings, and a 5-fold higher DS concentration. This analysis also showed that upstream COG was independent of the total DS output targets (i.e., 30 kg and 300 kg) for a given manufacturing scale (2000-L in this case), whereas the downstream COG became more favorable for commercial manufacturing than for clinical manufacturing because the resin cost is reduced by its distribution over more batches. Overall, the upstream COG and downstream COG were at approximately a 1:1 ratio for Process A. For the intensified Processes B and C, the upstream COG reduced more significantly than the downstream COG, with a relative ratio of 1:3.3–1:4.2 for clinical manufacturing, and 1:1.6–1:2.1 for commercial manufacturing. The cost breakdown in –d) shows a detailed comparison of different consumables for upstream/downstream unit operations and provides useful insights into the evolution of biomanufacturing supported by rational analysis of process economics.
Figure 7. Consumables (resins, filters, bags, media, buffers, and probes) costs for Process A, Process B, and Process C assumed to be all at 2000-L bioreactor scale: (a) upstream and downstream; step costs for (b) 30 kg and (c) 300 kg DS output, respectively; (d) breakdown cost.
Discussion
This case study is the first report of a hybrid, intensified biomanufacturing process (e.g., Process C) for mAb production successfully implemented at the 2000-L scale. The final manufacturing process includes upstream fed-batch intensification utilizing N-1 perfusionCitation26 and downstream intensification by MCC Protein A captureCitation33,Citation51 and integrated AEX-CEX polishing steps.Citation52 Process C achieved much higher upstream titer on par with the best fed-batch titer reported in literatureCitation27,Citation53,Citation54 and greater downstream productivity than the original Process A (conventional manufacturing scheme). In addition to common upstream titer improvement strategies, e.g., cell line engineering, medium development, and process parameter optimization, increasing SDs by enriched N-1 seed culture (Process B) and perfusion N-1 (Process C) all played critical roles. It should also be noted that, although Process C achieved about 100 × 106 cells/mL at N-1 step with perfusion process and much higher peak VCD at fed-batch production compared to Processes A and B, oxygen demand of the high-cell-density culture at manufacturing scale can be easily met by simply sparging pure oxygen by cascade control under constant agitation, while maintaining constant air sparging for CO2 stripping.
For the downstream part of the process, the main differences between conventional Process A and streamlined Process B include Protein A resin change from PR1 to PR2, AEX resin change from AR1 to AR2, and CEX change from bind-elute to flow-through operation. These downstream changes resulted in significant increases in resin binding capacity and throughput. Furthermore, the MCC Protein A step of Process C significantly increased capture productivity, and decreased buffer consumption and resin volume, while the integrated AEX-CEX operation effectively reduced processing times and eliminated the need for intermediate pooling and load adjustment steps that were required for batch AEX and CEX steps.
Although substantial upstream titer ()) and downstream productivity increases were achieved by process changes from Process A to B to C, the quality attributes for the final DS batches manufactured by all three processes were comparable (). As presented in the Results section, most of the quality attributes were similar if not better, and the differences of other quality attributes were deemed acceptable among the three processes. It has been reported in the literature that high titer processes achieved by process intensification with increased VCD resulted in higher impurities such as HCP.Citation8,Citation55 In this report, we demonstrated that the standard three-chromatography downstream steps, either batch (Processes A and B) or semi-continuous scheme (Process C), were able to achieve satisfactory impurity removal (). Previous studies on the viral clearance capability of continuous chromatography have shown that alternate modes of capture do not affect this capability of viral removal.Citation56,Citation57 The AEX step in these processes remains unchanged in how load material is applied (i.e., directly from an intermediate pool, and not directly from a prior column eluate), and so its viral removal capability would not differ for this robust viral clearance step. Therefore, quality attributes can be reliably controlled for intensified fed-batch manufacturing processes.
In conclusion, the case study presented here for the evolution of a fed-batch process from conventional to a hybrid, intensified processing scheme was achieved with substantial titer improvement by intensified seed culture strategies applied to upstream steps and significant improvement of resin binding capacity, productivity, and throughput by continuous or semi-continuous chromatography operations in downstream steps. The intensified processes were robust and successfully scaled up in clinical manufacturing with significant COG reduction. The in-process and final DS quality attributes were comparable for different processes.
Materials and methods
Three different biomanufacturing Processes, A, B, and C were used for the same mAb production in different GMP facilities, as summarized in . Process A was the first process used in biomanufacturing for DS supply for a Phase 1 clinical trial. To improve manufacturing efficiency, Process A was replaced by Process B, and then by Process C (). Proprietary chemically defined seed expansion, basal, and feed media were used with increased nutrient concentrations to accommodate the increasingly higher SD from Process A to B to C. Additional process details are described in detail below.
Upstream
For Process A, the recombinant CHO cell line (CHO1), which has the endogenous GS gene and was engineered by using GS as selectable marker, was used for vial thaw and seed expansion in a chemically defined basal medium B1. Cells were passaged every 3–4 days prior to N-2 seed. N-2 batch seed culture was run in a 50-L wave bioreactor (GE Healthcare) with a 25 L working volume and a SD of 0.4 × 10⁶ cells/mL. Temperature was set to 36.5°C. Rocking speed was controlled at 20 rpm with a 6° rocking angle. Air and CO2 gas flow rates were properly controlled to ensure good cell growth with a final VCD targeted at 2.5–5 × 10⁶ cells/mL and cell viability at >90% on day 3–4. N-1 batch seed culture was run in a 250-L disposable single-use bioreactor (Thermo Fisher Scientific) with a 130 L working volume and a SD of 0.4 × 10⁶ cells/mL. Temperature was maintained at 36.5°C. pH was set to 7.0 and was controlled using either carbon dioxide sparge or sodium carbonate addition. Dissolved oxygen was set to 30%. A final VCD was targeted at 2.5–5 × 10⁶ cells/mL and cell viability at >90% on day 3–4. A conventional fed-batch production (Process A) was run in 1000-L disposable single-use bioreactor (Thermo Fisher Scientific) with an initial 580 L working volume including B1 basal medium and a SD of 0.5 × 10⁶ cells/mL. Temperature was maintained at 36.5°C for the entire duration. pH was set to 7.0 and was controlled via carbon dioxide or sodium carbonate addition, as needed. Agitation was set to 60 rpm. Dissolved oxygen was set to 30% by cascade control of oxygen. Top air, bottom air, and nitrogen were applied to control CO2 below 100 mmHg during the run. A proprietary feed F1 was initiated from day 3 and was fed daily by a single bolus addition for the run duration. The cell culture was harvested with about 970 L final volume by depth filtration on day 20 post inoculation or when cell viability dropped to below 70%, whichever condition was met first. The harvested bulk was then clarified by 0.22 µm filtration.
For Process B, the recombinant CHO cell line (CHO2) with GS knockout (GS−/-), was used for vial thaw and seed expansion in a chemically defined basal medium B2. Cells were passaged every 3 days prior to N-2 seed inoculation. The N-2 batch seed culture was run in a 50-L wave bioreactor (GE Healthcare) with a 25 L working volume and a SD of 0.7 × 10⁶ cells/mL. Temperature was set to 36.5°C. Rocking speed was controlled at 26 rpm with a 7° rocking angle. Air and CO2 gas flow rates were properly controlled to ensure good cell growth with a final VCD targeted at 6–10 × 106 cells/mL and cell viability at >90% on day 3. The N-1 batch seed culture was run in a 200-L disposable bioreactor (Xcellerex, GE Healthcare) with a 200 L working volume including an enriched B2 basal medium and a SD of 1.0 × 10⁶ cells/mL. Temperature was maintained at 36.5°C. pH was set to 7.2 and was controlled using either carbon dioxide sparge or sodium carbonate addition, as needed. Agitation was set to 100 rpm. Dissolved oxygen was set to 40%. A final VCD was targeted at 12–18 × 106 cells/mL and cell viability at >90% on day 4. An intensified fed-batch production (Process B) inoculated with the enriched N-1 seed was run in a 1000-L disposable bioreactor (Xcellerex, GE Healthcare) with 700 L initial working volume containing the enriched B2 basal medium and with a SD of 3 × 10⁶ cells/mL. Temperature was initiated at 36.5ºC with a temperature shift to 32.0ºC from day 5 on. pH was set to 7.2 and controlled using carbon dioxide sparge or sodium carbonate addition, as needed. Agitation was set to 90 rpm. Top air was set to 6 LPM, while bottom air was set to 3 LPM. Dissolved oxygen was set to 40% by cascade control of oxygen. A proprietary feed F2 was initiated from day 4 and was fed daily by a single bolus addition for the rest of the duration. The cell culture was harvested with about 900 L final volume by depth filtration on day 14 post inoculation. The harvested bulk was then clarified by 0.22 µm filtration.
For Process C, the same CHO2 (GS−/-) cell line was used for vial thaw and seed expansion in the B2 basal medium. Cells were passaged every 3 days prior to N-2 seed inoculation. N-2 perfusion seed culture was run in a 50-L wave bioreactor (GE Healthcare) with a 25 L working volume containing the B2 basal medium and a SD of 2.3 × 10⁶ cells/mL. The perfusion wave bioreactor was equipped with a 0.2-µm filter to remove the spent culture medium while retaining the cells. Perfusion was initiated on day 1 with fresh B2 medium continuously added (media-in) and spent culture medium withdrawn (media-out) at the same rate through peristaltic pumps for media exchange. The perfusion rate was controlled in the step-wise mode with 0.5 vessel volume per day (VVD) from day 1 to day 3 and 1 VVD from day 3 to day 4. Temperature was set to 36.5°C. Rocking speed was controlled at 28 rpm with a 7° rocking angle. Air and CO2 gas flow rates were properly controlled to ensure good cell growth with a final VCD targeted at 26–42 × 106 cells/mL and cell viability at >90% on day 4. N-1 perfusion seed culture was run in a 500-L disposable bioreactor (Xcellerex, GE Healthcare) with a 195 L working volume containing the B2 medium and with a SD of 3.3 × 10⁶ cells/mL. A single-use XCELLTM ATF 6 unit (Repligen) was connected to the 500-L bioreactor to perfuse the culture. Fresh B2 medium was continuously added while spent culture medium was continuously removed at the same rate. Perfusion rate, started on day 1 at 0.04 nL/cell/day, was controlled as a function of VCD as measured by an online capacitance probe (Hamilton). Temperature was maintained at 36.5°C. pH was set to 7.2 and controlled via carbon dioxide or sodium carbonate addition, as needed. Agitation was set to 100 rpm. Air overlay was set to 2.9 LPM, while bottom air was set to 1.0 LPM. Dissolved oxygen was set to 40% by cascade control of oxygen. A final VCD was targeted at 90–120 × 106 cells/mL with >90% cell viability on day 6. An intensified fed-batch production (Process C) inoculated with the perfusion N-1 seed was run in a 2000-L disposable bioreactor (Xcellerex, GE Healthcare) with an initial 1210 L working volume containing a B3 basal medium and with a SD of 16 × 106 cells/mL. Temperature was initiated at 36.5°C with a temperature shift to 32.0°C from day 3 on. pH was set to 7.2 and controlled via carbon dioxide or sodium carbonate addition, as needed. Agitation was set to 90 rpm. Air overlay was set to 13.3 LPM, while bottom air was set to 25 LPM. Dissolved oxygen was set to 40% by cascade control of oxygen. A proprietary feed F3 was initiated from day 2 and fed daily by a single bolus addition for the rest of the duration. The cell culture was harvested with about 1800 L final volume by depth filtration on day 14 post inoculation. The harvested bulk was then clarified by 0.22 µm filtration.
In-process cell culture assays were performed as follows. Cell culture broth was sampled from the bioreactor daily and was directly analyzed for gases, cell count, nutrients, and metabolites. Offline pH, pCO2, and pO2 were measured using a BioProfile pHOx analyzer (Nova Biomedical). VCD and cell viability were quantified off-line using a Vi-CELL XR automatic cell counter (Beckman Coulter). Glucose, glutamine, glutamate, lactate, and ammonia were quantified using a BioProfile FLEX analyzer (Nova Biomedical).
Titer was analyzed using a Protein A UPLC method. The normalized titer, expressed as normalized weight/L, is equal to the true titer (g/L) at each time point divided by the average titer of Process C on day 14. Standard deviations were calculated based on the original titer values. The standard deviations were then normalized by the same factor as the titer values. Cell-specific productivity (normalized weight/cell/day) was calculated based on the true titer at each time point divided by the integrated VCD at the same time point. These values were then normalized to the maximum daily cell-specific productivity observed for Process C. Standard deviations were calculated based on the original cell-specific productivity values. The standard deviations were then normalized by the same factor as the cell-specific productivity values.
Downstream
For Process A, Protein A chromatography was performed for the primary capture step using PR1 with a maximum loading capacity of 34 g/Lresin. A 14-L column was used to process approximately 1000 L of harvested cell culture fluid over 4 cycles. Protein A eluate was pooled and held at low pH in order to inactivate enveloped viruses, and then neutralized to an intermediate pH. Depth filtration was performed on the neutralized pool in order to remove insoluble particulates that formed due to isoelectric precipitation. AEX (AR1) and CEX (CR) were then performed in sequence with maximum loadings of 70 g/Lresin and 60 g/Lresin, respectively. AEX was performed in a flow-through mode, allowing for capture of trace impurities while the product was pooled and CEX was operated in a bind-elute mode. A total of two cycles for each AEX and CEX steps were required to process the Protein A viral-inactivated pool using a 14-L column for each step. Viral filtration was performed on the CEX pool, followed by UF/DF in order to achieve a final DS concentration of 20 g/L. Final formulation and fill completed the downstream process for DS before packaging and shipment.
For Process B, the downstream process was mainly the same as above. However, there were two main changes to the chromatography materials that were used for the Protein A and AEX steps. PR2 was utilized to increase the protein loading for the Protein A step from a maximum of 34 to 50 g/Lresin. This allowed for the same throughput of product over two cycles of Protein A chromatography versus the four that were required in Process A, greatly reducing the cadence of the capture step. Due to the larger product output from the upstream part of Process B, a single Protein A column was packed to a 71 L total volume. AR2 was used to replace AR1, which allowed for an increase in the maximum loading capacity from 70 to 500 g/Lresin while still operating in flow-through mode. A single 18-L AEX column was used to process the Protein A viral-inactivated pool in a single cycle per batch due to the increased loading capacity. Additionally, the mode of operation of the CEX column was changed from bind-elute to flow-through mode. This allowed for an increase in maximum loading capacity from 60 to 250 g/Lresin, in which the AEX pool could be processed in one cycle with a 31-L CEX column. Viral filtration was performed on the CEX pool, followed by UF/DF in order to achieve a final DS concentration of 100 g/L.
For Process C, the downstream process had two more major changes over Process B: (1) Two columns of size between 13.8 and 15.7 L packed with PR2 resin were used in the Protein A step in cyclic mode for a maximum of 75 g/Lresin to process approximately 2000 L of harvested cell culture fluid. This resulted in a significant reduction of resin cost, but a similar or slightly better productivity compared to the Protein A step of Process B. (2) In the polishing step, a 34-L AR2 column was linked with a 58-L CR column in flow-through mode, which allowed for a loading capacity of maximum 500 g/Lresin for AEX and maximum 250 g/Lresin for CEX. This integrated AEX-CEX step processed the Protein A viral-inactivated pool in a single cycle per batch, while reducing the processing time by almost half, saving human labor, as well as facility occupation time.
Quality attribute assays
Similar methods as described in our previous reportCitation18 were used for in-process quality attributes. Prior to in-process quality measurements, the supernatant samples were purified by Protein A chromatography. These samples were then run for several in-process tests as follows. The HCP and rProA analyses were performed using CHO HCP ELISA Kit, 3 G, and Protein A ELISA Kits, respectively, following manufacturer (Cygnus Technologies) protocols. DNA analysis was performed using 7500 fast real-time PCR system (Thermo Scientific) with DNA standard generated from Bristol-Myers Squibb proprietary cell line and molecular weight heterogeneity by SEC.
In order to confirm the quality of DS, the following methods were used.Citation18 The percent area of the charge variant species (acidic, main, and basic) were measured by imaged capillary isoelectric focusing. N-glycan profiles (e.g., G0, G0 F, G1 F, G2 F, and Man5) were measured using a commercially available RapiFluor-MS N-Glycan kit from Waters. SEC was used to measure percent areas for main (monomeric), HMW and LMW species. Potency of the final DS was measured by a molecule-specific ELISA method.
COG analysis
The COG analysis for manufacturing focused primarily on consumables (e.g., media, resins, buffers, filters, probes, and bags) (). For the purpose of objective comparison, the production bioreactor for all three processes was assumed to be at 2000-L scale, as used in Process C. All upstream and downstream equipment and consumables were properly adjusted for Processes A and B, for which GMP manufacturing was performed at 1000-L scale. To adjust Process A and Process B to the 2000-L production scale, a process model was built based on the 1000-L manufacturing data. Scale-independent process parameters (e.g., titer and yield) were based on the 1000-L scale processes. The upstream titer and downstream step yield of each unit operation used in the COG analysis was based on the actual GMP manufacturing average for the three processes individually. Scale-dependent consumables (e.g., media, probes, buffers, bags, filters, and resins) were adjusted accordingly to maintain operational similarity between the two scales. Specifically, media, buffer, and resin consumables were calculated based on their ratios to initial production volume. Filter, probe, and bag costs were calculated based on the sizes and quantities outlined in the process model.
The total DS output was assumed as 30 kg for clinical manufacturing and 300 kg for commercial manufacturing with the same assumptions of 2000-L scale, upstream titer, and downstream step yield (). All of the upstream process step consumables were determined to be single use for both clinical and commercial manufacturing. For the clinical manufacturing scenario, a single campaign is performed to produce 30 kg DS with resins and UF/DF filters only being reused within the campaign. For the commercial manufacturing scenario, targeting 300 kg DS, reusable resins, and UF/DF filters are replaced when the maximum cycles defined in are reached. Thus, the analysis assumes the total upstream COG is equivalent for commercial and clinical manufacturing, while the downstream COG varies depending on the manufacturing campaign scenario. Consumables costs were added together to calculate the total cost of each step for a single batch of Processes A, B, and C. The COG for each process or each step were then normalized to the Process C total upstream (vial thaw through production bioreactor) COG to produce .
Statistical analysis
Unless otherwise noted, data presented in the figures are sample means with standard deviations. Student’s t-test analysis was performed using JMP software with the significance level set at p value < .05.
Disclosure of potential conflicts of interest
No potential conflicts of interest were disclosed.
Abbreviations
Acknowledgments
Thanks to our colleagues from Process Development Upstream, Downstream, Analytical, Scale-Up Lab, and Clinical Manufacturing Facilities for supporting this study at Bristol-Myers Squibb.
References
- Rader RA, Langer ES. 30 years of upstream productivity improvements. Bioprocess Int. 2015;13. https://bioprocessintl.com/upstream-processing/expression-platforms/30-years-upstream-productivity-improvements/.
- Xu J, Rehmann MS, Xu X, Huang C, Tian J, Qian NX, Li ZJ. Improving titer while maintaining quality of final formulated drug substance via optimization of CHO cell culture conditions in low-iron chemically defined media. mAbs. 2018;10:488–13. doi:https://doi.org/10.1080/19420862.2018.1433978.
- Xu J, Tang P, Yongky A, Drew B, Borys MC, Liu S, Li ZJ. Systematic development of temperature shift strategies for Chinese hamster ovary cells based on short duration cultures and kinetic modeling. mAbs. 2019;11:191–204. doi:https://doi.org/10.1080/19420862.2018.1525262.
- Li F, Vijayasankaran N, Shen AY, Kiss R, Amanullah A. Cell culture processes for monoclonal antibody production. mAbs. 2010;2:466–77. doi:https://doi.org/10.4161/mabs.2.5.12720.
- Wurm FM. Production of recombinant protein therapeutics in cultivated mammalian cells. Nat Biotechnol. 2004;22:1393–98. doi:https://doi.org/10.1038/nbt1026.
- Rader RA. Current challenges in bioprocesses development. Pharm Technol Eur. 2018;30:12–13.
- Godawat R, Konstantinov K, Rohani M, Warikoo V. End-to-end integrated fully continuous production of recombinant monoclonal antibodies. J Biotechnol. 2015;213:13–19. doi:https://doi.org/10.1016/j.jbiotec.2015.06.393.
- Strube J, Ditz R, Kornecki M, Huter M, Schmidt A, Thiess H, Zobel-Roos S. Process intensification in biologics manufacturing. Chem Eng Process. 2018;133:278–93. doi:https://doi.org/10.1016/j.cep.2018.09.022.
- Bielser JM, Wolf M, Souquet J, Broly H, Morbidelli M. Perfusion mammalian cell culture for recombinant protein manufacturing – A critical review. Biotechnol Adv. 2018;36:1328–40. doi:https://doi.org/10.1016/j.biotechadv.2018.04.011.
- Pleitt K, Somasundaram B, Johnson B, Shave E, Lua LHL. Evaluation of process simulation as a decisional tool for biopharmaceutical contract development and manufacturing organizations. Biochem Eng J. 2019;150. DOI:https://doi.org/10.1016/j.bej.2019.107252.
- Gomez N, Lull J, Yang X, Wang Y, Zhang X, Wieczorek A, Harrahy J, Pritchard M, Cano DM, Shearer M. Improving product quality and productivity of bispecific molecules through the application of continuous perfusion principles. Biotechnol Prog. 2020. (In press). doi:https://doi.org/10.1002/btpr.2973.
- Moulijn JA, Stankiewicz A. Process intensification. In: Encyclopedia of sustainable technologies. Elsevier; 2017. p. 509–18.
- Stankiewicz AI, Moulijn JA. Process intensification: transforming chemical engineering. Chem Eng Prog. 2000;96:22–33.
- Chotteau V, Zhang Y, Clincke MF. Very high cell density in perfusion of CHO cells by ATF, TFF, wave bioreactor, and/or celltank technologies - impact of cell density and applications. In: Subramanian G, editor. Continuous processing in pharmaceutical manufacturing. Wiley Blackwell; 2015. p. 339–56. DOI: https://doi.org/10.1002/9783527673681.ch13.
- Voisard D, Meuwly F, Ruffieux PA, Baer G, Kadouri A. Potential of cell retention techniques for large-scale high-density perfusion culture of suspended mammalian cells. Biotechnol Bioeng. 2003;82:751–65. doi:https://doi.org/10.1002/bit.10629.
- Kelley B, Kiss R, Laird M. A different perspective: how much innovation is really needed for monoclonal antibody production using mammalian cell technology? Adv Biochem Eng/Biotechnol. 2018;165:443–462. DOI:https://doi.org/10.1007/10_2018_59.
- Croughan MS, Konstantinov KB, Cooney C. The future of industrial bioprocessing: batch or continuous? Biotechnol Bioeng. 2015;112:648–51. doi:https://doi.org/10.1002/bit.25529.
- Yongky A, Xu J, Tian J, Oliveira C, Zhao J, McFarland K, Borys MC, Li ZJ. Process intensification in fed-batch production bioreactors using non-perfusion seed cultures. mAbs. 2019;11:1502–14. doi:https://doi.org/10.1080/19420862.2019.1652075.
- Warikoo V, Godawat R, Brower K, Jain S, Cummings D, Simons E, Johnson T, Walther J, Yu M, Wright B. Integrated continuous production of recombinant therapeutic proteins. Biotechnol Bioeng. 2012;109(12):3018–29. doi:https://doi.org/10.1002/bit.24584.
- Vogel JH, Nguyen H, Giovannini R, Ignowski J, Garger S, Salgotra A, Tom J. A new large-scale manufacturing platform for complex biopharmaceuticals. Biotechnol Bioeng. 2012;109(12):3049–58. doi:https://doi.org/10.1002/bit.24578.
- Yang WC, Lu J, Kwiatkowski C, Yuan H, Kshirsagar R, Ryll T, Huang Y-M. Perfusion seed cultures improve biopharmaceutical fed-batch production capacity and product quality. Biotechnol Prog. 2014;30:616–25. doi:https://doi.org/10.1002/btpr.1884.
- Padawer I, Ling WLW, Bai Y. Case study: an accelerated 8-day monoclonal antibody production process based on high seeding densities. Biotechnol Prog. 2013;29:829–32. doi:https://doi.org/10.1002/btpr.1719.
- Pohlscheidt M, Jacobs M, Wolf S, Thiele J, Jockwer A, Gabelsberger J, Jenzsch M, Tebbe H, Burg J. Optimizing capacity utilization by large scale 3000 L perfusion in seed train bioreactors. Biotechnol Prog. 2013;29:222–29. doi:https://doi.org/10.1002/btpr.1672.
- Jordan M, Mac Kinnon N, Monchois V, Stettler M, Broly H. Intensification of large-scale cell culture processes. Curr Opin Chem Eng. 2018;22:253–57. doi:https://doi.org/10.1016/j.coche.2018.11.008.
- Woodgate JM. Perfusion N-1 culture-opportunities for process intensification. Biopharmaceutical processing: development, design, and implementation of manufacturing processes. Elsevier; 2018. p. 755–68. DOI:https://doi.org/10.1016/B978-0-08-100623-8.00037-2.
- Xu J, Rehmann MS, Xu M, Zheng S, Hill C, He Q, Borys MC, Li ZJ. Development of an intensified fed-batch production platform with doubled titers using N-1 perfusion seed for cell culture manufacturing. Bioresources Bioprocess. 2020;7(1):17. doi:https://doi.org/10.1186/s40643-020-00304-y.
- Huang YM, Hu W, Rustandi E, Chang K, Yusuf-Makagiansar H, Ryll T. Maximizing productivity of CHO cell-based fed-batch culture using chemically defined media conditions and typical manufacturing equipment. Biotechnol Prog. 2010;26:1400–10. doi:https://doi.org/10.1002/btpr.436.
- Ghose S, Zhang J, Conley L, Caple R, Williams KP, Cecchini D. Maximizing binding capacity for protein A chromatography. Biotechnol Prog. 2014;30:1335–40. doi:https://doi.org/10.1002/btpr.1980.
- Pabst TM, Thai J, Hunter AK. Evaluation of recent Protein A stationary phase innovations for capture of biotherapeutics. J Chromatogr A. 2018;1554:45–60. doi:https://doi.org/10.1016/j.chroma.2018.03.060.
- Zhang J, Conley L, Pieracci J, Ghose S. Pool-less processing to streamline downstream purification of monoclonal antibodies. Eng Life Sci. 2017;17:117–24. doi:https://doi.org/10.1002/elsc.201600104.
- Godawat R, Brower K, Jain S, Konstantinov K, Riske F, Warikoo V. Periodic counter-current chromatography - design and operational considerations for integrated and continuous purification of proteins. Biotechnol J. 2012;7:1496–508. doi:https://doi.org/10.1002/biot.201200068.
- Pollock J, Bolton G, Coffman J, Ho SV, Bracewell DG, Farid SS. Optimising the design and operation of semi-continuous affinity chromatography for clinical and commercial manufacture. J Chromatogr A. 2013;1284:17–27. doi:https://doi.org/10.1016/j.chroma.2013.01.082.
- Angarita M, Müller-Späth T, Baur D, Lievrouw R, Lissens G, Morbidelli M. Twin-column CaptureSMB: A novel cyclic process for protein A affinity chromatography. J Chromatogr A. 2015;1389:85–95. doi:https://doi.org/10.1016/j.chroma.2015.02.046.
- Khanal O, Kumar V, Westerberg K, Schlegel F, Lenhoff AM. Multi-column displacement chromatography for separation of charge variants of monoclonal antibodies. J Chromatogr A. 2019;1586:40–51. doi:https://doi.org/10.1016/j.chroma.2018.11.074.
- Orozco R, Godfrey S, Coffman J, Amarikwa L, Parker S, Hernandez L, Wachuku C, Mai B, Song B, Hoskatti S. Design, construction, and optimization of a novel, modular, and scalable incubation chamber for continuous viral inactivation. Biotechnol Prog. 2017;33:954–65. doi:https://doi.org/10.1002/btpr.2442.
- Gillespie C, Holstein M, Mullin L, Cotoni K, Tuccelli R, Caulmare J, Greenhalgh P. Continuous In-Line Virus Inactivation for Next Generation Bioprocessing. Biotechnol J. 2019;14(2):1700718. doi:https://doi.org/10.1002/biot.201700718.
- David L, Maiser B, Lobedann M, Schwan P, Lasse M, Ruppach H, Schembecker G. Virus study for continuous low pH viral inactivation inside a coiled flow inverter. Biotechnol Bioeng. 2019;116(4):857–69. doi:https://doi.org/10.1002/bit.26872.
- Rucker-Pezzini J, Arnold L, Hill-Byrne K, Sharp T, Avazhanskiy M, Forespring C. Single pass diafiltration integrated into a fully continuous mAb purification process. Biotechnol Bioeng. 2018;115:1949–57. doi:https://doi.org/10.1002/bit.26708.
- David L, Niklas J, Budde B, Lobedann M, Schembecker G. Continuous viral filtration for the production of monoclonal antibodies. Chem Eng Res Des. 2019;152:336–47. doi:https://doi.org/10.1016/j.cherd.2019.09.040.
- Baur D, Angarita M, Müller-Späth T, Steinebach F, Morbidelli M. Comparison of batch and continuous multi-column protein A capture processes by optimal design. Biotechnol J. 2016;11:920–31. doi:https://doi.org/10.1002/biot.201500481.
- Klutz S, Magnus J, Lobedann M, Schwan P, Maiser B, Niklas J, Temming M, Schembecker G. Developing the biofacility of the future based on continuous processing and single-use technology. J Biotechnol. 2015;213:120–30. doi:https://doi.org/10.1016/j.jbiotec.2015.06.388.
- Arnold L, Lee K, Rucker-Pezzini J, Lee JH. Implementation of fully integrated continuous antibody processing: effects on productivity and COGm. Biotechnol J. 2019;14:1800061. doi:https://doi.org/10.1002/biot.201800061.
- Steinebach F, Ulmer N, Wolf M, Decker L, Schneider V, Wälchli R, Karst D, Souquet J, Morbidelli M. Design and operation of a continuous integrated monoclonal antibody production process. Biotechnol Prog. 2017;33:1303–13. doi:https://doi.org/10.1002/btpr.2522.
- Badman C, Cooney CL, Florence A, Konstantinov K, Krumme M, Mascia S, Nasr M, Trout BL. Why We Need Continuous Pharmaceutical Manufacturing and How to Make It Happen. J Pharm Sci. 2019;108(11):3521–23. doi:https://doi.org/10.1016/j.xphs.2019.07.016.
- Rathore AS, Kateja N, Kumar D. Process integration and control in continuous bioprocessing. Curr Opin Chem Eng. 2018;22:18–25. doi:https://doi.org/10.1016/j.coche.2018.08.005.
- Fan L, Kadura I, Krebs LE, Hatfield CC, Shaw MM, Frye CC. Improving the efficiency of CHO cell line generation using glutamine synthetase gene knockout cells. Biotechnol Bioeng. 2012;109:1007–15. doi:https://doi.org/10.1002/bit.24365.
- Lin PC, Chan KF, Kiess IA, Tan J, Shahreel W, Wong SY, Song Z. Attenuated glutamine synthetase as a selection marker in CHO cells to efficiently isolate highly productive stable cells for the production of antibodies and other biologics. mAbs. 2019;11:965–76. doi:https://doi.org/10.1080/19420862.2019.1612690.
- McHugh KP, Xu J, Aron KL, Borys MC, Li ZJ. Effective temperature shift strategy development and scale confirmation for simultaneous optimization of protein productivity and quality in Chinese hamster ovary cells. Biotechnol Prog. 2020. In press. doi:https://doi.org/10.1002/btpr.2959.
- Zhu MM, Goyal A, Rank DL, Gupta SK, Vanden Boom T, Lee SS. Effects of elevated pCO2 and osmolality on growth of CHO cells and production of antibody-fusion protein B1: A case study. Biotechnol Prog. 2005;21:70–77. doi:https://doi.org/10.1021/bp049815s.
- Goetze AM, Liu YD, Zhang Z, Shah B, Lee E, Bondarenko PV, Flynn GC. High-mannose glycans on the Fc region of therapeutic IgG antibodies increase serum clearance in humans. Glycobiology. 2011;21:949–59. doi:https://doi.org/10.1093/glycob/cwr027.
- Baur D, Angelo J, Chollangi S, Müller-Späth T, Xu X, Ghose S, Li ZJ, Morbidelli M. Model-assisted process characterization and validation for a continuous two-column protein A capture process. Biotechnol Bioeng. 2019;116(1):87–98. doi:https://doi.org/10.1002/bit.26849.
- Ichihara T, Ito T, Kurisu Y, Galipeau K, Gillespie C. Integrated flow-through purification for therapeutic monoclonal antibodies processing. mAbs. 2018;10:325–34. doi:https://doi.org/10.1080/19420862.2017.1417717.
- Handlogten MW, Lee-O’Brien A, Roy G, Levitskaya SV, Venkat R, Singh S, Ahuja S. Intracellular response to process optimization and impact on productivity and product aggregates for a high-titer CHO cell process. Biotechnol Bioeng. 2018;115:126–38. doi:https://doi.org/10.1002/bit.26460.
- Takagi Y, Kikuchi T, Wada R, Omasa T. The enhancement of antibody concentration and achievement of high cell density CHO cell cultivation by adding nucleoside. Cytotechnology. 2017;69:511–21. doi:https://doi.org/10.1007/s10616-017-0066-7.
- Gronemeyer P, Ditz R, Strube J. DoE based integration approach of upstream and downstream processing regarding HCP and ATPE as harvest operation. Biochem Eng J. 2016;113:158–66. doi:https://doi.org/10.1016/j.bej.2016.06.016.
- Angelo J, Chollangi S, Müller-Späth T, Jusyte S, Xu X, Ghose S, Li Z. Virus clearance validation across continuous capture chromatography. Biotechnol Bioeng. 2019;116:2275–84. doi:https://doi.org/10.1002/bit.27012.
- Chiang MJ, Pagkaliwangan M, Lute S, Bolton G, Brorson K, Schofield M. Validation and optimization of viral clearance in a downstream continuous chromatography setting. Biotechnol Bioeng. 2019;116:2292–302. doi:https://doi.org/10.1002/bit.27023.