
 ?Mathematical formulae have been encoded as MathML and are displayed in this HTML version using MathJax in order to improve their display. Uncheck the box to turn MathJax off. This feature requires Javascript. Click on a formula to zoom.
ABSTRACT
The discovery of therapeutic monoclonal antibodies (mAbs) primarily focuses on their biological activity favoring the selection of highly potent drug candidates. These candidates, however, may have physical or chemical attributes that lead to unfavorable chemistry, manufacturing, and control (CMC) properties, such as low product titers, conformational and colloidal instabilities, or poor solubility, which can hamper or even prevent development and manufacturing. Hence, there is an urgent need to consider the developability of mAb candidates during lead identification and optimization. This work provides a comprehensive proof of concept study for the significantly improved developability of a mAb variant that was optimized with the help of sophisticated in silico tools relative to its difficult-to-develop parental counterpart. Interestingly, a single amino acid substitution in the variable domain of the light chain resulted in a three-fold increased product titer after stable expression in Chinese hamster ovary cells. Microscopic investigations revealed that wild type mAb-producing cells displayed potential antibody inclusions, while the in silico optimized variant-producing cells showed a rescued phenotype. Notably, the drug substance of the in silico optimized variant contained substantially reduced levels of aggregates and fragments after downstream process purification. Finally, formulation studies unraveled a significantly enhanced colloidal stability of the in silico optimized variant while its folding stability and potency were maintained. This study emphasizes that implementation of bioinformatics early in lead generation and optimization of biotherapeutics reduces failures during subsequent development activities and supports the reduction of project timelines and resources.
Introduction
Therapeutic proteins including monoclonal antibodies (mAbs) are capable of addressing a wide variety of unmet medical needs.Citation1 Despite becoming a cornerstone in drug development, the soaring cost of developing new biological entities (NBEs) has put substantial pressure on biopharmaceutical organizations.Citation2,Citation3 At the discovery stage, biological activity is one of the most important selection criteria. A lead molecule is then progressed into the early stage development phase to assess its developability, which describes chemistry, manufacturing, and control (CMC) properties such as expression titer, purity, conformational (i.e., protein folding) and colloidal stability (i.e., protein aggregation), solubility, and viscosity. The competitive biopharmaceutical environment has increased the demand for prediction and optimization of the developability of the lead candidate to accelerate the development timeline and raise approval success rates. One of the most frequently encountered development issues at each step of the process are product-related impurities, of which protein particle formation/aggregation is the primary impurity compromising efficacy, quality, and patient safety.Citation4
In the first step of the bioprocess development, the proteinaceous active pharmaceutical ingredient (API) is recombinantly produced using mammalian cell culture systems. Interestingly, the efficient production of DS remains a continuing challenge even though high-yielding cell line development approaches have substantially advanced in the past several decades.Citation5 In particular, mammalian systems expressing aggregation-prone mAbs often underperform, showing low product titer and specific productivity.Citation6
The downstream process is developed to achieve maximum yield in combination with an acceptable purity level. Preparative modes of chromatography involving Protein A affinity, anion and cation exchange chromatography are commonly used.Citation7,Citation8 Substantial efforts, however, may be required to separate the product from product-related impurities, such as aggregates and fragments, which are monitored as high molecular weight (HMW) and low molecular weight (LMW) species during analytical size-exclusion chromatography (SEC) experiments.
Finally, a formulation is developed for the purified protein to ensure long-term storage stability and optimal routes of administration.Citation9 This step of the process can be challenging because the diversity and inherent structural complexity of biologicals and their individual interplay with excipients necessitate an individual evaluation and “trial-and-error”-based stabilization for the molecule of choice.Citation10 There is an increasing need for subcutaneous and intravitreal formulations, which often require high drug concentrations, preferably as liquid presentations. Among the various challenges in preparing stable, robust formulations for such routes of administration are concentration-dependent aggregation and high viscosity.Citation11 Possible challenges associated with aggregation of the drug product (DP), i.e., the formulated DS, are most commonly addressed by time-consuming and labor-intensive formulation development.
Recent advances in biopharmaceutical informatics have provided efficient computational tools for the assessment and optimization of sequences and structures, paving the way for engineering a candidate´s developability, in addition to its biological activity, already at the early discovery stage. An early prediction of development issues guides rational sequence optimization approaches, thereby minimizing the risk of costly delays and failures of biotherapeutic development programs.Citation6,Citation12,Citation13 Some biopharmaceutical companies along with some contract development and manufacturing organizations have started to perform sequence optimization via proprietary algorithms,Citation14,Citation15 but there is currently relatively little knowledge about the benefits of in silico optimization performed at an early discovery stage on the performance of the DS and DP at each step of the bioprocess.Citation16 Published studies have used calculated structural descriptors to predict individual CMC properties such as viscosity,Citation17,Citation18 chemical degradation,Citation18 and, in particular, aggregation.Citation6,Citation19 Notably, a variety of in silico tools identifying aggregation-prone regions (APRs) were developed, emphasizing the strong demand for the prediction and prevention of protein particle formation.Citation20-Citation31 Particular attention was paid to the Solubis method,Citation32 which was used in a previous studyCitation6 to predict sequence variants of a therapeutic mAb (called mAb2) with reduced intrinsic aggregation propensity (TANGO)Citation33 under consideration of the thermodynamic stability of the native structure (FoldX).Citation34 A single amino acid exchange (S52R) in complementarity determining region 2 (CDR2) of the light chain (LC) was shown to diminish an APR that triggered aggregation of transiently expressed mAb2.Citation6
Here, we developed the wild type and in silico optimized mAb2 in accordance with a bioprocess widely established in the pharmaceutical industry, providing detailed insights into the beneficial developability of a computationally optimized mAb. Predicted good- (variant) and difficult-to-develop (mAb2) antibodies were established in state-of-the-art platform processes along the value chain of the pharmaceutical development consisting of 1) generation of stable single clone-derived Chinese hamster ovary (CHO) production cell lines; 2) production in a representative 3 L scale bioreactor; 3) downstream purification; 4) physicochemical characterization; and 5) stability studies of respective DP formulations with functional investigations.
Results
In silico optimization enhanced mAb expression titer in stable CHO cells
The effect of an in silico-guided exchange of a single amino acid (SL52R) on the developability of the therapeutic antibody mAb2 was unraveled by performing a complete biopharmaceutical development program comprising establishment of stable cell lines and upstream and downstream processes, as well as development of a suitable formulation buffer for both the wild type and in silico optimized variant. The first obstacle was to establish stable CHO cell lines and to compare the upstream process performance of the best eight single clone-derived cell lines producing either mAb2 or its in silico optimized variant in controlled fed-batch cultivations with regard to differences in cell growth, viability, and mAb productivity. Observed peak viable cell densities (VCDs) ranged from ~8.0 × 10⁶ to 14.0 × 10⁶ cells/mL regardless of the identity of the mAb candidate (). Cell lines expressing the in silico optimized variant showed considerable differences in growth characteristics that indicated clonal variances.Citation35,Citation36 The cell viability was slightly higher in the case of stable CHO cell lines expressing the in silico optimized variant. Final antibody titers and specific productivity of the in silico optimized variant were substantially improved compared to the parental antibody (). More specifically, mean mAb titer of mAb2 achieved ~0.6 g/L, while the in silico optimized variant expressing clones yielded a mean titer of ~2.3 g/L. The mean specific productivity of investigated mAb2 clones was ~6.5 pg/(cell∙day), while the mean specific productivity of the in silico optimized variant was ~23.5 pg/(cell∙day).
Figure 1. Cell culture performance of clonal cell lines producing either the mAb2 or its in silico optimized variant in controlled fed-batch production processes. (a) Viable cell density (VCD, filled circles) and viability (open square), and (b) final antibody titer and (c) mean specific productivity (filled triangle) of the top eight clonal cell lines are shown for a controlled 14-day micro-bioreactor fed-batch cultivation process (ambrTM 15). In case of VCD and viability the mean and standard deviation of biological duplicates (n = 2) are displayed. Each replicate was used as single data point in the boxplot, and whiskers represent the 10th and the 90th percentile. The highlighted clones (thicker line and more intense color) were further investigated in 3 L benchtop bioreactors. An unpaired t-test confirmed statistical significance (****: p < .0001). (d) VCD (filled circles) and viability (open square), (e) cumulative antibody titer, and (f) calculated mean specific productivity of the best performing clonal cell lines in a controlled 14-day fed-batch cultivation process was performed in 3L bioreactors. The runs were performed without biological replicates, and antibody titer was determined starting from day 6. Clonal stability data can be found in Supplementary Figure S1.
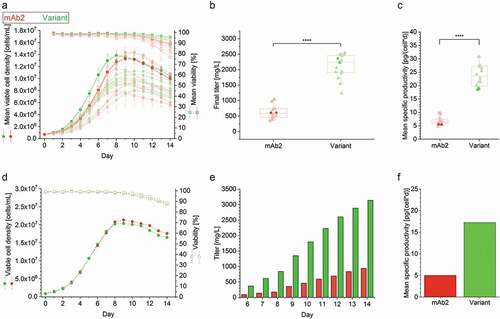
To further test the enhanced performance of the in silico optimized variant in a microscale cultivation process, the top performing cell lines for both mAb candidates were cultivated in a fed-batch process using a 3 L benchtop bioreactor system. While growth characteristics and cell viability profiles were highly comparable ()), final mAb titers and specific productivity differed substantially between the two cell lines either producing mAb2 (~1.0 g/L with 5 pg/(cell∙day)) or the in silico optimized variant (~3.3 g/L with 17 pg/(cell∙day)), accounting for a three-fold increase in both product titer and specific productivity (,f)). Clonal stability was confirmed not to be the major causative for different performances (supplementary figure S1). Three of the five stable cell lines were identified to be phenotypically stable for at least 90 days regardless of the identity of the expressed mAb (data not shown).
Analysis of intracellular inclusions in mAb2-producing CHO cells via immunocytochemistry
The difficult-to-develop mAb2 was previously reported to accumulate in the lumen of an aberrant endoplasmic reticulum (ER) of stable CHO cell lines.Citation37 To test whether the sequence optimization of the in silico optimized variant affects the cell morphology and intracellular mAb accumulation during expression, stable CHO cell lines were investigated using immunofluorescence microscopy. As expected, the good-to-express (GTE) reference mAb (producing >4.5 g/L under comparable conditions, supplementary Figure S2) was equally distributed in the cytoplasm of a highly productive reference cell line (), supplementary Figure S3). In comparison, the mAb2-producing CHO cells were characterized by antibodies that accumulated in circular vesicles with a maximum diameter of ~2 µm. Interestingly, less pronounced vesicles were displayed in CHO cells that produced the in silico optimized variant. This was confirmed for five individually generated, single-clone-derived cell lines expressing either mAb2 or its in silico optimized variant (data not shown). To categorize and quantify CHO cells according to their morphologic appearance, a broad microscopic analysis of the respective cell populations was performed (), supplementary Figure S4). The reference cells showed no accumulation of the GTE mAb, while more than 80% of the mAb2-expressing cells showed putative protein inclusions. Notably, the in silico optimized variant-expressing cells displayed a relieved phenotype in half of all stained cells.
Figure 2. Investigation of CHO cells producing a good-to-express monoclonal antibody (GTE mAb) as reference, mAb2 and its in silico optimized variant. (a) Confocal images of cell lines producing the GTE mAb, mAb2 and the in silico optimized variant were acquired at a 63 x primary magnification. Additional information on productivity of the GTE mAb can be found in supplementary Figure S2. Nuclei and recombinant protein were stained using DAPI (blue) and a fluorescent secondary antibody (red). An overview can be found in supplementary Figure S3. (b) Ratio of single cells with intracellular antibody inclusions are shown for the total cell count. For visualization, cells have been cultured adherently for this analysis only. (c) The folding of free LC molecules (not bound to heavy chain) within the cell was analyzed densitometrically in three independent western blotting-electrophoretic mobility shift assays (supplementary Figure S5). An analysis of variance (ANOVA) determined statistical significance (*: p < .05; **: p < .01). M, Marker; ns, not significant.
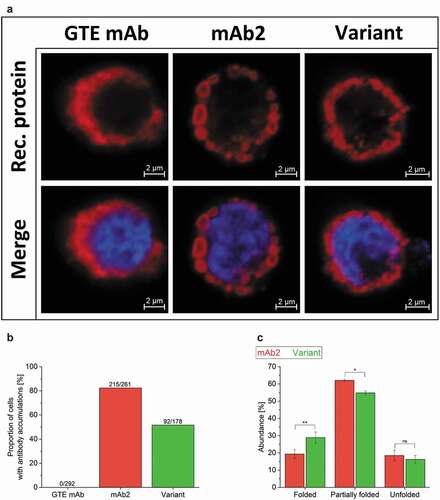
The retention and intracellular accumulation of mAb2 are thought to be driven by a broken intramolecular disulfide bridge in the LC.Citation37 Therefore, the folding of mAb2 and its in silico optimized variant in CHO cells was investigated comparatively by coupling-free cysteines to PEG5000-maleimide, followed by electrophoretic separation by western blotting-gel mobility shift assay. Interestingly, the in silico optimized variant was expressed in the cell with a significantly increased proportion of partly and completely folded antibody compared to mAb2 (), supplementary figure S5), indicating that the in silico optimization supported the intracellular folding of the in silico optimized variant. mAb2 was not only particularly prone to accumulation in the lumen of the ER but also intracellular unfolding, creating a secretion bottleneck in mAb2-expressing CHO cells that was successfully alleviated by the introduction of the single amino acid substitution SL52R.
Antibody purification and product quality analysis
Progressing to the next step in the bioprocess value chain, increased antibody titer achieved in cell line and upstream development needs to fit with the constraints of the downstream processes.Citation38 Therefore, the purification of mAb2 and its in silico optimized variant was performed identically, in accordance with a purification strategy widely applied in the pharmaceutical industry. Protein A affinity chromatography (AC) was conducted as a first purification step to capture the IgG and to remove process-related impurities such as host cell proteins and DNA. This was followed by an acidic treatment (AT) and depth filtration (DF) of the eluate to inactivate and remove any viruses. Next, anion exchange chromatography (AEX) was used to further remove DNA, host cell proteins, and leached Protein A. As expected, the content of HMW species was successfully reduced by DF and AEX (–c)). Interestingly, the DS of wild type mAb2 contained higher levels of HMW species at each of the purification steps relative to the in silico optimized variant (–c)). The HMW formation indicates strong aggregation of the product species, which reduced the product yield after separation. Furthermore, the in silico optimized variant exhibited a higher purity after elution from AEX ()). The variant could be concentrated to 33 mg/mL via ultrafiltration/diafiltration (UF/DF), while visual investigation indicated mAb2 precipitation at concentrations above 15 mg/mL that correlated with a strong increase in HMW species ()), as well as pressure and time required for ultrafiltration (data not shown). After UF/DF of both DSs into the formulation buffer and dilution to an anticipated mAb concentration of 10 mg/mL, the DS of the in silico optimized variant had a drastically reduced HMW content compared to mAb2 (∆ = −33.8%, )). In summary, the in silico optimized variant was purified with an acceptable level of purity (98.8%) and a lower HMW content (5.2%) by applying a typical platform purification process, while the same process required significantly more development effort in the case of mAb2 (purity 97.9%, HMW 39.0%) to achieve an acceptable product quality and economically profitable yield.
Figure 3. Characterization of the product quality after individual purification steps. (a–c) Low molecular weight – (LMW, A), high-molecular-weight species (HMW, C), and monomer (b) content of the drug substances of mAb2 and the in silico optimized variant were examined after individual purification steps by high-performance size-exclusion chromatography (HP-SEC). Acidic treatment, AT; depth filtration, DF; anion exchange chromatography, AEX; ultrafiltration/diafiltration, UF/DF; and initial drug product, initial DP. (d) The purity of the AEX-polished drug substance was determined by employing capillary electrophoresis on a Caliper. (e) The glycosylation profile of the drug substances was analyzed after protein A affinity chromatography (AC), DF and AEX by Caliper glycosylation analysis. G1 F* represents the second naturally existing glycan isomer of G1F. Man5, mannose-5; G, galactose; F, fucose.
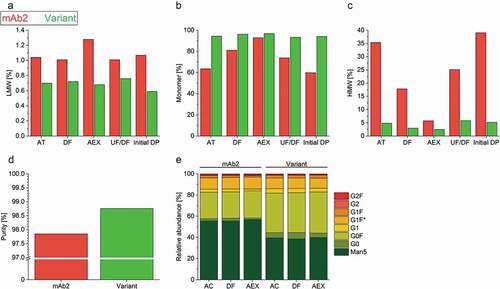
Despite sharing identical glycosylation sites in their sequences, both mAbs were characterized via lab chip (caliper) analysis to test whether the heterogeneous N-glycosylation pattern was affected by differences seen in the CHO cell morphology, as well as upstream and downstream development processes ()). We found that the basic core structure of mAb2 bore predominantly mannose-5 (~55%), while the in silico optimized variant was slightly more galactosylated and fucosylated into more complex oligosaccharides (∆relative abundance variant – mAb2: −17% Man5; +3% G0; +2% G1; +12% G0 F). Additionally, the glycosylation profile of mAb2 expressed by three cell clones was more variable when compared to the in silico optimized variant-producing clones (supplementary Figure S6). Notably, the N-glycosylation profiles of both mAb candidates were not altered during the downstream purification process ()).
Biophysical characterization of the formulated protein
Physical and chemical instabilities of biopharmaceuticals can be an obstacle to development.Citation39,Citation40 The above described in silico optimization of mAb2 was designed to diminish the APR to increase the colloidal stability, but it also applied the empirical force field FoldX to maintain the conformational stability. Differential scanning calorimetry (DSC) measurements of the multi-domain IgG indicated that the amino acid exchange SL52 R did not affect the heat-induced unfolding of the antigen-binding (Fab) domain, resulting in a consistent Fab Tm ()). Moreover, the mutation did slightly alter the additional heat absorption peaks corresponding to the denaturation of further domains such as CH2 and CH3.
Figure 4. Thermal stability of the drug products. (a) Differential scanning calorimetry (DSC) and (b) Intrinsic fluorescence (IF) measurements indicated the thermal unfolding of mAb2 (red) and the in silico optimized variant (green). The change in (a) heat capacity and (b) first derivate of the fluorescence ratio indicate the Tm of the Fab.
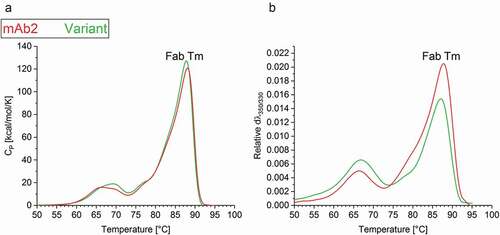
The relative conformational stability of both mAbs was additionally tested by intrinsic fluorescence (IF) measurements. Again, the in silico optimized variant exhibited a relatively similar Fab melting temperature (Fab Tm = 86.6°C ± 0.0) to mAb2 (Fab Tm = 87.2°C ± 0.0) ()). The differences in the temperature-dependent fluorescence signal pointed toward an altered accessibility of aromatic residues between both mAbs. To summarize, the folding stability of the antibody was maintained after a computationally guided exchange of a single amino acid (SL52R) in the variable region of the LC. Therefore, this bioinformatic approach supports the identification of conformationally stable sequence variants with an improved probability of success for stabilizing the protein in a formulation buffer.
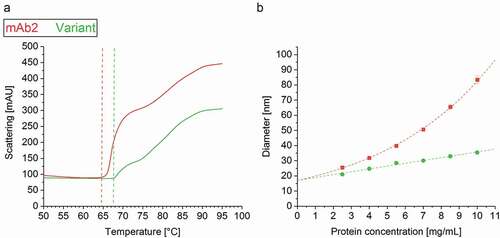
To further investigate the interplay of denaturation and aggregation, i.e., breakage of intramolecular and formation of intermolecular interaction, the aggregation temperature Tagg was assessed via light scattering simultaneous to IF measurement.Citation41 Strikingly, the Tagg of the in silico optimized variant (Tagg = 67.6°C ± 0.0) clearly exceeded that of mAb2 (64.7°C ± 0.2) ()), underlining the variant’s increased resistance to heat-induced aggregation. The increased Tagg of the in silico optimized variant expressed in stable CHO cell lines confirmed a similar trend reported for the analogs in silico optimized variant expressed transiently.Citation6 The computationally predicted strong self-association/-aggregation tendency of mAb2 was experimentally confirmed by an exponentially increasing diameter between 2 and 10 mg/mL, while that of the in silico optimized variant increased linearly ()).
Figure 5. Colloidal stability of the drug products. (a) The aggregation temperature Tagg was determined simultaneously with the intrinsic fluorescence (IF) measurement by detection of dynamic light scattering (DLS). (b) DLS analysis unraveled an exponential increase of the mAb2 diameter within a protein concentration of 2–10 mg/ml, but a linear correlation in case of the in silico optimized variant.
Long-term stability study of the formulated DP
Pharmaceutical stability testing is a routine procedure performed on DPs at various stages of the development process to assure an acceptable level of quality throughout a period covering the production, supply, storage, and utilization of the last unit of the product by the patient.Citation42 Here, mAb2 and its in silico optimized variant were investigated in real-time and in accelerated stability studies. In the case of the real-time stability study, the DPs are exposed to environmental conditions that cover the normal life cycle of the pharmaceutical by refrigeration (2–8°C) for a defined time period. In contrast, the accelerated stability study stresses the DPs by incubation at room temperature (25°C) or 40°C to accelerate aggregation/degradation processes and predict shelf lives.Citation43 Samples were taken initially and at analytical time points (ATP) after storage of one month, three months, and six months, and preservation of pH, osmolality, and protein concentration was controlled. The target parameters of the DP (pH 6.0, range of osmolality, c(API) = 10 mg/ml) were met after final formulation of both mAb candidates, and pH and osmolality were stable during the test period (data not shown).
The product quality, and in particular the particle formation, was monitored throughout the real-time and accelerated stability studies via a broad panel of diverse techniques comprising nephelometry, micro-flow imaging (MFI), high-performance size-exclusion chromatography (HP-SEC), and visual inspection (VI). The relative opalescence of proteins at a given concentration and formulation correlates with the nature of solute-solute and, associated therewith, solid-light interactions.Citation44 The opalescence of mAb2 was significantly higher than that of the in silico optimized variant at every ATP in both, real-time and accelerated stability studies, confirming the enhanced self-association/-aggregation tendency of mAb2 ()). The striking decrease of opalescence with storage time indicates, inter alia, changes of the particle sizes over time. During storage of the DP of mAb2, subvisible particles were formed in various size ranges (≥ 25 µm < 1000 µm, ); ≥ 2 µm < 1000 µm, ≥ 10 µm < 1000 µm, supplementary Figure S7), presumably affecting the sedimentation tendency of the particles.
Figure 6. Product quality and colloidal stability of the drug products (DPs) during storage study. (a) Opalescence of the DPs and the formulation buffer was determined nephelometrically at a wavelength of 633 nm. * Initial mAb2 samples and samples stored at 2°C exceeded the calibrated range of the nephelometer (120 NTU). FB, Formulation buffer (25 mM Na-citrate, 125 mM NaCl, pH 6.0). (b) Particles with a size between ≥25 µm and <1000 µm of DPs and formulation buffer were quantified per ml using micro-flow imaging (MFI). (c) The proportion of high-molecular-weight (HMW) species in the DPs was examined by running high-performance size-exclusion chromatography (HP-SEC). (d) Samples were visually inspected concerning opalescence, color intensity and presence of particles. *Filamentous particles. (e) Example image of DPs and formulation buffer stored in glass vials for three month at 25°C.
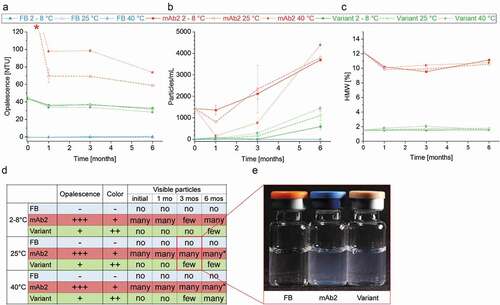
We found that the initial DP of mAb2 formed a significantly increased proportion of HMW species (12%) relative to the in silico optimized variant (2%). The HMW content of both mAbs was reduced after the initial time point and did slightly decrease further after storage for six months ()). It is worth mentioning that this method predominantly detects oligomers ≤2 µm since the progressively formed particles with sizes of tens to hundreds of micrometers (), supplementary Figure S7) are pre-filtered prior the SEC column. Moreover, the LMW species of mAb2 (12%) clearly exceeded that of the in silico optimized variant (1%) at the initial ATP, and increased stronger during six-month storage at elevated temperature (mAb2: ∆ 4%, variant: ∆ −1%) (supplementary Figure S7). Increasing HMW and LMW species resulted in a significant decrease in mAb2 monomers over time (∆ – 2%) relative to an unchanged monomer content of the in silico optimized variant (∆ 0%) (supplementary Figure S7). Visual inspection (VI) of the liquid formulations filled in glass vials confirmed this trend. The DP of mAb2 contained visible particles at the initial ATP, and particle formation was substantially triggered during storage at 25°C and 40°C. In contrast, the DP of the in silico optimized variant showed no visible particles after filling, and particles were only detected after storage for three months at 40°C. Additionally, the DP of the in silico optimized variant was characterized by a dramatically reduced color intensity and opalescence relative to the DP of mAb2 (,e)).
Another challenge encountered in drug development is high viscosity of the concentrated DP, which often results from higher-order intermolecular interactions and non-native aggregation.Citation45 In this study, the rheological properties of the DPs could only be tested up to a protein concentration of 10 mg/ml due to the remarkably strong precipitation of mAb2 upon further concentration in UF/DF, an effect that was not observed for the in silico optimized variant. At this moderate mAb concentration of the DPs, a comparable viscosity (mAb2: 1.75 mPas s ± 0.08; variant: 1.51 mPas s ± 0.08 at 20°C) was detected at the initial ATP, which increased slightly during storage at elevated temperatures (supplementary Figure S8).
Functional characterization of the formulated DP
During sequence optimization, it can be challenging to replace critical amino acid residues to improve the CMC properties while also maintaining the mAb’s target affinity. In silico analysis of the mAb2-vascular endothelial growth factor (VEGF) co-structure (PDB ID: 2FJF)Citation46 recommended the exchange of a single amino acid in LCDR2 that did not contribute to target binding. Preservation of the in silico optimized variants affinity to VEGF was verified by determining the binding kinetics via surface plasmon resonance (SPR) spectroscopy. The equilibrium dissociation constant (KD) of both DPs was in the low nanomolar range qualifying the in silico optimized variant to bind VEGF with a similar high affinity as seen for mAb2 molecule ((a,b); ).
Table 1. Antibody-antigen binding kinetics: association and dissociation rate constants and equilibrium dissociation constant (KD).
Figure 7. Vascular endothelial growth factor binding activity of mAb2 and its in silico optimized variant. Binding kinetics of a concentration series of vascular endothelial growth factor (4, 8, 16, 32, 64 and 128 nM) to immobilized (a) mAb2 and (b) the in silico optimized variant was measured. Double-referenced curves were fitted to a 1:1 binding model (black line). (c) Binding of the initial drug product (DP) of mAb2 to vascular endothelial growth factor was measured by SPR, and the response was set to 100%. The activity of all other samples was compared in percentage difference to that of the initial mAb2 DP. SEC indicated that aggregates of mAb2 are resolved in SPR buffer (data not shown).
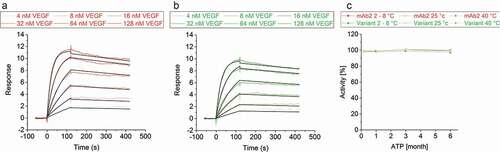
Storage of both DPs for up to six months at 2–8°C, 25°C and even at 40°C did not alter the activity that was assessed via SPR binding experiments ()). This finding confirmed that the in silico optimized variant maintained its expected biological activity, which is fundamentally important for the product’s shelf life.
Discussion
MAbs of the same subtype differ greatly in their biophysical and CMC properties even though they share a high sequence identity, except in the affinity-mediating variable domain.Citation12,Citation16,Citation45,Citation47 In particular, physical and chemical instability of biopharmaceuticals in aqueous solutions is a major obstacle that must be overcome during the development of a formulation to avoid significant delay or even termination of programs.Citation10,Citation16 The promising approach of bioinformatics has greatly advanced over the past decade, and can now predict biophysical characteristics of a mAb candidate based on its primary sequence early on, without the need for material. The extremely high speed, low costs, and versatile and automatable performance of computational tools enable characterization of a large set of sequence variants, and selection of the most promising candidates predicted to have superior overall CMC properties early in the discovery phase.Citation6,Citation16,Citation48 However, there is currently still little knowledge of how the in silico optimization of a biotherapeutic performed at the discovery stage will translate into bioprocess development comprising cell line, upstream, downstream, and development of a formulation.
In this study, a difficult-to-develop antibody (mAb2) and the in silico optimized variant thereof, which only differs in one (SL52R) of ~650 amino acids per heavy-light chain pair, were developed in accordance with an industrial antibody manufacturing process. Remarkably, stable mammalian CHO cell lines produced the in silico optimized variant with a three-fold increased antibody titer without impairing cell growth or viability. Enhanced performance of mammalian cell lines producing antibody variants with improved biophysical properties was similarly reported for different mAbs.Citation6,Citation16,Citation49 Obviously, improved biophysical properties of an antibody candidate are not only beneficial extracellularly but also support antibody biosynthesis, modification, folding and secretion, causing significantly different expression rates.Citation50 The intracellular accumulation of mAb2 represented a bottleneckCitation37 that was mitigated in cells producing the in silico optimized variant. Similarly, the formation of intracellular aggregates of another antibody within the ER of HEK293 cells was affected by an amino acid substitution in the LC CDR1.Citation51 We were further able to show that the recovered cell morphology was accompanied by a more complex N-linked glycosylation pattern of the in silico optimized variant that potentially affects the biological activity, protein folding, conformation, stability, solubility, secretion, pharmacokinetics, and antigenicity.Citation52 However, both mAbs shared a relatively high level of immature mannose structures potentially causing undesirable elevated clearance from bloodCitation53-Citation55 while improving potency by enhanced antibody-dependent cell-mediated cytotoxicity.Citation55-Citation57
After each step of the downstream purification process, the in silico optimized variant consistently contained less HMW species, i.e., more monomeric product, which supports the hypothesis that antibody candidates with reduced aggregation tendency can be purified with a higher monomer content.Citation12,Citation16 It was previously shown that subtle changes in the amino acid sequence of the mAb largely affect the clearance of interacting host cell proteins such as enzymes,Citation58 capable of causing particle formation in the DP via self-assembly of host cell proteins or degradation products of enzymatically digested excipients such as polysorbates.Citation59 The simultaneously reported reduction of viscosityCitation12,Citation16 was confirmed by successful ultrafiltration of the in silico optimized variant, while mAb2 was non-processable into highly concentrated liquid formulations (HCLF) without additional development efforts.Citation60 It can be reasonably assumed that viscosity differences between mAb2 and the variant would be even more pronounced if the DP could be concentrated to the range of 100–200 mg/mL, further strengthening protein–protein interactions, and therefore the associated opalescence, protein aggregation, and viscosity.Citation45 Notably, the viscosity of a concentrated protein solution represents a major challenge in attaining feasible manufacturing processes such as UF/DF, sterile filtration, as well as during fill and finish, which necessitates a closer link between formulation studies and manufacturing.Citation61,Citation62 Additionally, current trends lean toward HCLFs to enable subcutaneous and intravitreal administration via thin needles that require low viscosity DPs.Citation45,Citation61
Our bioinformatic approach guided the modification of another difficult-to-develop mAb, and successfully reduced the viscosity of the HCLF (supplementary Figure S9). The final product titers of this mAb were also enhanced (from 1.5 g/L to >5.5 g/L) by expression in stable CHO cell lines cultivated in a standard fed-batch process (supplementary Figure S9). Remarkably, the single amino acid exchange did not affect the biological activity but increased the aggregation onset temperature (Tagg), which translated into a reduced aggregation tendency.Citation6
The early research stage of biotherapeutics development typically involves the study of a large number of potential candidates, although limited samples of each are needed.Citation16 Once the antibody lead passes through the discovery phase, the sequence is virtually “locked”, precluding subsequent changes that might help to overcome later occurring development issues.Citation16,Citation63 This study emphasizes the substantial and not yet fully exploited potential of in silico tools to identify and optimize developable/manufacturable therapeutic mAb candidates based on sequence-structural properties.Citation16 Attractively, bioinformatics investigations are cheap to implement, fast to conduct and applicable to all stages of biological drug discovery, reducing the risk of failure at later stages due to, for example, formulation issues.Citation13,Citation16 We evaluated the molecular properties of an aggregation-prone mAb by using a simple aqueous formulation buffer (25 mM Na-citrate, 150 mM NaCl, pH 6.0) that lacked additive agents often required to stabilize liquid protein formulation of mAbs.Citation10 Moderately aggregation-prone antibodies can alternatively be formulated using a more sophisticated buffer to meet safety and efficacy requirements.Citation6 However, a universal strategy for the DP stabilization is excluded by the diversity of antibody drug candidates, which is characterized by a complex and individual interplay between CDR and framework regions,Citation64 making the identification of the most appropriate additive(s) a time-consuming, resource-intensive, trial and error process.Citation10 The limitations of a classical wet-lab approach increase the attractiveness of an in silico based complement for the selection and design of molecules that combine biological activity with developability to reduce the costs and time to market.
The superior developability of the in silico optimized variant produced by stable cell lines fit well with previous findings on the transiently expressed analog.Citation6 Particularly striking for the consistent trend observed for transiently and stably produced material, the colloidal stability of the in silico optimized variant was likewise increased as indicated by a higher initial monomer content and decelerated monomer loss over time.Citation6 Furthermore, the herein determined biological activity confirmed previously conducted microscale thermophoresis and SPR binding experiments.Citation6 The good interplay between both studies qualifies transient material for an early screening of in silico-designed antibody variants concerning biological activity combined with manufacturability, paving the way for routine testing of in silico optimized sequences using transient expression systems early in the process chain.Citation12,Citation36,Citation49 Subsequently, only the most promising candidates move into full cell line development campaigns. As a consequence, the successful combination of in silico tools with robust bioprocess development platforms will be key for future advancement within the inherently complex field of biopharmaceutical development, helping to bring innovative therapeutics to patients more quickly.
To estimate the benefit and success of bioinformatics on the development of biologicals in even higher detail, several limitations and aspects need to be addressed in future studies. These key aspects include: 1) the need for larger and more heterogeneous sets of experimental data that can be fed-back to train the computational counterpart; 2) the expansion from standard IgG to structural diverse formats, such as non-IgG-derivatives, nanoparticles, viruses; 3) the consideration of post-translational modifications such as glycosylation; 4) the extension of computational predictions, for example, on charged and hydrophobic patches that are associated with viscosity;Citation12 and 5) in vivo studies and safety investigations of in silico optimized candidates.
In conclusion, this study showed that an exemplarily in silico optimized variant of the difficult-to-develop antibody mAb2 possessed enhanced biophysical properties, such as an improved colloidal stability. Further, long-term storage of the investigated DP formulations confirmed reduced opalescence and particle formation. In silico prediction and optimization of mAb2 substantially enhanced its manufacturability throughout the entire production process from cell line development and cell culture-based production, downstream purification, to final formulation and storage, without negatively affecting product quality or binding capacity. This study emphasizes the great and not yet fully exploited potential of bioinformatics to facilitate the lead generation, optimization, development, and manufacturing of biotherapeutics. Complementary approaches combining high-throughput computational tools and automated experimental studies hold great potential for a more successful but less burdensome discovery of promising drug candidates. A valuable side effect of this hybrid strategy is the mutual generation of a multidimensional database combining computational and experimental data that can be used to further train bioinformatic predictions of the candidate’s developability, manufacturability, and fit to platform processes. This approach will thereby help to reduce failures during development activities and support the reduction of project timelines and resources.
Materials and methods
Mutant design
The in silico analysis of the therapeutic mAb was previously described in detail.Citation6 APRs were identified using TANGO,Citation33 the crystal structure of mAb2 (PDB ID: 2FJF)Citation46 was prepared for analysis using YASARA Structure,Citation65 and finally prepared and analyzed using FoldX force field.Citation34 The in silico optimized variant distinguishes from mAb2 in a single amino acid (SL52R) that was predicted by a computational analysis called mutant aggregation and stability spectrum (MASS).Citation66
Generation of stable antibody-producing CHO cell lines
For the generation of stable CHO production cell lines expressing the investigated mAbs, the Boehringer Ingelheim (BI) glutamine synthetase (GS) deficient BI-HEX® CHO-K1GS cell platform was used. In brief, suspension-adapted CHO-K1GS host cells were transfected with a plasmid comprising both the respective antibody heavy chain (HC) and LC genes and the GS gene. Stable cell pools selected in glutamine-free medium were subjected to single cell cloning (SCC) into 384-well plates using fluorescent-activated cell sorting on a FACSAriaTM Fusion cell sorter (BD Biosciences). Automated high-throughput microscopy was routinely performed on days 0, 7, and 14 post SCC using a CellavistaTM imaging system (Synentec bio Services) to ensure monoclonality. Based on cell growth and mAb productivity, the best performing monoclonal cell lines were further expanded from 384-well plate to 96-well plate to 6-well plate (cultivated statically), thereby gradually reducing the number to eight clones per investigated mAb. After upscaling, cell lines were routinely cultured in BI proprietary glutamine-free and chemically defined media. Unless otherwise stated, the cultivation was performed in shake flasks (Corning) in an orbital, non-humidified incubator shaker (Infors) at 36.5°C, 5% CO2 and agitation at 120 rpm (50 mm orbit). Cell cultures were seeded at 4.0 × 10⁵ viable cells per mL and passaged every 2–3 days. Viable cell concentration was assessed using a Cedex HiRes AnalyzerTM (Roche Diagnostics) by means of trypan blue exclusion.
Fed-batch cultivation
To investigate bioprocess performance, the eight best stable clones of each investigated mAb were subjected to controlled fed-batch cultivation using an advanced micro bioreactor system ambrTM 15 (Sartorius Stedim). Further, the most representative clones producing either mAb2 or the in silico optimized variant were additionally evaluated in a 3 L benchtop scale bioreactor. Briefly, cells were seeded at 7.0 × 10⁵ cells/mL in production medium and fed daily with 30 mL/L of culture start volume starting from day one using BI proprietary feed medium. Glucose levels were adjusted to 5 g/L if determined <3 g/L via glucose bolus addition. Cell concentration and viability were analyzed each day using a Cedex HiRes AnalyzerTM (Roche Diagnostics) by means of trypan blue exclusion. Glucose and lactate concentrations were determined daily using a Biosen C-Line System (EKF Diagnostics), and pH and pO2 were analyzed daily using a RAPIDLab®248 system (Siemens Healthcare). Determination of mAb concentration was started on day 6 by biolayer interferometry (BLI) on an Octet® HTX system (Pall Life Science). For BLI analytics, respective Protein A labeled sensors were equilibrated in cell culture medium before measurement. Sensor regeneration was performed in 10 mM glycine at pH 1.5 between each measurement. A standard curve of the respective antibody was used to calculate the product concentration in the culture supernatant.
Immunocytochemistry
Investigated single clone-derived CHO cell lines were cultivated in suspension using BI proprietary chemically defined media until day 4, and either directly fixed or additionally cultivated adherently in Nunc™ Lab-Tek™ II Chamber Slides™ using Ham´s F-12 Nutrient Mixture supplemented with 1% of fetal calf serum (Sigma Aldrich) for 48 h. Cells were fixed with 4% paraformaldehyde. Following a permeabilization step using 0.1% TritonX-100, samples were blocked and incubated with an appropriate dilution of antibodies for 1 h. The directly Dylight® 550-labeled antibody (#ab98620, abcam) used for HC detection of the recombinantly produced proteins was diluted 1:50. Isotype controls were diluted accordingly. Nuclei were counterstained with 4′,6-Diamidin-2´-phenylindol (DAPI, Sigma-Aldrich). After staining, samples were mounted with Prolong® Diamond Antifade Mountant medium (Invitrogen) and analyzed. Pictures were acquired with a Zeiss LSM 710 confocal microscope equipped with a 405 nm, and 561 nm laser (Carl Zeiss). A GTE antibody-producing cell line was used as reference.
Intracellular recombinant protein folding analysis
The intracellular formation of intra-domain disulfide bridges of the antibodies LC was quantified as previously described.Citation37 Respective CHO cells were lysed for 30 min on ice by addition of lysis buffer (1% TritonX 100 (v/v), 50 mM Tris(hydroxymethyl)-aminomethane (Tris), 150 mM NaCl, pH 7.5) supplemented with either 20 mM PEG5000-maleimide (Sigma Aldrich) or N-ethylmaleimide (Alfa Aesar). After centrifugation, free kappa LC was immunoprecipitated from the supernatant by a previously desthiobiotinylated (DSB-X Biotin Protein Labeling Kit, D20655, Thermo Fisher Scientific) murine antibody (MAB8461, Abnova). Samples were incubated overnight at 4°C on a rotary shaker. Equilibrated PierceTM Streptavidin Plus UltralinkTM Resin (Thermo Fisher Scientific) was added, and samples were further incubated for 1 h at 4°C. The beads were washed three times with ice-cold lysis buffer. Subsequently, the beads were separated via SDS-PAGE using NuPAGE® 4–12% or 10% Bis-Tris Gels (Invitrogen) and transferred to a nitrocellulose membrane using the iBlot® 2 dry blotting system (Invitrogen). The antibody used for LC detection (#K3502, Sigma Aldrich) and the secondary IRDye®800CW-labeled donkey anti-mouse antibody (#925-32212, LI-COR) were added to the membrane and detected by conducting the Odyssey Infrared Scanning System (LI-COR). Three independent western blots were analyzed densitometrically based on pixel intensity using Image Studio Software Version 5.2.5 (LI-COR).
Antibody purification
The mAbs were purified similarly in accordance with a state-of-the-art strategy commonly used in the pharmaceutical industry.Citation67,Citation68 The mAbs were isolated using a Protein A capture chromatography, separated from viruses by employing a low-pH virus inactivation and filtration step, and further purified by conducting a sequential AEX. Subsequently, tangential flow filtration was applied to concentrate the bulk DS to a mAb concentration of >15 mg/mL and diafilter (Sartorius)Citation69 using a 30 kDa nominal molecular weight cut off polyethersulfone membrane (Sartocon Slice 200, Sartorius) into the formulation buffer (25 mM sodium citrate, 125 mM sodium chloride, pH 6.0).Citation70
Product quality assessment
The purity and glycosylation profile of the DSs were analyzed by capillary electrophoresis (Caliper Life Sciences, PerkinElmer). Sample preparation was performed according to the instructions of the manual using the Protein Express Kit and Sample Buffers (PerkinElmer). Relative fluorescence of each sample was measured for 45 sec. and evaluated using the LabChip GX software (PerkinElmer). LMW, HMW, and monomer species were separated by SEC (TSK-Gel G3000SWXL, TOSOH Bioscience). An HP chromatography system (Waters) running buffer (50 mM Tris HCl, pH 7.4, 150 mM NaCl) at a flow rate of 1 mL min–1 was used. A KrudKatcher Classic (Phenomenex) in-line filter with a pore size of 2 µm was installed before the column. Samples were diluted to a protein concentration of 5 mg/mL by addition of running buffer, and 6 μL of the prepared sample was injected. The UV absorption was detected at a wavelength of 280 nm using the UV/VIS-detector 2489 (Waters), and relative areas of LMW, monomer, and HMW peaks were quantified using Empower Pro 2.0.
Stability studies of formulated DP
The mAb solutions were filtered using a 0.22 µm sterile filter membrane (Rotilabo, Carl Roth GmbH & Co. KG), diluted to a mAb concentration of 10 mg/mL by addition of formulation buffer, and 2 mL were filled into 2 R clear glass type I vials. The samples were characterized initially and rubber stopper sealed vials were placed upright in stability chambers that were temperature-/humidity-controlled at 2–8°C/unspecified relative humidity (RH), 25°C/60% RH and 40°C/75% RH. Samples were analyzed at ATP after storage for one, three, and six months.
UV-vis absorption spectroscopy
Protein concentration was determined via the SoloVPE spectrophotometer (C Technologies), which measures the absorbance at a wavelength of 280 nm and applies a scattering correction at 320 nm. The theoretical molar extinction coefficient of the mAb2 wild type coincides with that of its in silico optimized variant (215,380 M−1 cm−1).
Osmolality and pH assessment according to pharmacopeia
The osmolality and pH of the samples were examined by running the Osmomat 3000 (Gonotec) and Seven2Go pH meter (Mettler Toledo), respectively, previously equilibrated with buffers of pH 4.0 and pH 7.0 (Mettler Toledo).
Visual inspection of formulated DP
The DPs were visually investigated for particles by a trained personal at an illuminance level of 2000–3750 lx. The presence of particles was then categorized. Moreover, the opalescence of the DP was characterized quantitatively and qualitatively (none, -; weak, +; medium, ++; strong, +++), and the color intensity was assessed by visual comparison to BY color standards. Photographic images of each sample were taken with an EOS 700D (Canon).Citation71
Nephelometry
Opalescence was measured nephelometrically at a wavelength of 633 nm via a BI-internal custom-built photospectrometer equipped with a right-angle laser light scatter setup analyzing the scattered light. The instrument was calibrated with StablCal Standard of 20 NTU and 100 NTU stabilized formazin opalescence solutions (Hach Lange).
Micro-flow imaging
Protein solutions were tested for the presence of sub-visible particles that were quantitatively characterized by the MFI system DPA4200 (Brightwell Technologies). The system was flushed with particle-free water before each sample analysis to provide a clean baseline. Samples of 0.6 mL with a pre-run of 0.2 mL were analyzed at a flow rate of 0.17 mL/min and a fixed camera rate.Citation71 Images were processed by the MVAS software (Version 1.4.0, Brightwell Technologies) to extract each particle and its characteristics, including size, shape, transparency, and an individual image.Citation72
Rheology
The viscosity of 200 µL samples was rheologically determined by the HAAKE MARS III rheometer (Thermo Fisher Scientific) equipped with 35 mm titanium cone with an angle of 1°. The protein solutions were sheared at 20°C for 100 s at a constant rate of 1000 s1, with measurements averaged over 1-s intervals. Similarly, the temperature-dependence was investigated in the interval between 4°C and 40°C.
Dynamic light scattering
Samples were filtered (0.8 µm) and diluted to a final protein concentration of 10.0, 8.5, 7.0, 5.5, 4.0, and 2.0 mg/mL by addition of formulation buffer. DLS measurements were performed in triplicates using the DynaPro Platereader II (Wyatt). Ten acquisitions were taken per sample using a laser at a wavelength of 830 nm and detecting the scattered light at an angle of 158°. The apparent hydrodynamic radius of diluted spherical particles was calculated using the Stoke-Einstein-Equation and plotted versus the protein concentration.
In vitro functional characterization of the DP
SPR spectroscopy was used to investigate the binding activity of mAb2 and its in silico optimized variant to their antigen (VEGF). All experiments were conducted using a Biacore T200 System equipped with a Protein A sensor chip (GE Healthcare). The Protein A Chip was conditioned for 30 s running a 10 mM Glycine buffer (pH 1.5) at a flow rate of 50 µl/min. For the SPR binding experiments, a 1 µg/ml antibody solution was injected for 120 s at a flow rate of 10 µl/min, followed by loading of a 10 µg/ml antigen solution for 120 s. Binding kinetics were determined by injection of 0.5 µg/ml antibody for 12 s at a flow rate of 10 µl/min, followed by a 120 s injection of an antigen concentration series at a flowrate of 50 µl/min. The resulting double-referenced curves were fitted to a 1:1 binding model. After each measurement, the chip surface was regenerated by injection of 10 mM Glycine (pH 1.5) for 30 s at 50 µl/min.
Nano scanning fluorimetry
Intrinsic fluorescence (IF) and light scattering measurements were performed using the Prometheus NT.48 fluorimeter (Nano Temper Technologies GmbH) equipped with standard capillaries. The onset (Ton), melting temperature (Tm) of unfolding, and the onset temperature (Tagg) of aggregation were determined in triplicates by applying a heating rate of 1°C/min between 20°C and 95°C.Citation41 Protein unfolding was obtained from the ratio of the intrinsic fluorescence signal at wavelengths 350 and 330 nm as a function of temperature. The Tm was calculated as local maxima of the first derivative curves using the ThermControl software (version 2.1.1). Aggregation was simultaneously recorded via light scattering at 385 nm. The Tagg was determined as the onset point of a two-state fit via the ThermControl software (version 2.1.1).
Differential scanning calorimetry
The MicroCal PEAQ-DSC automated calorimeter (Malvern) was used to characterize the unfolding of proteins in solutions that were diluted to 2 mg/mL by addition of formulation buffer. Thermograms were recorded in duplicates between 10°C and 95°C at a heating rate of 1°C/min using the MicroCal PEAQ-DSC software (version 1.30). Subsequently, the baseline was subtracted and the melting temperatures (Tm) of denaturation evaluated as the maxima and the integral of the specific heat capacity Cp plotted against the temperature.
Supplemental Material
Download Zip (25.5 MB)Acknowledgments
This research was supported by Christian Heinz, Torben Langer, Joey Studts, Annika Held, Patrick Schulz, Ingo Gorr, Harald Bradl, Angela Koller and Kerstin Walke from Boehringer Ingelheim Pharma GmbH & Co KG.
Disclosure statement
This research is sponsored by Boehringer Ingelheim and may lead to the development of products, in which I have a business interest. I have disclosed those interests fully to Taylor & Francis, and have in place an approved plan for managing any potential conflicts arising from this arrangement.
Supplementary material
Supplemental data for this article can be accessed here.
References
- Strohl WR, Knight DM. Discovery and development of biopharmaceuticals: current issues. Curr Opin Biotechnol. 2009;20:668–14. doi:https://doi.org/10.1016/j.copbio.2009.10.012.
- DiMasi JA. Innovating by developing new uses of already-approved drugs: trends in the marketing approval of supplemental indications. Clin Ther. 2013;35:808–18. doi:https://doi.org/10.1016/j.clinthera.2013.04.004.
- Evens RP. Pharma success in product development-does biotechnology change the paradigm in product development and attrition. AAPS J. 2016;18:281–85. doi:https://doi.org/10.1208/s12248-015-9833-6.
- Obrezanova O, Arnell A, de la Cuesta RG, Berthelot ME, Gallagher TR, Zurdo J, Stallwood Y. Aggregation risk prediction for antibodies and its application to biotherapeutic development. MAbs. 2015;7:352–63. doi:https://doi.org/10.1080/19420862.2015.1007828.
- Kunert R, Reinhart D. Advances in recombinant antibody manufacturing. Appl Microbiol Biotechnol. 2016;100:3451–61. doi:https://doi.org/10.1007/s00253-016-7388-9.
- van der Kant R, Karow-Zwick AR, Van Durme J, Blech M, Gallardo R, Seeliger D, Aßfalg K, Baatsen P, Compernolle G, Gils A, et al. Prediction and reduction of the aggregation of monoclonal antibodies. J Mol Biol. 2017;429:1244–61. doi:https://doi.org/10.1016/j.jmb.2017.03.014.
- Shukla AA, Hubbard B, Tressel T, Guhan S, Low D. Downstream processing of monoclonal antibodies–application of platform approaches. J Chromatogr B Analyt Technol Biomed Life Sci. 2007;848:28–39. doi:https://doi.org/10.1016/j.jchromb.2006.09.026.
- Gagnon P. Technology trends in antibody purification. J Chromatogr A. 2012;1221:57–70. doi:https://doi.org/10.1016/j.chroma.2011.10.034.
- Shire SJ. Formulation and manufacturability of biologics. Curr Opin Biotechnol. 2009;20:708–14. doi:https://doi.org/10.1016/j.copbio.2009.10.006.
- Wang W. Instability, stabilization, and formulation of liquid protein pharmaceuticals. Int J Pharm. 1999;185:129–88. doi:https://doi.org/10.1016/S0378-5173(99)00152-0.
- Shire SJ, Shahrokh Z, Liu J. Challenges in the development of high protein concentration formulations. J Pharm Sci. 2004;93:1390–402. doi:https://doi.org/10.1002/jps.20079.
- Nichols P, Li L, Kumar S, Buck PM, Singh SK, Goswami S, Balthazor B, Conley TR, Sek D, Allen MJ, et al. Rational design of viscosity reducing mutants of a monoclonal antibody: hydrophobic versus electrostatic inter-molecular interactions. MAbs. 2015;7:212–30. doi:https://doi.org/10.4161/19420862.2014.985504.
- Kumar S, Plotnikov NV, Rouse JC, Singh SK. Biopharmaceutical Informatics: supporting biologic drug development via molecular modelling and informatics. J Pharm Pharmacol. 2018;70:595–608. doi:https://doi.org/10.1111/jphp.12700.
- Popovic B, Gibson S, Senussi T, Carmen S, Kidd S, Slidel T, Strickland I, Jianqing X, Spooner J, Lewis A, et al. Engineering the expression of an anti-interleukin-13 antibody through rational design and mutagenesis.. Protein Eng Des Sel. 2017;30(4):303–11. doi:https://doi.org/10.1093/protein/gzx001.
- Shan L, Mody N, Sormani P, Rosenthal KL, Damschroder MM, Esfandiary R. Developability assessment of engineered monoclonal antibody variants with a complex self-association behavior using complementary analytical and in silico tools. Mol Pharm. 2018;15:5697–710. doi:https://doi.org/10.1021/acs.molpharmaceut.8b00867.
- Kumar S, Roffi K, Tomar DS, Cirelli D, Luksha N, Meyer D, Mitchell J, Allen MJ, Li L. Rational optimization of a monoclonal antibody for simultaneous improvements in its solution properties and biological activity. Protein Eng Des Sel. 2018;31(7–8):313–25. doi:https://doi.org/10.1093/protein/gzy020.
- Tomar DS, Li L, Broulidakis MP, Luksha NG, Burns CT, Singh SK, Kumar S. In-silico prediction of concentration-dependent viscosity curves for monoclonal antibody solutions. MAbs. 2017;9(3):476–89. doi:https://doi.org/10.1080/19420862.2017.1285479.
- Sharma VK, Patapoff TW, Kabakoff B, Pai S, Hilario E, Zhang B, Li C, Borisov O, Kelley RF, Chorny I. In silico selection of therapeutic antibodies for development: viscosity, clearance, and chemical stability. Proc Natl Acad Sci U S A. 2014;111(52):18601–06. doi:https://doi.org/10.1073/pnas.1421779112.
- Dobson CL, Devine PW, Phillips JJ, Higazi DR, Lloyd C, Popovic B, Arnold J, Buchanan A, Lewis A, Goodman J, et al. Engineering the surface properties of a human monoclonal antibody prevents self-association and rapid clearance in vivo. Sci Rep. 2016;6(1):38644. doi:https://doi.org/10.1038/srep38644.
- Tartaglia GG, Vendruscolo M. The Zyggregator method for predicting protein aggregation propensities. Chem Soc Rev. 2008;37:1395–401. doi:https://doi.org/10.1039/b706784b.
- Louros N, Konstantoulea K, De Vleeschouwer M, Ramakers M, Schymkowitz J, Rousseau F. WALTZ-DB 2.0: an updated database containing structural information of experimentally determined amyloid-forming peptides. Nucleic Acids Res. 2019;48(D1):D389–393.
- Maurer-Stroh S, Debulpaep M, Kuemmerer N, Lopez de la Paz M, Martins IC, Reumers J, Morris KL, Copland A, Serpell L, Serrano L, et al. Exploring the sequence determinants of amyloid structure using position-specific scoring matrices. Nat Methods. 2010;7(3):237–42. doi:https://doi.org/10.1038/nmeth.1432.
- Thompson MJ, Sievers SA, Karanicolas J, Ivanova MI, Baker D, Eisenberg D. The 3D profile method for identifying fibril-forming segments of proteins. Proc Natl Acad Sci U S A. 2006;103:4074–78. doi:https://doi.org/10.1073/pnas.0511295103.
- Rawat P, Kumar S, Michael Gromiha M. An in-silico method for identifying aggregation rate enhancer and mitigator mutations in proteins. Int J Biol Macromol. 2018;118:1157–67. doi:https://doi.org/10.1016/j.ijbiomac.2018.06.102.
- Sanchez de Groot N, Pallares I, Aviles FX, Vendrell J, Ventura S. Prediction of “hot spots” of aggregation in disease-linked polypeptides. BMC Struct Biol. 2005;5:18. doi:https://doi.org/10.1186/1472-6807-5-18.
- Trovato A, Seno F, Tosatto SC. The PASTA server for protein aggregation prediction. Protein Eng Des Sel. 2007;20:521–23. doi:https://doi.org/10.1093/protein/gzm042.
- Zibaee S, Makin OS, Goedert M, Serpell LC. A simple algorithm locates beta-strands in the amyloid fibril core of alpha-synuclein, Abeta, and tau using the amino acid sequence alone. Protein Sci. 2007;16:906–18. doi:https://doi.org/10.1110/ps.062624507.
- Frousios KK, Iconomidou VA, Karletidi CM, Hamodrakas SJ. Amyloidogenic determinants are usually not buried. BMC Struct Biol. 2009;9:44. doi:https://doi.org/10.1186/1472-6807-9-44.
- Tian J, Wu N, Guo J, Fan Y. Prediction of amyloid fibril-forming segments based on a support vector machine. BMC Bioinformatics. 2009;10(Suppl 1):S45. doi:https://doi.org/10.1186/1471-2105-10-S1-S45.
- Galzitskaya OV, Garbuzynskiy SO, Lobanov MY. Prediction of amyloidogenic and disordered regions in protein chains. PLoS Comput Biol. 2006;2:e177. doi:https://doi.org/10.1371/journal.pcbi.0020177.
- Chennamsetty N, Voynov V, Kayser V, Helk B, Trout BL. Design of therapeutic proteins with enhanced stability. Proc Natl Acad Sci U S A. 2009;106:11937–42. doi:https://doi.org/10.1073/pnas.0904191106.
- Van Durme J, De Baets G, Van Der Kant R, Ramakers M, Ganesan A, Wilkinson H, Gallardo R, Rousseau F, Schymkowitz J. Solubis: a webserver to reduce protein aggregation through mutation. Protein Eng Des Sel. 2016;29:285–89. doi:https://doi.org/10.1093/protein/gzw019.
- Fernandez-Escamilla AM, Rousseau F, Schymkowitz J, Serrano L. Prediction of sequence-dependent and mutational effects on the aggregation of peptides and proteins. Nat Biotechnol. 2004;22:1302–06. doi:https://doi.org/10.1038/nbt1012.
- Schymkowitz J, Borg J, Stricher F, Nys R, Rousseau F, Serrano L. The FoldX web server: an online force field. Nucleic Acids Res. 2005;33:W382–8. doi:https://doi.org/10.1093/nar/gki387.
- Davies SL, Lovelady CS, Grainger RK, Racher AJ, Young RJ, James DC. Functional heterogeneity and heritability in CHO cell populations. Biotechnol Bioeng. 2013;110:260–74. doi:https://doi.org/10.1002/bit.24621.
- Mason M, Sweeney B, Cain K, Stephens P, Sharfstein ST. Identifying bottlenecks in transient and stable production of recombinant monoclonal-antibody sequence variants in Chinese hamster ovary cells. Biotechnol Prog. 2012;28:846–55. doi:https://doi.org/10.1002/btpr.1542.
- Mathias S, Wippermann A, Raab N, Zeh N, Handrick R, Gorr I, Schulz P, Fischer S, Gamer M, Otte K. Unravelling what makes a monoclonal antibody difficult-to-express: from intracellular accumulation to incomplete folding and degradation via ERAD. Biotechnol Bioeng. 2019;117:5–16. doi:https://doi.org/10.1002/bit.27196.
- Gronemeyer P, Ditz R, Strube J. Trends in upstream and downstream process development for antibody manufacturing. Bioeng (Basel). 2014;1:188–212. doi:https://doi.org/10.3390/bioengineering1040188.
- Paborji M, Pochopin NL, Coppola WP, Bogardus JB. Chemical and physical stability of chimeric L6, a mouse-human monoclonal antibody. Pharm Res. 1994;11:764–71. doi:https://doi.org/10.1023/A:1018948901599.
- Zheng JY, Janis LJ. Influence of pH, buffer species, and storage temperature on physicochemical stability of a humanized monoclonal antibody LA298. Int J Pharm. 2006;308(1–2):46–51. doi:https://doi.org/10.1016/j.ijpharm.2005.10.024.
- Garidel P, Karow AR, Blech M. Orthogonal spectroscopic techniques for the early developability assessment of therapeutic protein candidates. Spectrosc Eur. 2014;26:9–13.
- Kommanaboyina B, Rhodes CT. Trends in stability testing, with emphasis on stability during distribution and storage. Drug Dev Ind Pharm. 1999;25:857–68. doi:https://doi.org/10.1081/DDC-100102246.
- Pokharana M, Vaishnav R, Goyal AAS. Stability testing guidelines of pharmaceutical products. J Drug Delivery Ther. 2018;8:169–75. doi:https://doi.org/10.22270/jddt.v8i2.1564.
- Sukumar M, Doyle BL, Combs JL, Pekar AH. Opalescent appearance of an IgG1 antibody at high concentrations and its relationship to noncovalent association. Pharm Res. 2004;21:1087–93. doi:https://doi.org/10.1023/B:PHAM.0000032993.98705.73.
- Tomar DS, Kumar S, Singh SK, Goswami S, Li L. Molecular basis of high viscosity in concentrated antibody solutions: strategies for high concentration drug product development. MAbs. 2016;8:216–28. doi:https://doi.org/10.1080/19420862.2015.1128606.
- Fuh G, Wu P, Liang WC, Ultsch M, Lee CV, Moffat B, Wiesmann C. Structure-function studies of two synthetic anti-vascular endothelial growth factor Fabs and comparison with the Avastin Fab. J Biol Chem. 2006;281:6625–31. doi:https://doi.org/10.1074/jbc.M507783200.
- Yadav S, Laue TM, Kalonia DS, Singh SN, Shire SJ. The influence of charge distribution on self-association and viscosity behavior of monoclonal antibody solutions. Mol Pharm. 2012;9:791–802. doi:https://doi.org/10.1021/mp200566k.
- Sormanni P, Aprile FA, Vendruscolo M. Third generation antibody discovery methods: in silico rational design. Chem Soc Rev. 2018;47:9137–57. doi:https://doi.org/10.1039/C8CS00523K.
- Pybus LP, James DC, Dean G, Slidel T, Hardman C, Smith A, Daramola O, Field R. Predicting the expression of recombinant monoclonal antibodies in Chinese hamster ovary cells based on sequence features of the CDR3 domain. Biotechnol Prog. 2014;30:188–97. doi:https://doi.org/10.1002/btpr.1839.
- Bentley KJ, Gewert R, Harris WJ. Differential efficiency of expression of humanized antibodies in transient transfected mammalian cells. Hybridoma. 1998;17:559–67. doi:https://doi.org/10.1089/hyb.1998.17.559.
- Hasegawa H, Hsu A, Tinberg CE, Siegler KE, Nazarian AA, Tsai MM. Single amino acid substitution in LC-CDR1 induces Russell body phenotype that attenuates cellular protein synthesis through eIF2alpha phosphorylation and thereby downregulates IgG secretion despite operational secretory pathway traffic. MAbs. 2017;9:854–73. doi:https://doi.org/10.1080/19420862.2017.1314875.
- Dwek RA. Biological importance of glycosylation. Dev Biol Stand. 1998;96:43–47.
- Reusch D, Tejada ML. Fc glycans of therapeutic antibodies as critical quality attributes. Glycobiology. 2015;25:1325–34. doi:https://doi.org/10.1093/glycob/cwv065.
- Goetze AM, Liu YD, Zhang Z, Shah B, Lee E, Bondarenko PV, Flynn GC. High-mannose glycans on the Fc region of therapeutic IgG antibodies increase serum clearance in humans. Glycobiology. 2011;21:949–59. doi:https://doi.org/10.1093/glycob/cwr027.
- Yu M, Brown D, Reed C, Chung S, Lutman J, Stefanich E, Wong A, Stephan J-P, Bayer R. Production, characterization and pharmacokinetic properties of antibodies with N-linked Mannose-5 glycans. MAbs. 2012;4(4):475–87. doi:https://doi.org/10.4161/mabs.20737.
- Shields RL, Namenuk AK, Hong K, Meng YG, Rae J, Briggs J, Xie D, Lai J, Stadlen A, Li B, et al. High resolution mapping of the binding site on human IgG1 for Fc gamma RI, Fc gamma RII, Fc gamma RIII, and FcRn and design of IgG1 variants with improved binding to the Fc gamma R. J Biol Chem. 2001;276:6591–604. doi:https://doi.org/10.1074/jbc.M009483200.
- Nimmerjahn F, Ravetch JV. Fcgamma receptors as regulators of immune responses. Nat Rev Immunol. 2008;8:34–47. doi:https://doi.org/10.1038/nri2206.
- Levy NE, Valente KN, Choe LH, Lee KH, Lenhoff AM. Identification and characterization of host cell protein product-associated impurities in monoclonal antibody bioprocessing. Biotechnol Bioeng. 2014;111:904–12. doi:https://doi.org/10.1002/bit.25158.
- Dwivedi M, Blech M, Presser I, Garidel P. Polysorbate degradation in biotherapeutic formulations: identification and discussion of current root causes. Int J Pharm. 2018;552:422–36. doi:https://doi.org/10.1016/j.ijpharm.2018.10.008.
- Goswami S, Wang W, Arakawa T, Ohtake S. Developments and Challenges for mAb-Based Therapeutics. Antibodies. 2013;2:452–500. doi:https://doi.org/10.3390/antib2030452.
- Garidel P, Kuhn AB, Schafer LV, Karow-Zwick AR, Blech M. High-concentration protein formulations: how high is high? Eur J Pharm Biopharm. 2017;119:353–60. doi:https://doi.org/10.1016/j.ejpb.2017.06.029.
- Yang Y, Velayudhan A, Thornhill NF, Farid SS. Multi-criteria manufacturability indices for ranking high-concentration monoclonal antibody formulations. Biotechnol Bioeng. 2017;114:2043–56. doi:https://doi.org/10.1002/bit.26329.
- Zurdo J. Developability assessment as an early de-risking tool for biopharmaceutical development. Pharm Bioprocess. 2013;1:29–50. doi:https://doi.org/10.4155/pbp.13.3.
- van der Kant R, Bauer J, Karow-Zwick AR, Kube S, Garidel P, Blech M, Rousseau F, Schymkowitz J Adaption of human antibody λ and κ light chain architectures to CDR repertoires. PEDS. 2019;32:109–127. doi:https://doi.org/10.1093/protein/gzz012.
- Krieger E, Vriend G. Models@Home: distributed computing in bioinformatics using a screensaver based approach. Bioinformatics. 2002;18:315–18.
- Siekierska A, De Baets G, Reumers J, Gallardo R, Rudyak S, Broersen K, Couceiro J, Van Durme J, Schymkowitz J, Rousseau F. alpha-Galactosidase aggregation is a determinant of pharmacological chaperone efficacy on Fabry disease mutants. J Biol Chem. 2012;287:28386–97. doi:https://doi.org/10.1074/jbc.M112.351056.
- Bergemann K, Eckermann C, Garidel P, Grammatikos S, Jacobi A, Kaufmann H, Kempken R, Pisch‐Heberle S. Production and downstream processing. In: Dübel S, editor. Handbook of therapeutic antibodies. Wiley-VCH. 2008. p. 199–237.
- Jacobi A, Enenkel B, Garidel P, Eckermann C, Knappenberger M, Presser I, Kaufmann H. Process development and manufacturing of therapeutic antibodies. In: Dübel S, editor. Handbook of therapeutic antibodies. Wiley-VCH. 2014. p. 601–64.
- Karow AR, Bahrenburg S, Garidel P. Buffer capacity of biologics–from buffer salts to buffering by antibodies. Biotechnol Prog. 2013;29:480–92. doi:https://doi.org/10.1002/btpr.1682.
- Zydney AL, Kurlyel R. Protein concentration and buffer exchange using ultrafiltration. In: Desai MA editor. Downstream processing of proteins. Methods in biotechnology. Totowa (NJ): Humana Press; 2000. p. 9.
- Garidel P, Herre A, Kliche W. Microscopic methods for particle characterization in protein pharmaceuticals. In: Mahler HC, Jiskoot W, editors. Analysis of aggregates and particles in protein pharmaceuticals. New Jersey: John Wiley & Sons; 2012. p. 269–302. doi:https://doi.org/10.1002/9781118150573.ch12
- Weinbuch D, Zolls S, Wiggenhorn M, Friess W, Winter G, Jiskoot W, Hawe A. Micro-flow imaging and resonant mass measurement (Archimedes)–complementary methods to quantitatively differentiate protein particles and silicone oil droplets. J Pharm Sci. 2013;102:2152–65. doi:https://doi.org/10.1002/jps.23552.